

Atorvastatin Attenuates Programmed Death Ligand-1 (PD-L1) Induction in Human Hepatocellular Carcinoma Cells
- PMID: 34445462
- PMCID: PMC8395726
- DOI: 10.3390/ijms22168755
Atorvastatin Attenuates Programmed Death Ligand-1 (PD-L1) Induction in Human Hepatocellular Carcinoma Cells
Abstract
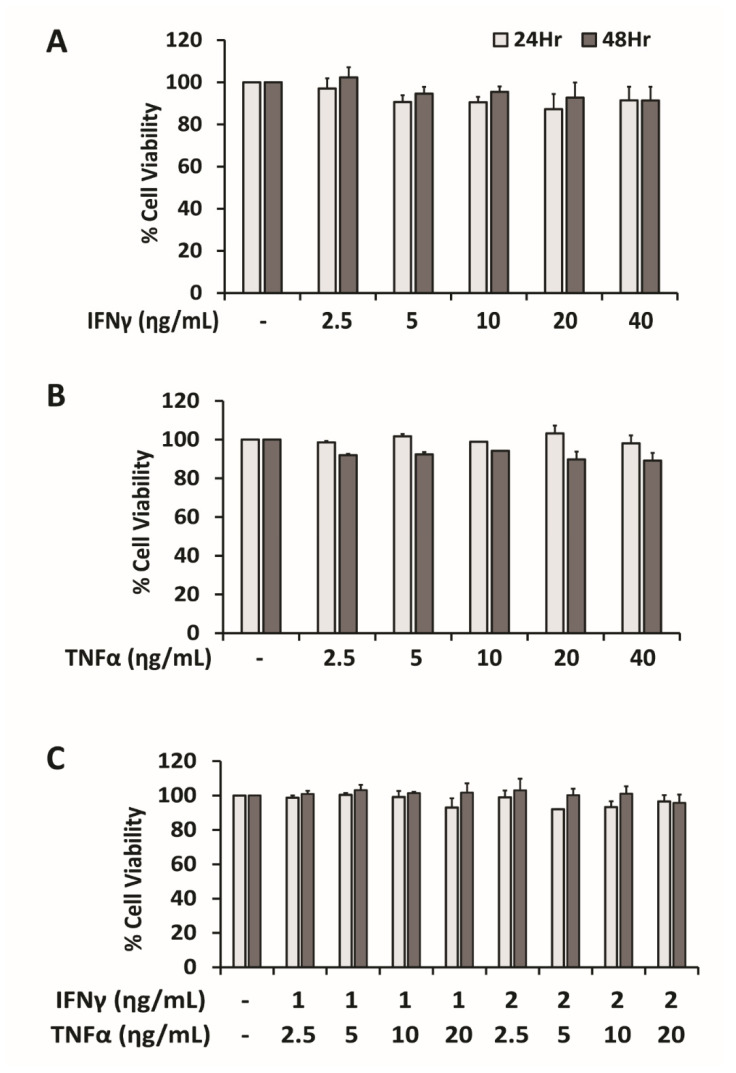
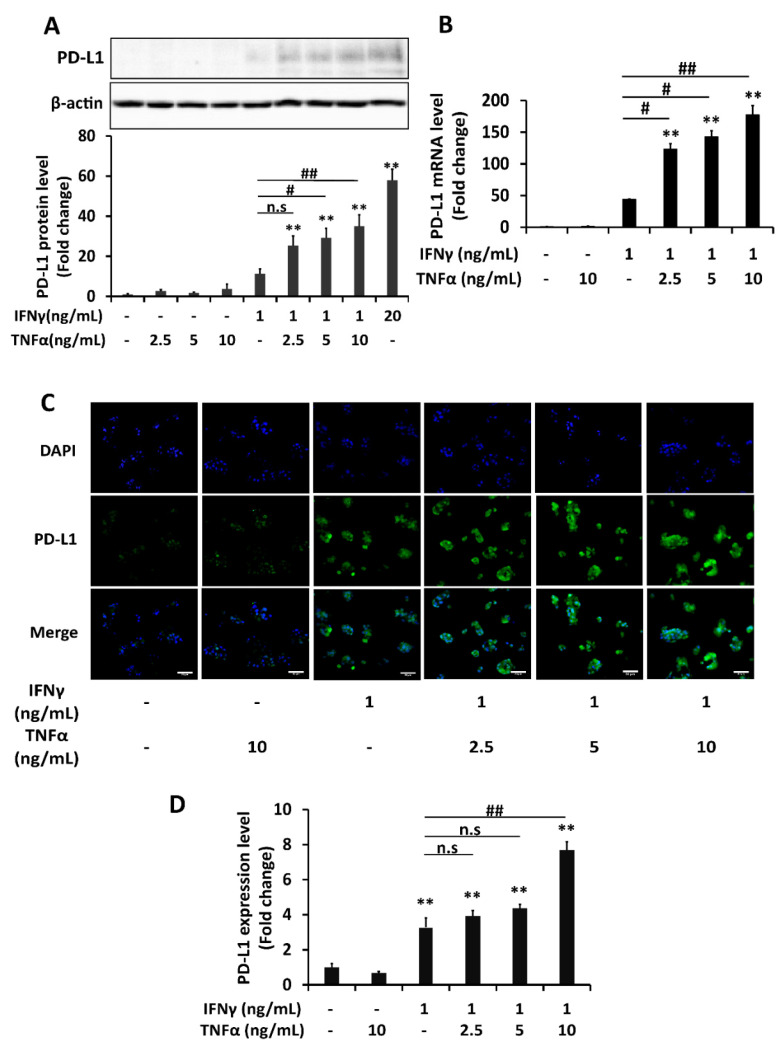
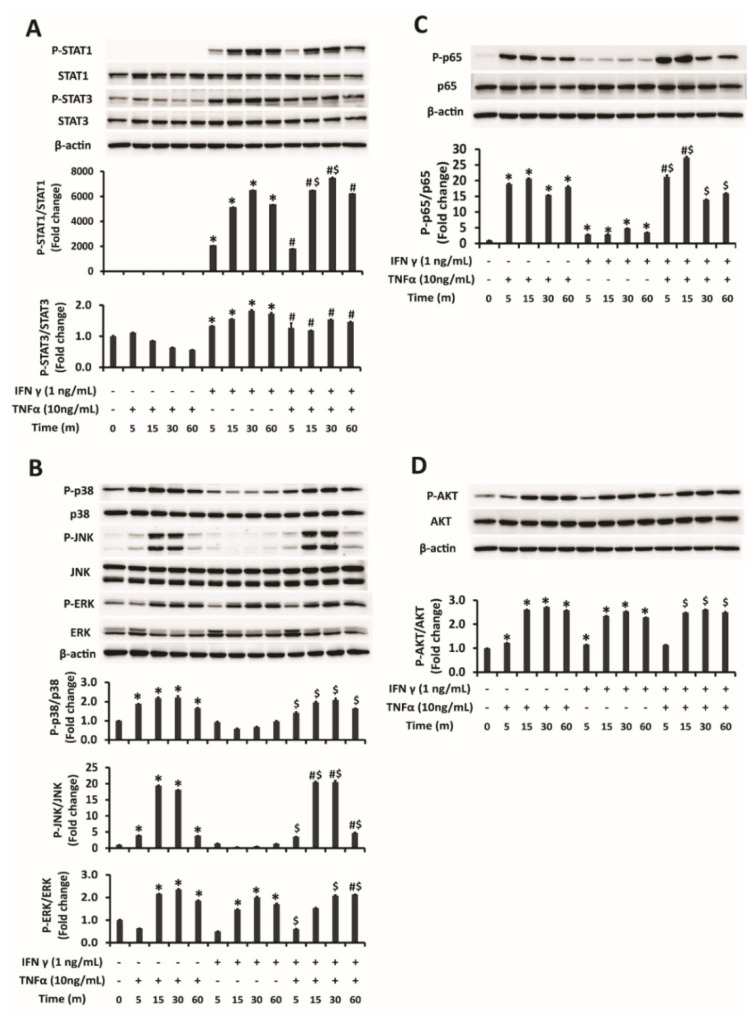
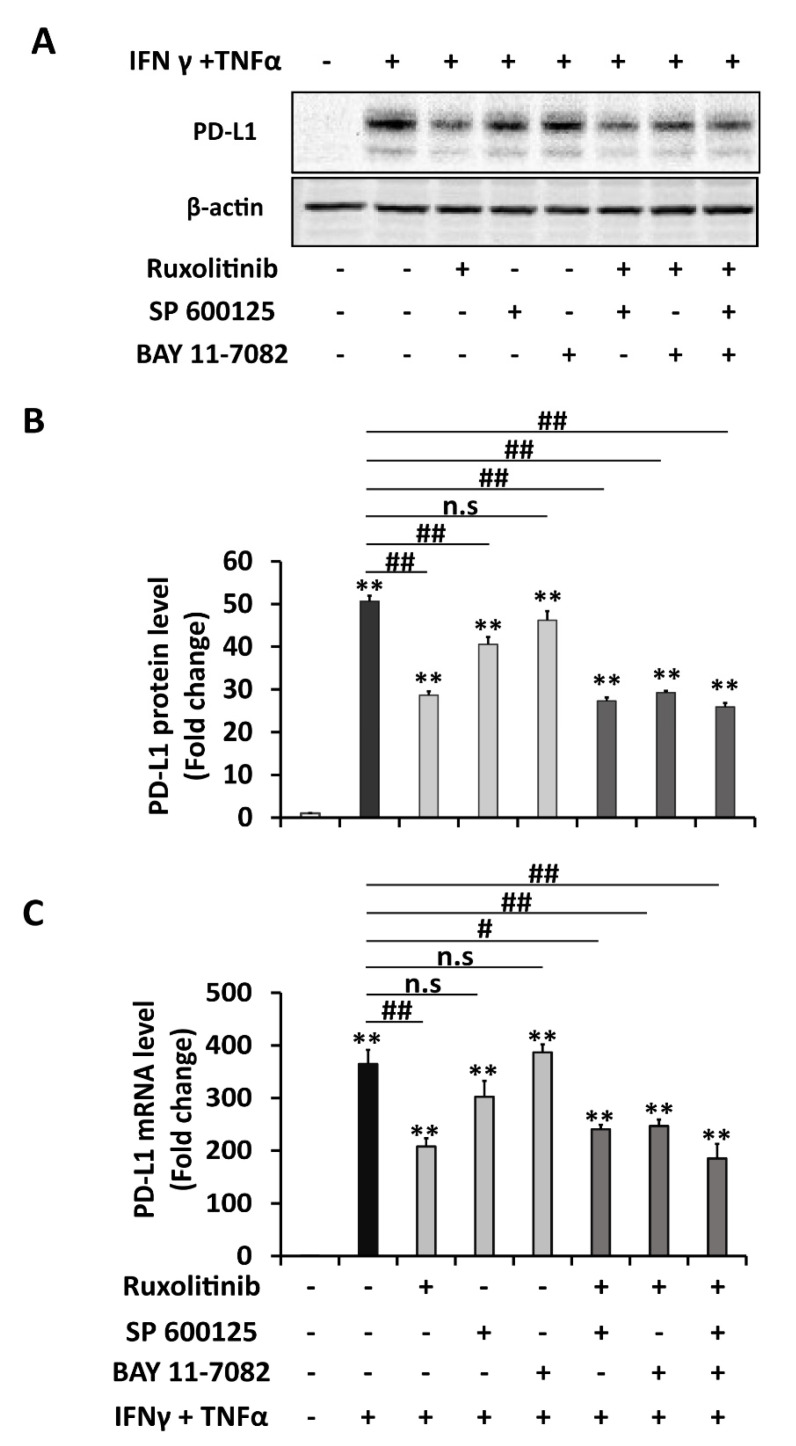
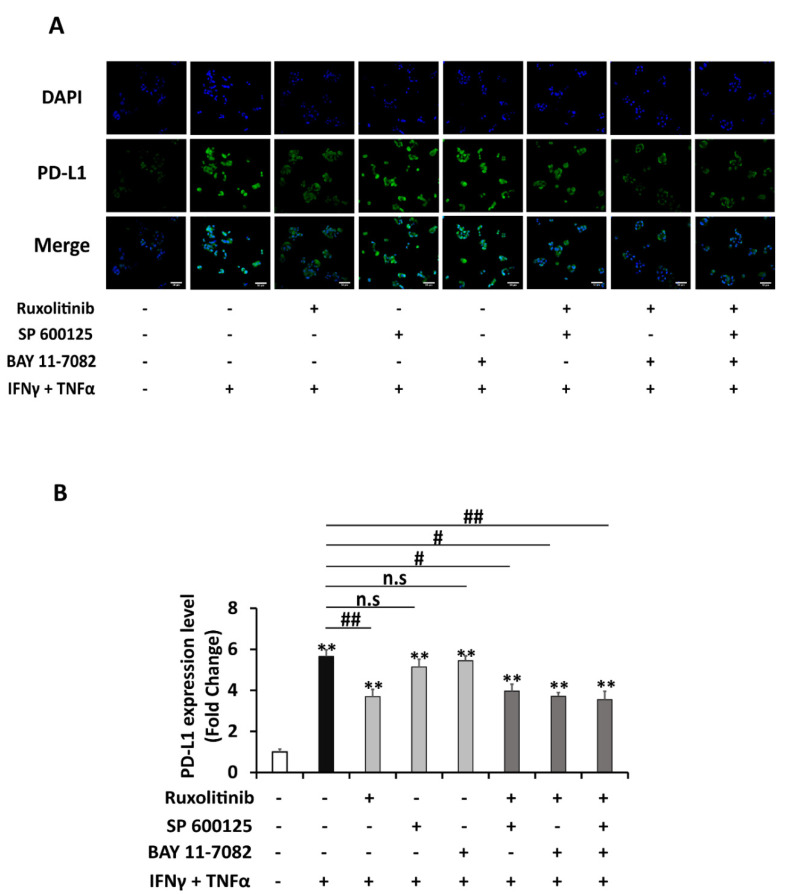
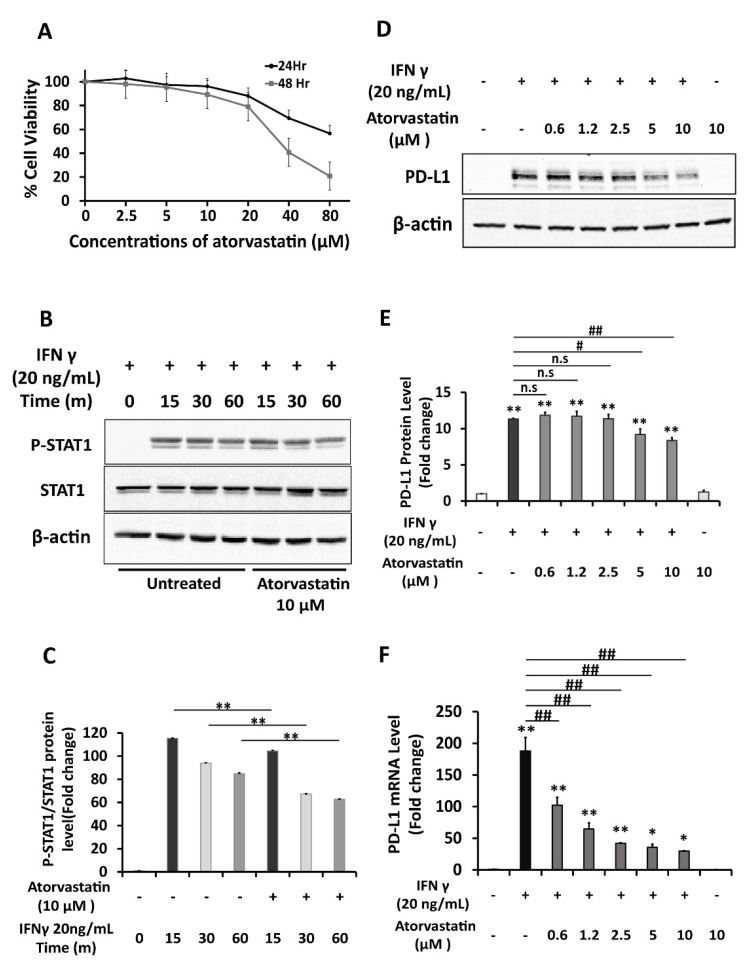
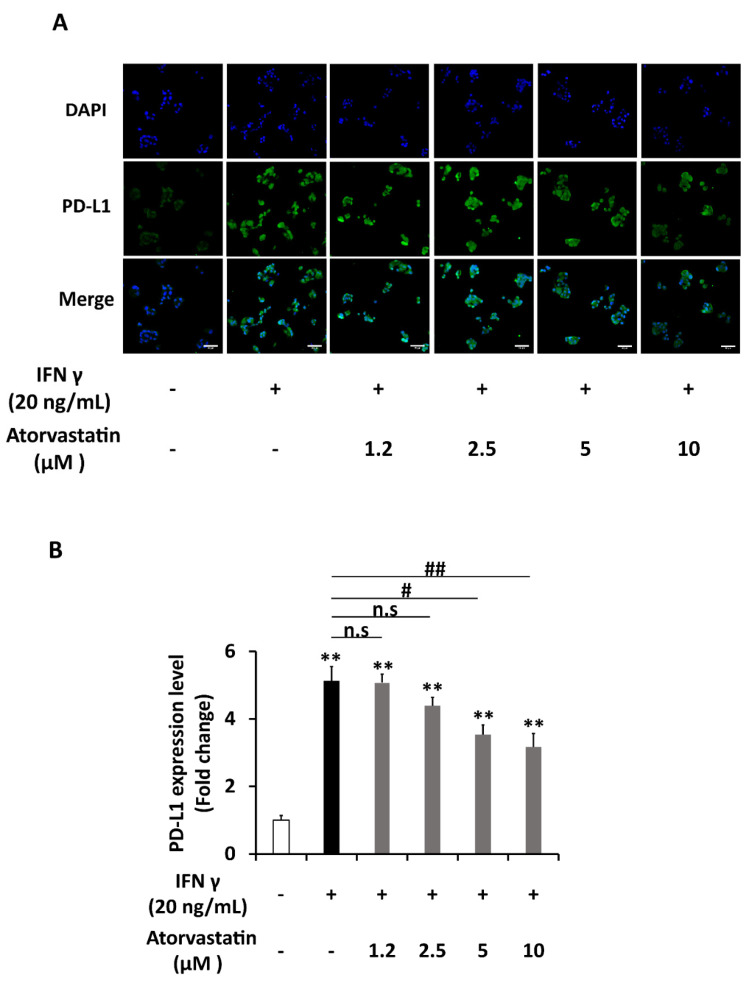
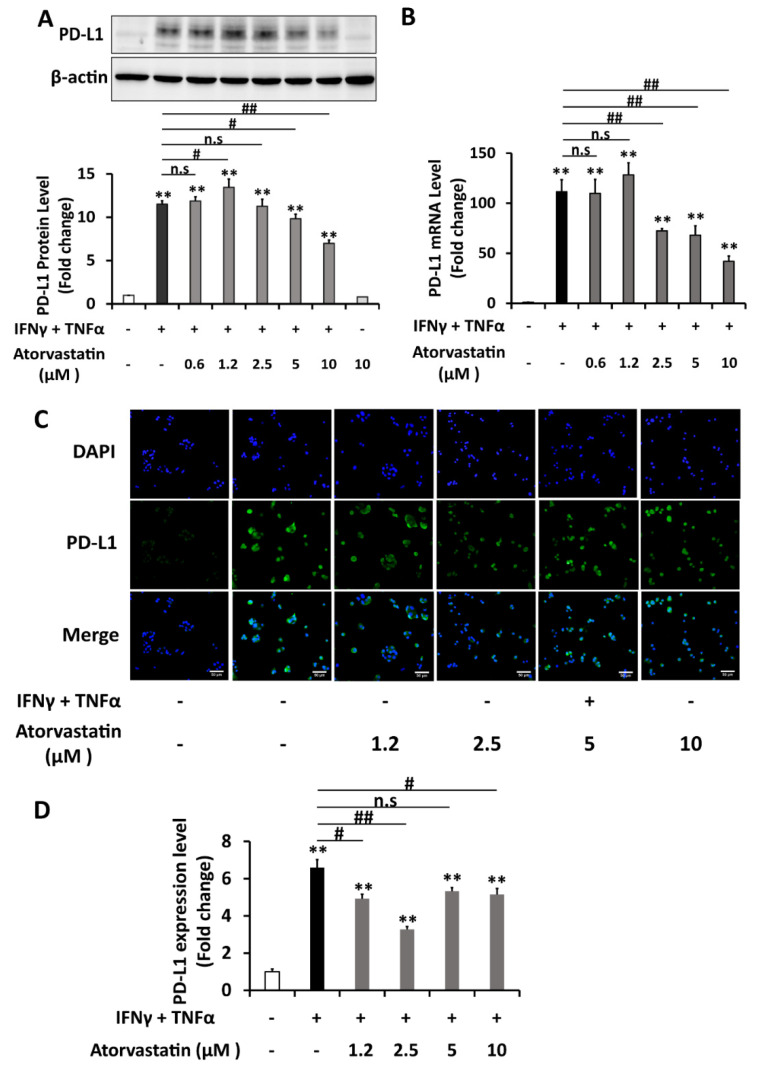
Liver cancer is the sixth most common cancer worldwide with high morbidity and mortality. Programmed death ligand 1 (PD-L1) is a major ligand of programmed death 1 receptor (PD1), and PD1/PD-L1 checkpoint acts as a negative regulator of the immune system. Cancers evade the host's immune defense via PD-L1 expression. This study aimed to investigate the effects of tumor-related cytokines, interferon gamma (IFNγ), and tumor necrosis factor alpha (TNFα) on PD-L1 expression in human hepatocellular carcinoma cells, HepG2. Furthermore, as atorvastatin, a cholesterol-lowering agent, is documented for its immunomodulatory properties, its effect on PD-L1 expression was investigated. In this study, through real-time RT-PCR, Western blot, and immunocytochemistry methods, PD-L1 expression in both mRNA and protein levels was found to be synergistically upregulated in HepG2 by a combination of IFNγ and TNFα, and STAT1 activation was mainly responsible for that synergistic effect. Next, atorvastatin can inhibit the induction of PD-L1 by either IFNγ alone or IFNγ/TNFα combination treatment in HepG2 cells. In conclusion, in HepG2 cells, expression of PD-L1 was augmented by cytokines in the tumor microenvironment, and the effect of atorvastatin on tumor immune response through inhibition of PD-L1 induction should be taken into consideration in cancer patients who have been prescribed atorvastatin.
Keywords: HepG2; IFNγ; PD-L1; TNFα; atorvastatin; liver cancer.
Conflict of interest statement
The authors have no conflict of interest to declare.
Figures
Similar articles
-
The polymorphism rs975484 in the protein arginine methyltransferase 1 gene modulates expression of immune checkpoint genes in hepatocellular carcinoma.J Biol Chem. 2020 May 15;295(20):7126-7137. doi: 10.1074/jbc.RA120.013401. Epub 2020 Apr 3. J Biol Chem. 2020. PMID: 32245889 Free PMC article.
-
Disruption of SIRT7 Increases the Efficacy of Checkpoint Inhibitor via MEF2D Regulation of Programmed Cell Death 1 Ligand 1 in Hepatocellular Carcinoma Cells.Gastroenterology. 2020 Feb;158(3):664-678.e24. doi: 10.1053/j.gastro.2019.10.025. Epub 2019 Oct 31. Gastroenterology. 2020. PMID: 31678303
-
Clinicopathologic Significance and Prognostic Value of Programmed Cell Death Ligand 1 (PD-L1) in Patients With Hepatocellular Carcinoma: A Meta-Analysis.Front Immunol. 2018 Sep 11;9:2077. doi: 10.3389/fimmu.2018.02077. eCollection 2018. Front Immunol. 2018. PMID: 30254644 Free PMC article.
-
IL-6 and PD-L1 blockade combination inhibits hepatocellular carcinoma cancer development in mouse model.Biochem Biophys Res Commun. 2017 Apr 29;486(2):239-244. doi: 10.1016/j.bbrc.2017.02.128. Epub 2017 Mar 1. Biochem Biophys Res Commun. 2017. PMID: 28254435
-
Programmed cell death protein-1 (PD-1)/programmed death-ligand-1 (PD-L1) axis in hepatocellular carcinoma: prognostic and therapeutic perspectives.Clin Transl Oncol. 2019 Jun;21(6):702-712. doi: 10.1007/s12094-018-1975-4. Epub 2018 Nov 1. Clin Transl Oncol. 2019. PMID: 30387047 Review.
Cited by
-
Comedications with Immune Checkpoint Inhibitors: Involvement of the Microbiota, Impact on Efficacy and Practical Implications.Cancers (Basel). 2023 Apr 13;15(8):2276. doi: 10.3390/cancers15082276. Cancers (Basel). 2023. PMID: 37190203 Free PMC article. Review.
-
Concomitant Statins and the Survival of Patients with Non-Small-Cell Lung Cancer Treated with Immune Checkpoint Inhibitors: A Meta-Analysis.Int J Clin Pract. 2022 Jul 5;2022:3429462. doi: 10.1155/2022/3429462. eCollection 2022. Int J Clin Pract. 2022. PMID: 35855055 Free PMC article. Review.
-
Don't Judge a Book by Its Cover: The Role of Statins in Liver Cancer.Cancers (Basel). 2023 Oct 22;15(20):5100. doi: 10.3390/cancers15205100. Cancers (Basel). 2023. PMID: 37894467 Free PMC article. Review.
References
-
- Chen H.J., Hu M., Xu F.G., Xu H.J., She J.J., Xia H.P. Understanding the inflammation-cancer transformation in the development of primary liver cancer. Hepatoma. Res. 2018;4:29. doi: 10.20517/2394-5079.2018.18. - DOI
-
- Fu J., Xu D., Liu Z., Shi M., Zhao P., Fu B., Zhang Z., Yang H., Zhang H., Zhou C., et al. Increased regulatory T cells correlate with CD8 T-cell impairment and poor survival in hepatocellular carcinoma patients. Gastroenterology. 2007;132:2328–2339. doi: 10.1053/j.gastro.2007.03.102. - DOI - PubMed
MeSH terms
Substances
Grants and funding
LinkOut - more resources
Full Text Sources
Medical
Research Materials
Miscellaneous
