. 2021 Aug 16;22(16):8800.
doi: 10.3390/ijms22168800.

Astrocytes Stimulate Microglial Proliferation and M2 Polarization In Vitro through Crosstalk between Astrocytes and Microglia

Affiliations

Astrocytes Stimulate Microglial Proliferation and M2 Polarization In Vitro through Crosstalk between Astrocytes and Microglia

Sumin Kim et al. Int J Mol Sci. .

Abstract

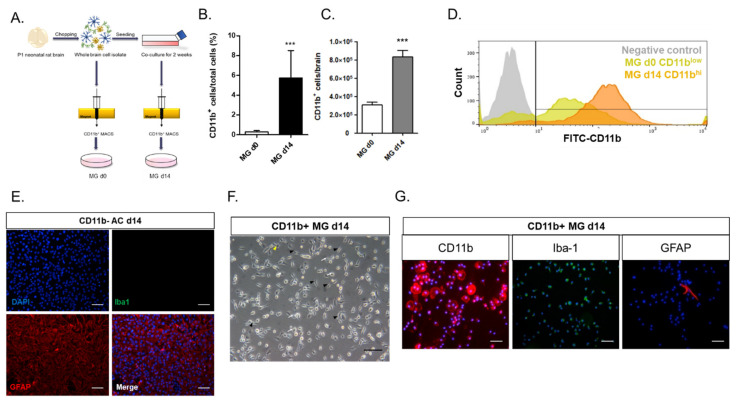
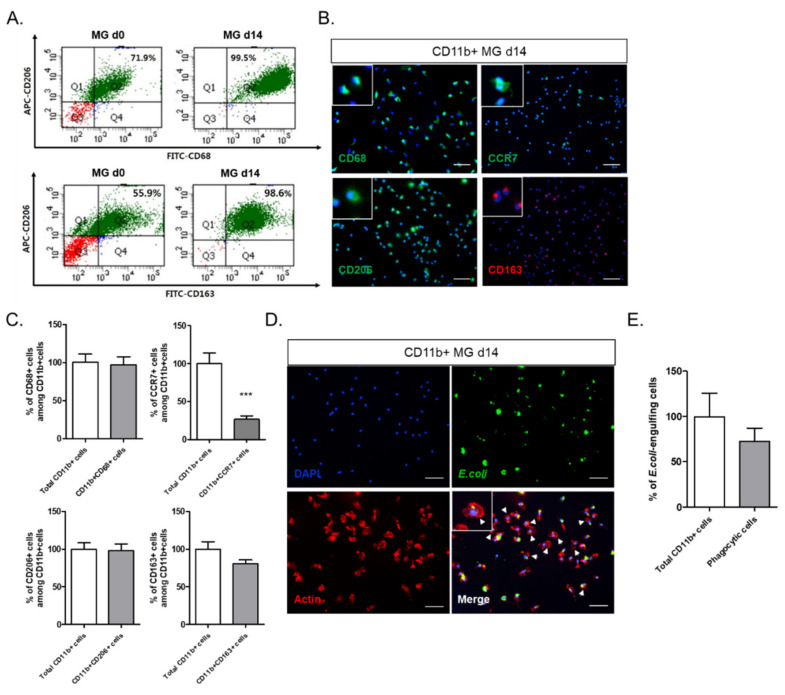
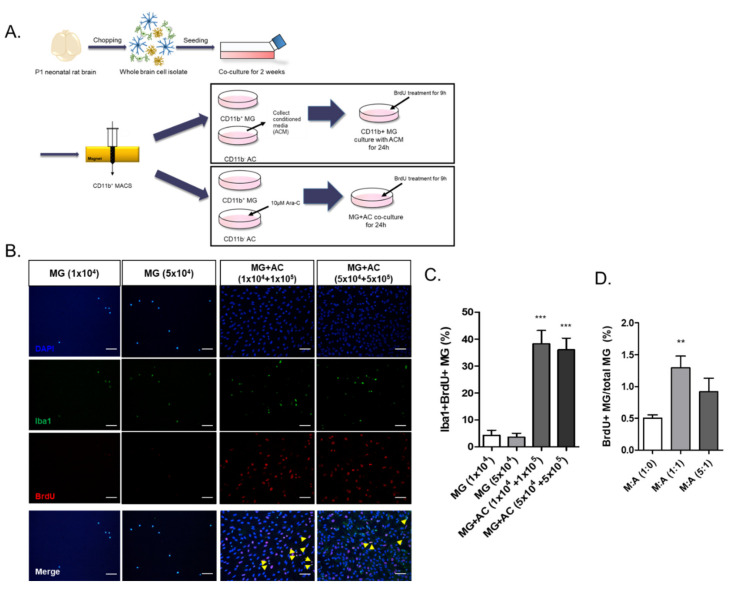
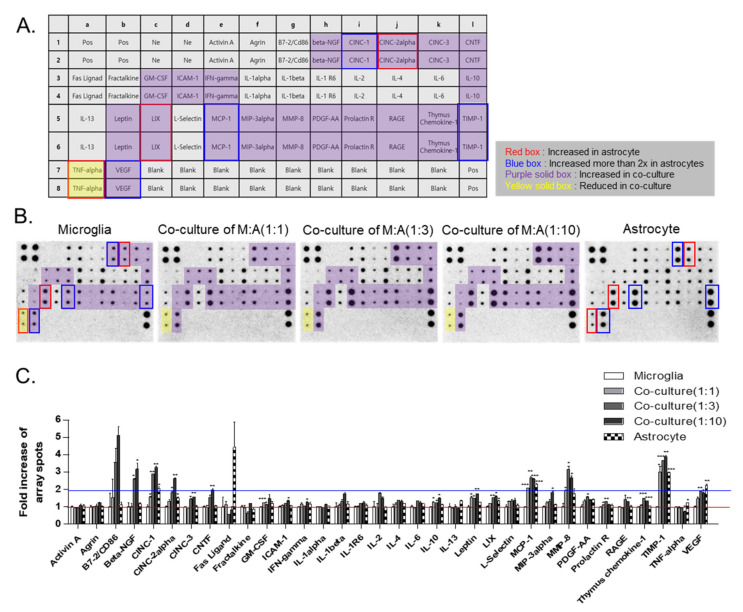
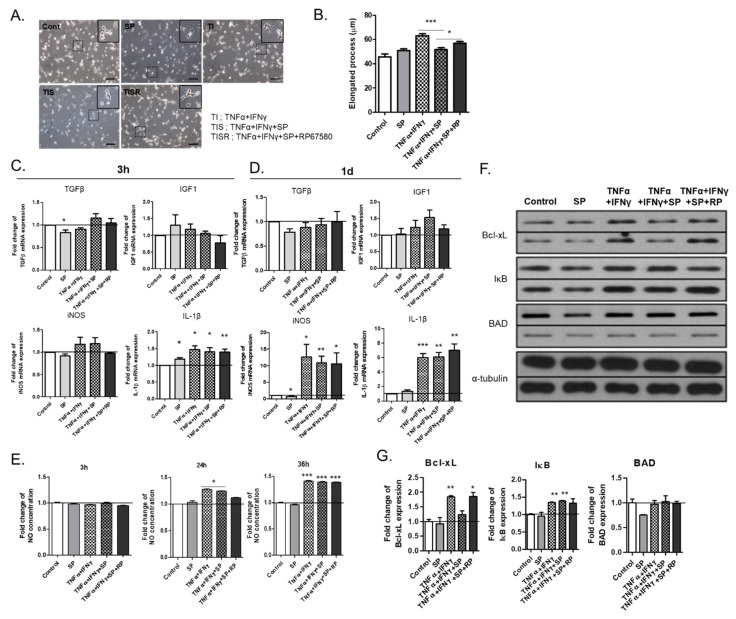
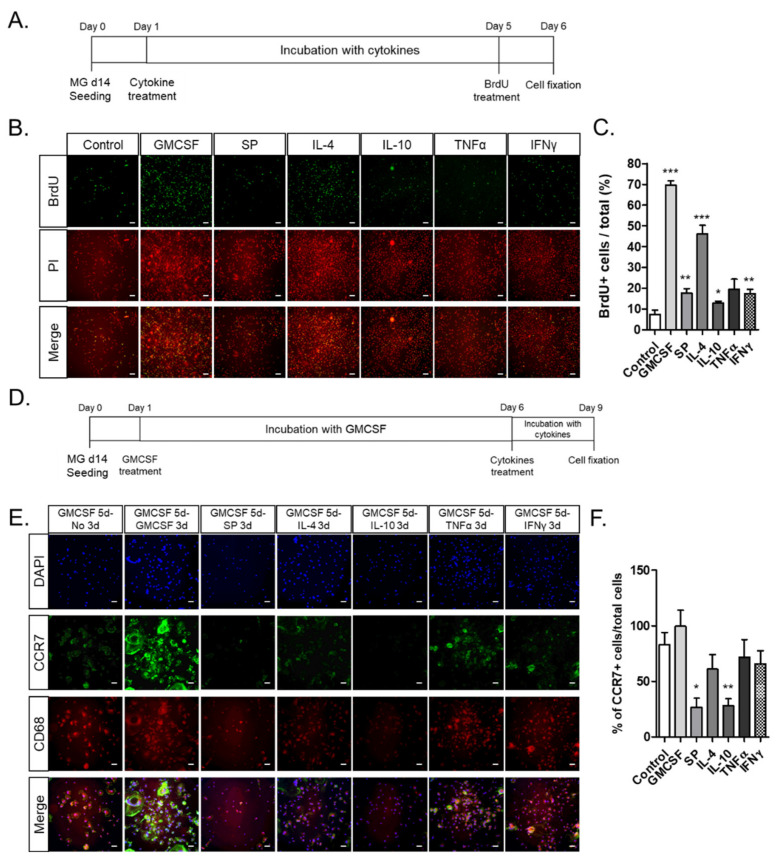
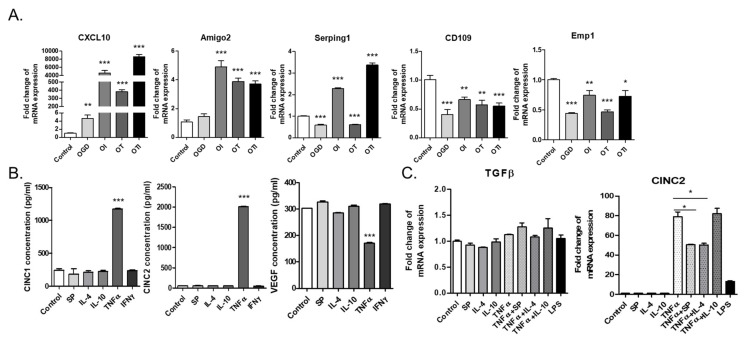
Microglia are resident immune cells of the central nervous system that act as brain-specific macrophages and are also known to regulate the innate immune functions of astrocytes through secretory molecules. This communication plays an important role in brain functions and homeostasis as well as in neuropathologic disease. In this study, we aimed to elucidate whether astrocytes and microglia could crosstalk to induce microglial polarization and proliferation, which can be further regulated under a microenvironment mimicking that of brain stroke. Microglia in a mixed glial culture showed increased survival and proliferation and were altered to M2 microglia; CD11b-GFAP+ astrocytes resulted in an approximately tenfold increase in microglial cell proliferation after the reconstitution of astrocytes. Furthermore, GM-CSF stimulated microglial proliferation approximately tenfold and induced them to become CCR7+ M1 microglia, which have a phenotype that could be suppressed by anti-inflammatory cytokines such as IL-4, IL-10, and substance P. In addition, the astrocytes in the microglial co-culture showed an A2 phenotype; they could be activated to A1 astrocytes by TNF-α and IFN-γ under the stroke-mimicking condition. Altogether, astrocytes in the mixed glial culture stimulated the proliferation of the microglia and M2 polarization, possibly through the acquisition of the A2 phenotype; both could be converted to M1 microglia and A1 astrocytes under the inflammatory stroke-mimicking environment. This study demonstrated that microglia and astrocytes could be polarized to M2 microglia and A2 astrocytes, respectively, through crosstalk in vitro and provides a system with which to explore how microglia and astrocytes may behave in the inflammatory disease milieu after in vivo transplantation.

Keywords: M1/M2 polarization; astrocyte; microglia; microglia and astrocyte crosstalk.


Conflict of interest statement

The authors declare no conflict of interest.

Figures

Figure 1
Figure 1
CD11b/GFAP+ astrocyte from whole brain culture induced microglial proliferation and activation: (A) the experimental scheme of microglial isolation by MACS. Day 0 microglia were isolated immediately from whole brain cell isolates by CD11b+ MACS, and Day 14 microglia were isolated from the 2-week mixed glial cell culture; (B) the CD11b+ cell yield of MG d0 and MG d14 (n = 11); (C) the numbers of CD11b+ cells per brain for MG d0 and MG d14 (n = 11); (D) flow cytometry analysis of MG d0 and MG d14 with the microglia-specific marker CD11b. Fluorescent intensity of CD11b was enhanced in MG d14 compared to that of MG d0; (E) fluorescence images for CD11b cells sorted from the 2-week mixed glial cell culture stained for microglia-specific marker iba-1 and astrocyte-specific marker GFAP; (F) bright field image of MG d14. Yellow arrowhead: ramified microglia; black arrowhead: bipolar-shape microglia; white arrow: round-shape microglia; (G) fluorescence images of MG d14 stained with microglia-specific markers CD11b and iba-1 and astrocyte-specific marker GFAP. *** p < 0.001; scale bar = 100 μm.
Figure 2
Figure 2
Phenotypic identity of MG d14 as M2 microglia: (A) flow cytometry analysis of MG d0 and MG d14 with CD206, CD68, and CD163 antibodies. CD206+CD68+ cells and CD206+CD163+ cells increased in MG d14; (B) fluorescence images of CD68, CCR7, CD206, and CD163 in MG d14. Left white box: magnified image of each marker positive cell. (C) quantitative analysis of CD68+, CCR7+, CD206+, and CD163+ cells among CD11b+ cells. (n = 5); (D) fluorescence image of the phagocytosis assay of MG d14. Left white box: magnified image of E. coli-particle-positive cells. White arrowhead: actin ruffles; (E) quantitative analysis of E. coli-particle-engulfing cells among MG d14 (n = 5). *** p < 0.001; scale bar = 100 μm.
Figure 3
Figure 3
Astrocytes directly increased microglial proliferation: (A) the experimental scheme of microglial co-culture with astrocytes and treatment of ACM; (B) the BrdU-incorporation assay for the MG d14 co-cultured with astrocytes. Yellow arrowhead: Iba-1+BrdU+ cells; (C) the quantitative data of the percentage of BrdU+ cells under co-culture of astrocytes (n = 5); (D) quantitative data of the percentage of BrdU+ cells under treatment of ACM to MG d14 (n = 5). ** p < 0.01, *** p < 0.001, n = 3; scale bar = 100 μm.
Figure 4
Figure 4
The secretome analysis of single or co-culture of microglia and astrocytes with rat cytokine array: (A) cytokine array map. The array can detect 34 soluble mediators. Pos: positive control; Ne: negative control. (B) The cytokine arrays were performed with conditioned medium of microglia, astrocyte single culture, or microglia–astrocyte co-culture in various ratios. (C) The quantitative data of the fold increase in array spots between microglia, astrocyte single culture, and microglia–astrocyte co-culture. Red line: 1x baseline of array spots; Blue line: 2x baseline of array spots. * p < 0.05, ** p < 0.01, and *** p < 0.001.
Figure 5
Figure 5
M1 polarization of MG d14 induced by treatment with TNF-α and IFN-γ: (A) Bright field images of microglia cultured with TNF-α and IFN-γ; microglia cultured with TNF-α, IFN-γ, and SP; and microglia cultured with TNF-α, IFN-γ, SP, and RP67580 (RP, an NK1 receptor antagonist). (B) quantitative data for elongated processes of microglia under various cytokine treatments; (C,D) quantitative data for mRNA expression of TGF-β, IGF1, iNOS, and IL-1β at 3 h after treatment (C) and one day after treatment (D) (n = 3). Black line: 1x baseline of mRNA expression; (E) Quantitative data of NO production in various cytokine combinations at different time points (n = 3). Black line: 1x baseline of NO concentration; (F) the Western blot analysis of Bcl-xL, IκB, and BAD in microglia cultured with TNF-α, IFN-γ, SP, and RP67580; (G) quantitative data of Bcl-xL, IκB, and BAD expression (n = 3). Black line: 1x baseline of protein expression. * p < 0.05, ** p < 0.01, and *** p < 0.001; scale bar = 100 μm.
Figure 6
Figure 6
Activation of MG d14 cell proliferation and M1 skewing by GM-CSF and suppression of M1 polarization by GM-CSF removal and subsequent treatment with M2 cytokines: SP, IL-4, and IL-10. (AC) the experimental scheme of the cytokine and BrdU treatment. MG d14 were incubated with the following cytokines for five days: GM-CSF, SP, IL-4, IL-10, and TNF-α or IFN-γ (A). The BrdU-incorporation assay (B) and the quantitative data for the percentage of BrdU+ cells (C); (DF) the experimental scheme of the cytokine and BrdU treatment. MG d14 were pre-treated with GM-SCF for five days and then incubated with the following cytokines for three days: GMCSF, SP, IL-4, IL-10, and TNF-α or IFN-γ (D); fluorescence images stained with activated microglia marker CD68 and M1 microglia marker CCR7 (E). Quantitative data for CCR7+ cells among total cells (F) (n = 5); * p < 0.05, ** p < 0.01, and *** p < 0.001; scale bar = 100 μm.
Figure 7
Figure 7
Phenotypic identity of reactive astrocytes in the mixed glial cell culture as A2 astrocytes: (A) quantitative analysis of AC d14 with CXCL10 (pan reactive astrocyte marker), Amigo2, Serping1 (A1 astrocyte markers), CD109, and Emp1 (A2 astrocyte markers) mRNA expression. (n = 3) OGD: oxygen glucose deprivation; OI: IFN-γ treatment after OGD; OT: TNF-α treatment after OGD; OTI: TNF-α + IFN-γ treatment after OGD. (B) ELISA of CINC-1, CINC-2, and VEGF secreted by AC d14 cultured with various cytokines (n = 3); (C) quantitative analysis of TGF-β and CINC-2 mRNA expression in AC d14 cultured with various cytokines (n = 3). * p < 0.05, ** p < 0.01, and *** p < 0.001.

References

    1. Zhang S.-C. Defining glial cells during CNS development. Nat. Rev. Neurosci. 2001;2:840–843. doi: 10.1038/35097593. - DOI - PubMed
    1. Pierre W.C., Smith P.L.P., Londono I., Chemtob S., Mallard C., Lodygensky G.A. Neonatal microglia: The cornerstone of brain fate. Brain Behav. Immun. 2017;59:333–345. doi: 10.1016/j.bbi.2016.08.018. - DOI - PubMed
    1. Taylor S.E., Morganti-Kossmann C., Lifshitz J., Ziebell J.M. Rod microglia: A morphological definition. PLoS ONE. 2014;9:e97096. doi: 10.1371/journal.pone.0097096. - DOI - PMC - PubMed
    1. Cherry J.D., Olschowka J.A., O’Banion M.K. Neuroinflammation and M2 microglia: The good, the bad, and the inflamed. J. Neuroinflamm. 2014;11:98. doi: 10.1186/1742-2094-11-98. - DOI - PMC - PubMed
    1. Ma Y., Wang J., Wang Y., Yang G.-Y. The biphasic function of microglia in ischemic stroke. Prog. Neurobiol. 2016;157:247–272. doi: 10.1016/j.pneurobio.2016.01.005. - DOI - PubMed

Substances