. 2021 Aug 18;22(16):8907.
doi: 10.3390/ijms22168907.

Trace Amine-Associated Receptor 1 Contributes to Diverse Functional Actions of O-Phenyl-Iodotyramine in Mice but Not to the Effects of Monoamine-Based Antidepressants

Affiliations

Trace Amine-Associated Receptor 1 Contributes to Diverse Functional Actions of O-Phenyl-Iodotyramine in Mice but Not to the Effects of Monoamine-Based Antidepressants

Ioannis Mantas et al. Int J Mol Sci. .

Abstract

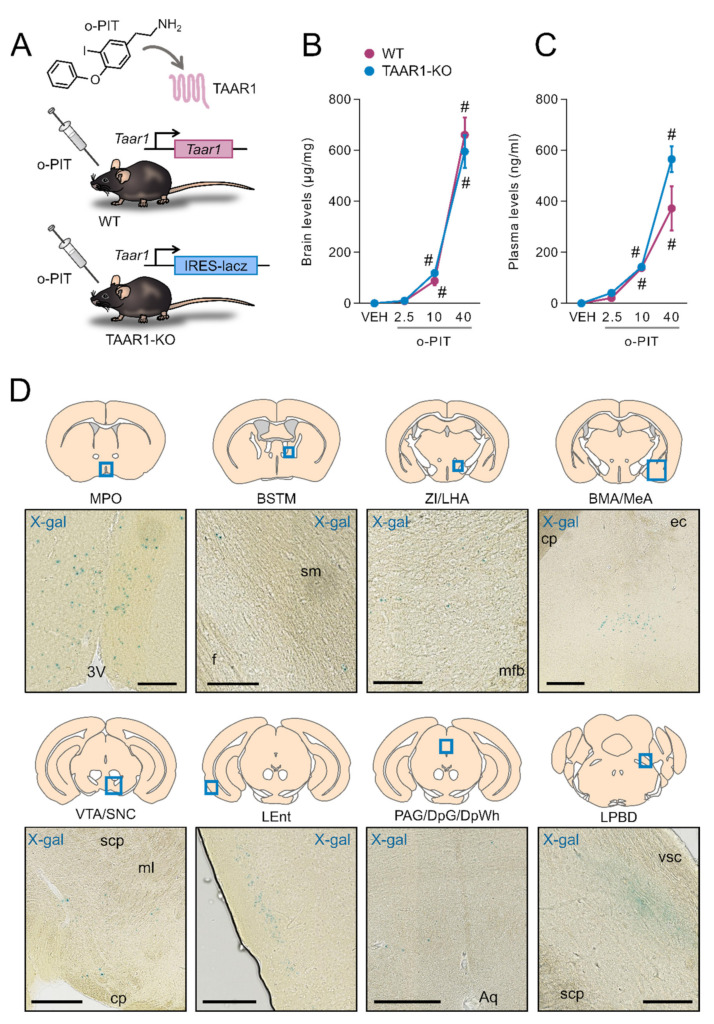
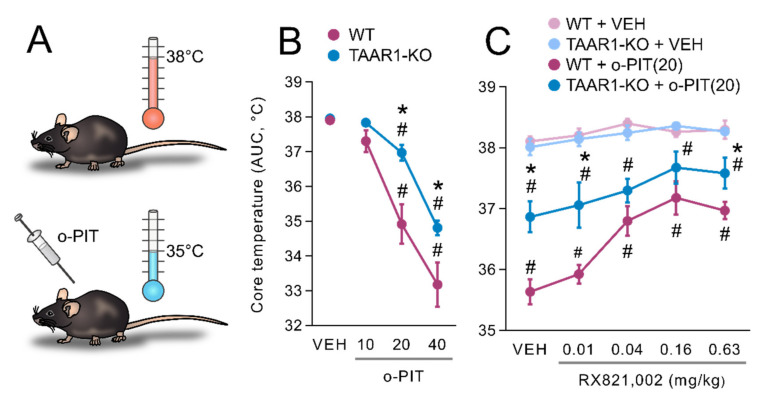
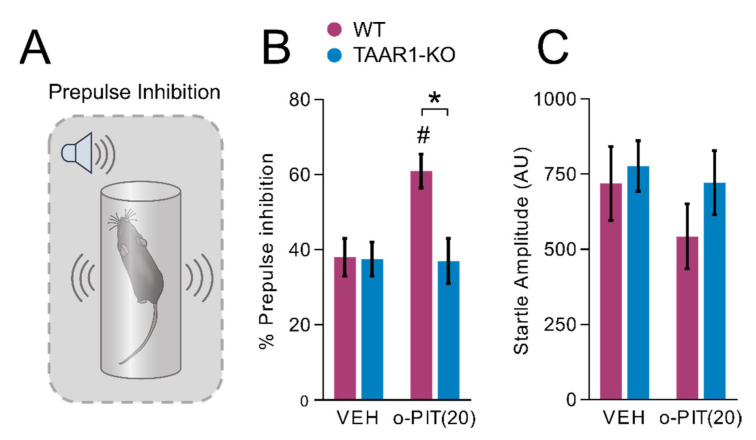
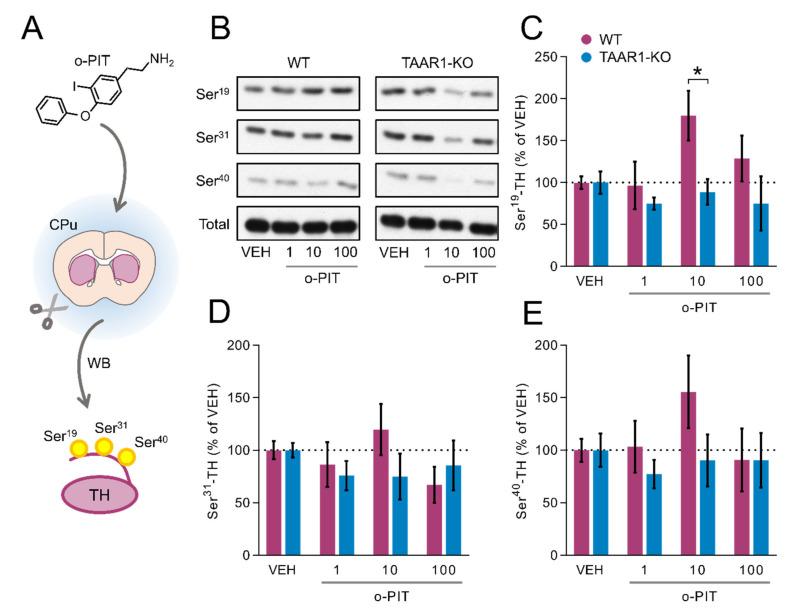
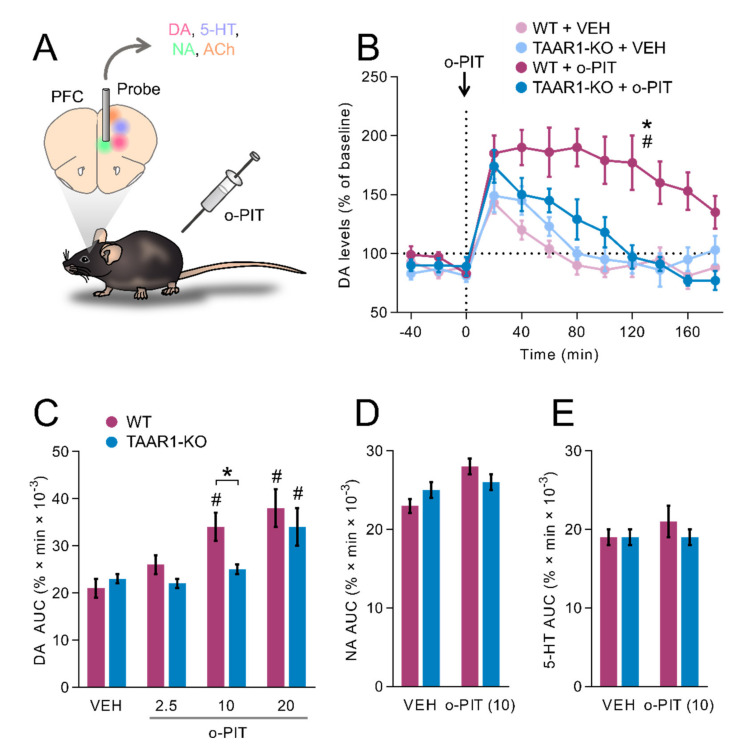
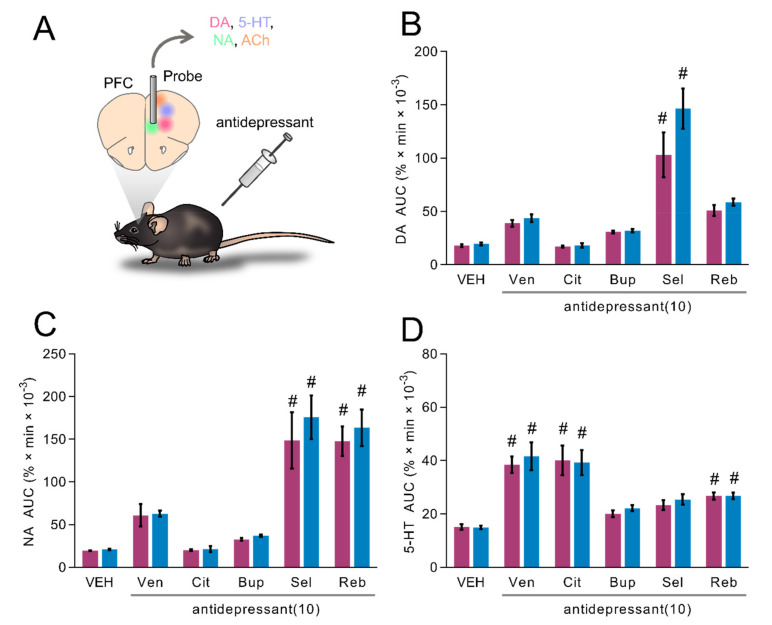
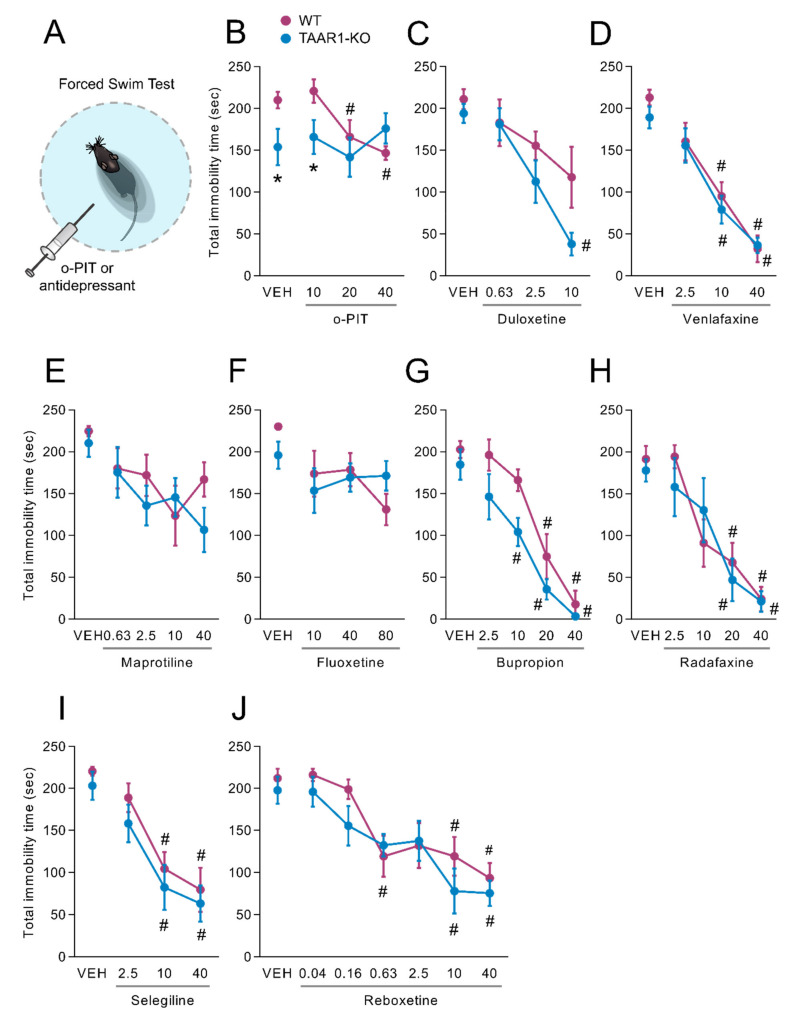
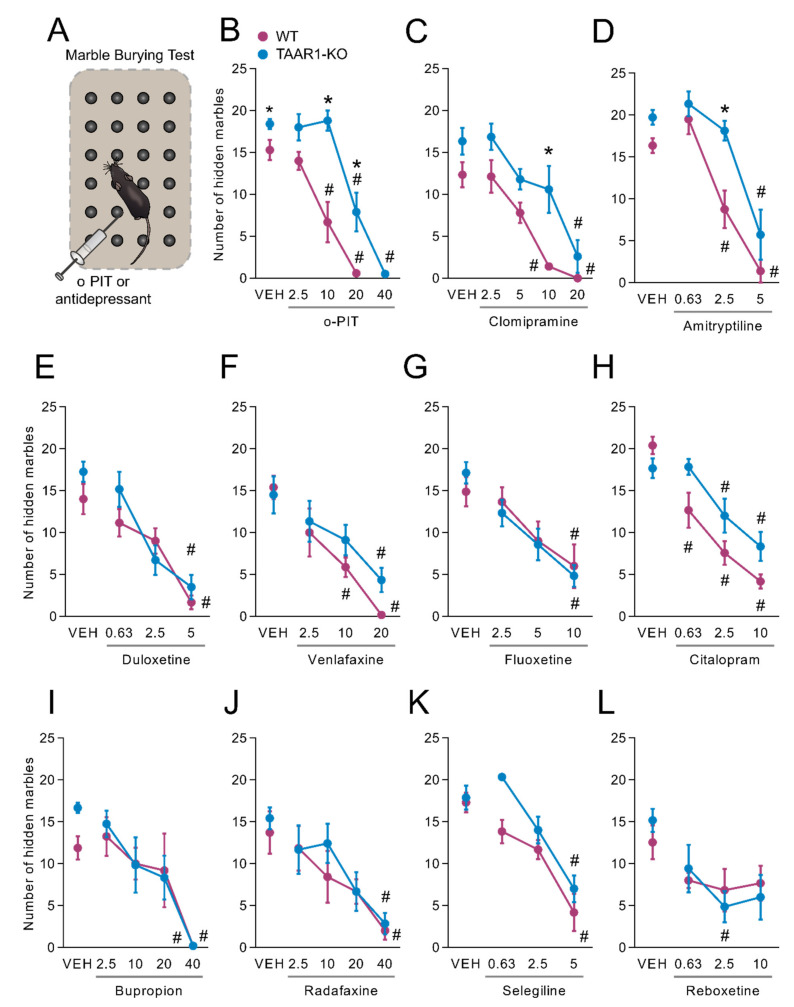
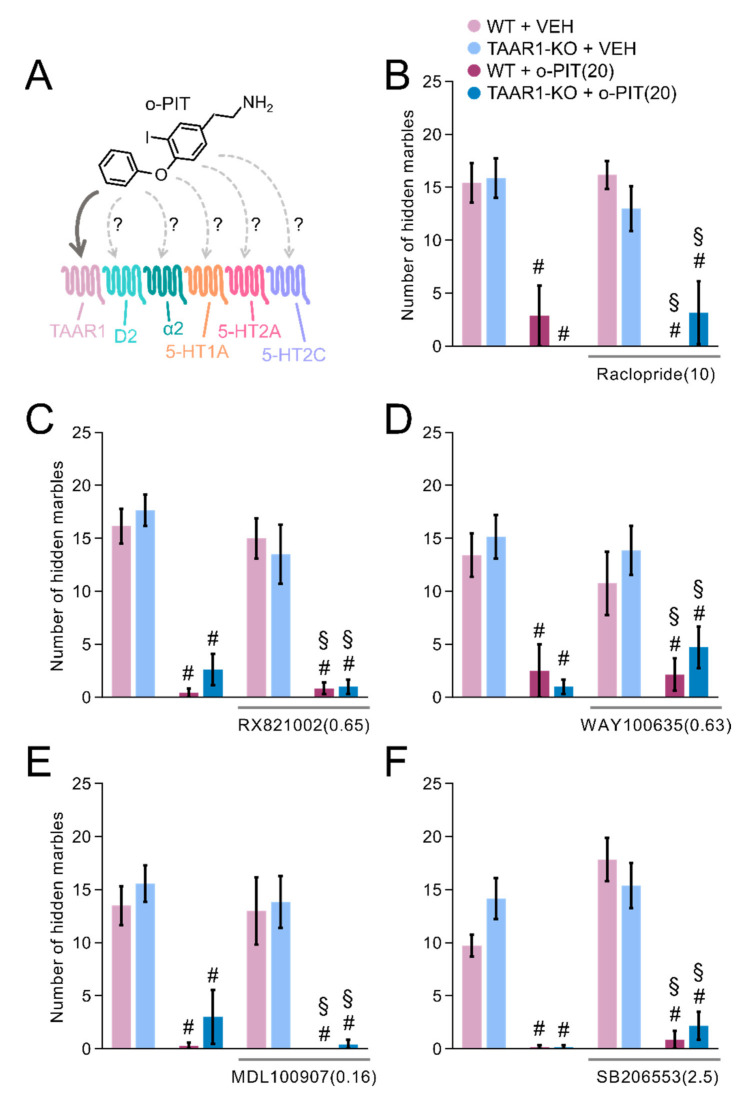
Trace Amine-Associated Receptor 1 (TAAR1) is a potential target for the treatment of depression and other CNS disorders. However, the precise functional roles of TAAR1 to the actions of clinically used antidepressants remains unclear. Herein, we addressed these issues employing the TAAR1 agonist, o-phenyl-iodotyramine (o-PIT), together with TAAR1-knockout (KO) mice. Irrespective of genotype, systemic administration of o-PIT led to a similar increase in mouse brain concentrations. Consistent with the observation of a high density of TAAR1 in the medial preoptic area, o-PIT-induced hypothermia was significantly reduced in TAAR1-KO mice. Furthermore, the inhibition of a prepulse inhibition response by o-PIT, as well as its induction of striatal tyrosine hydroxylase phosphorylation and elevation of extracellular DA in prefrontal cortex, were all reduced in TAAR1-KO compared to wildtype mice. O-PIT was active in both forced-swim and marble-burying tests, and its effects were significantly blunted in TAAR1-KO mice. Conversely, the actions on behaviour and prefrontal cortex dialysis of a broad suite of clinically used antidepressants were unaffected in TAAR1-KO mice. In conclusion, o-PIT is a useful tool for exploring the hypothermic and other functional antidepressant roles of TAAR1. By contrast, clinically used antidepressants do not require TAAR1 for expression of their antidepressant properties.

Keywords: DA; TAAR1; antidepressants; o-PIT.


Conflict of interest statement

The authors declare no conflict of interest. M.J.M., B.D.C., S.V., L.C., M.B. (Mauricette Brocco) and M.B. (Marc Bertrand) were employees at Institut de Recherches SERVIER during the time of the studies.

Figures

Figure 1
Figure 1
O-PIT brain and plasma pharmacokinetics in TAAR1-KO mice and TAAR1 distribution in the brain. (A) Chemical structure of o-PIT and schematic representation of the TAAR1-KO mouse genetic construct. (BC) Levels of o-PIT were quantified in brain (B) and plasma (C) 60 min after administration. Levels are expressed as absolute values per weight of brain sample (µg/mg) and volume of plasma (ng/mL). All data are means ± SEM. N = 4–5 per group. p < 0.05, influence of treatment (#) or genotype (*). VEH: vehicle. (D) Neuroanatomical distribution of TAAR1 expressing cells using β-galactosidase detection in TAAR1-KO mice sections and that the staining represents expression under the endogenous TAAR1 promoter (N = 3). MPO: medial preoptic nucleus (scale bar: 100 μm), BSTM: medial bed nucleus of stria terminalis (scale bar: 100 μm), ZI/LHA: zona incerta/lateral hypothalamic area (scale bar: 100 μm), BM/Me: basomedial/medial amygdaloid nucleus (scale bar: 250 μm), VTA/SNC: ventral tegmental area/compact part of substantia nigra (scale bar: 250 μm), LEnt: lateral entorhinal cortex (scale bar: 250 μm), PAG/DpG/DpWh: periaqueductal grey/deep grey layer of superior colliculus/deep white layer of superior colliculus (scale bar: 250 μm), LPBD: dorsal part of lateral parabrachial nucleus (scale bar: 100 μm), 3V: 3rd ventricle, sm: stria medullaris, f: fornix, mfb: medial forebrain bundle, cp: cerebral peduncle, ec: external capsule, scp: superior cerebellar peduncle, ml: medial lemniscus, Aq: aqueduct.
Figure 2
Figure 2
Drug interaction with o-PIT upon core temperature in TAAR1-KO and WT mice. (A) Schematic depiction of hypothermic effects of o-PIT. (B) Core temperature is expressed as area under the curve (AUC) calculated over the 120 min following administration of o-PIT (2.5–40 mg/kg). (C) Antagonists (mg/kg, s.c.) were administered 30 min prior to o-PIT (20 mg/kg). Core temperature was determined 60 min following o-PIT. (C) Dose-dependent (0.01–0.63 mg/kg) effect of RX821, 002 upon the effect of o-PIT. All data are means ± SEM. N = 6–8 per group. p < 0.05, influence of treatment (#) or genotype (*). VEH: vehicle.
Figure 3
Figure 3
Influence of o-PIT on prepulse inhibition in TAAR1-KO and WT mice. (A) Schematic depiction of prepulse inhibition experiment. (B,C) Show that the enhancement by o-PIT of prepulse inhibition (B) is specific in that it does not affect the startle reflex, per se, neither in WT nor in TAAR1-KO mice (C). Data represent means ± SEM. N = 8–12 per group. p < 0.05, influence of treatment (#) or genotype (*). VEH: vehicle.
Figure 4
Figure 4
Influence of o-PIT on Tyrosine Hydroxylase (TH) phosphorylation in CPu of TAAR1-KO and WT mice. (A) Schematic depiction of experimental procedure. (B) Immunoblots of P-Ser19-TH, P-Ser31-TH, P-Ser40-TH and total-TH were quantified following increasing concentrations of o-PIT (1–100 µM). (CE) Bar graphs showing the immunoblot quantification of P-Ser19-TH (C), P-Ser31-TH (D), P-Ser40-TH (E). CPu TH activity was measured following the perfusion of 10 µM o-PIT. Data are expressed as percentage of vehicle (100%). All data are means ± SEM. N = 4–5 per group. p < 0.05, influence of treatment (#) or genotype (*). VEH: vehicle.
Figure 5
Figure 5
Effect of o-PIT (10 mg/kg) on extracellular levels of DA, 5-HT and NA in the mPFC of TAAR1-KO and WT mice. (A) Schematic depiction of experimental procedure. (B) The vertical dotted line indicates the time at which o-PIT (10 mg/kg) was administered. DA levels are expressed as a percentage of baseline (100%). (CE) Histograms show values of area under the curve (AUC [0..180], arbitrary units) for the dose–response of o-PIT upon DA (C) and for the effect of 10 mg/kg o-PIT on NA (D) and 5-HT (E). All data are means ± SEM. N = 6–8 per group. p < 0.05, influence of treatment (#) or genotype (*). VEH: vehicle.
Figure 6
Figure 6
Effects of different antidepressants (10 mg/kg) on extracellular levels of DA, 5-HT and NA in the mPFC of TAAR1-KO and WT mice. (A) Schematic depiction of experimental procedure. (BD) Histograms show values of areas under the curve (AUC [0 ..180], arbitrary units) for the response of venlafaxine (Ven), citalopram (Cit), bupropion (Bup), selegiline (Sel) and reboxetine (Reb) upon DA (A), NA (B) and 5-HT (C). All data are means ± SEM. N = 6–8 per group. p < 0.05, vehicle + antidepressant (#). VEH: vehicle.
Figure 7
Figure 7
Influence of o-PIT on forced-swim test in TAAR1-KO and WT mice. (A) Schematic depiction of forced-swim test. (BJ) Values correspond to the duration of immobility during 4 min test after acute o-PIT treatment (2.5–40 mg/kg) (B), duloxetine (0.63–10 mg/kg) (C), venlafaxine (2.5–40 mg/kg) (D), maprotiline (0.63–40 mg/kg) (E), fluoxetine (10–80 mg/kg) (F), bupropion (2.5–40 mg/kg) (G), radafaxine (2.5–40 mg/kg) (H), selegiline (2.5–40 mg/kg) (I) and reboxetine (0.04–40 mg/kg) (J). Data represent means ± SEM. N = 8–12 per group. p < 0.05, influence of treatment (#) or genotype (*). VEH: vehicle.
Figure 8
Figure 8
Influence of o-PIT on marble-burying in TAAR1-KO and WT mice. (A) Schematic depiction of marble-burying test. (BL) Values correspond to the number of hidden marbles over 30 min after acute o-PIT treatment (2.5–40 mg/kg) (B), clomipramine (2.5–20 mg/kg) (C), amitriptyline (0.63–5 mg/kg) (D), duloxetine (0.63–5 mg/kg) (E), venlafaxine (2.5–20 mg/kg) (F), fluoxetine (2.5–10 mg/kg) (G), citalopram (0.63–10 mg7 kg) (H), bupropion (2.5–40 mg/kg) (I), radafaxine (2.5–40 mg/kg) (J), selegiline (0.63–5 mg/kg) (K) and reboxetine (0.63–40 mg/kg) (L). Data represent means ± SEM. N = 8–12 per group. p < 0.05, influence of treatment (#) or genotype (*). VEH: vehicle.
Figure 9
Figure 9
Influence of different monoaminergic receptors’ antagonists on o-PIT’s anticompulsive effects in TAAR1-KO and WT mice. (A) Schematic depiction of the possible monoaminergic receptors that may bind o-PIT. (BF) Values correspond to the number of hidden marbles over 30 min after pretreatment of raclopride (10 mg/kg) (B), RX821002 (0.65 mg/kg) (C), WAY100635 (0.63 mg/kg) (D), MDL100907 (0.16 mg/kg) (E) or SB206553 (2.5 mg/kg) (F) and acute o-PIT treatment (20 mg/kg). Data represent means ± SEM. N = 8–12 per group. p < 0.05, vehicle + vehicle vs. vehicle/antagonist + o-PIT (#), antagonist + vehicle vs. antagonist + o-PIT (§). VEH: vehicle.

References

    1. Gainetdinov R.R., Hoener M.C., Berry M.D. Trace amines and their receptors. Pharmacol. Rev. 2018;70:549–620. doi: 10.1124/pr.117.015305. - DOI - PubMed
    1. Pretorius L., Smith C. The trace aminergic system: A gender-sensitive therapeutic target for IBS? J. Biomed. Sci. 2020;27:95. doi: 10.1186/s12929-020-00688-1. - DOI - PMC - PubMed
    1. Zucchi R., Chiellini G., Scanlan T.S., Grandy D.K. Trace amine-associated receptors and their ligands. Br. J. Pharmacol. 2006;149:967–978. doi: 10.1038/sj.bjp.0706948. - DOI - PMC - PubMed
    1. Accorroni A., Rutigliano G., Sabatini M., Frascarelli S., Borsò M., Novelli E., Bandini L., Ghelardoni S., Saba A., Zucchi R., et al. Exogenous 3-iodothyronamine rescues the entorhinal cortex from β-amyloid toxicity. Thyroid. 2020;30:147–160. doi: 10.1089/thy.2019.0255. - DOI - PubMed
    1. Rutigliano G., Zucchi R. Molecular variants in human trace amine-associated receptors and their implications in mental and metabolic disorders. Cell. Mol. Neurobiol. 2020;40:239–255. doi: 10.1007/s10571-019-00743-y. - DOI - PMC - PubMed