

Increased complement activation is a distinctive feature of severe SARS-CoV-2 infection
- PMID: 34446527
- PMCID: PMC8158979
- DOI: 10.1126/sciimmunol.abh2259
Increased complement activation is a distinctive feature of severe SARS-CoV-2 infection
Abstract
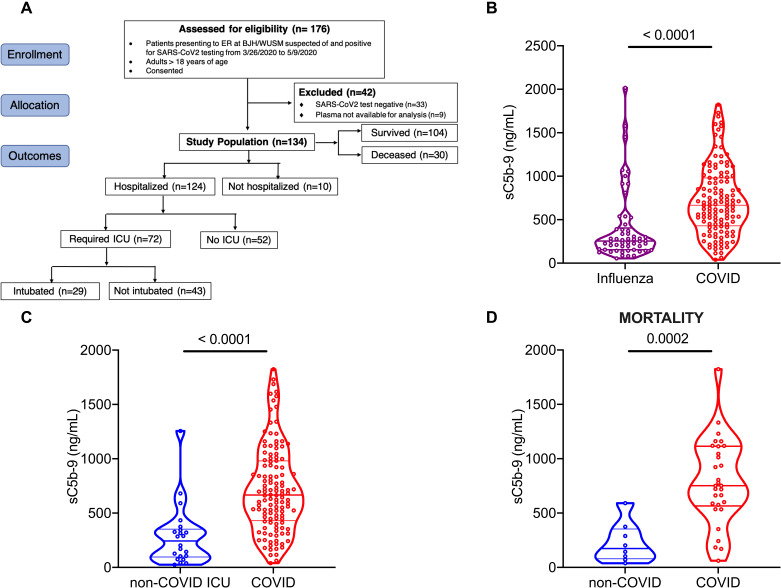
Complement activation has been implicated in the pathogenesis of severe SARS-CoV-2 infection. However, it remains to be determined whether increased complement activation is a broad indicator of critical illness (and thus, no different in COVID-19). It is also unclear which pathways are contributing to complement activation in COVID-19, and if complement activation is associated with certain features of severe SARS-CoV-2 infection, such as endothelial injury and hypercoagulability. To address these questions, we investigated complement activation in the plasma from patients with COVID-19 prospectively enrolled at two tertiary care centers: Washington University School of Medicine (n=134) and Yale School of Medicine (n=49). We compared our patients to two non-COVID cohorts: (a) patients hospitalized with influenza (n=54), and (b) patients admitted to the intensive care unit (ICU) with acute respiratory failure requiring invasive mechanical ventilation (IMV, n=22). We demonstrate that circulating markers of complement activation are elevated in patients with COVID-19 compared to those with influenza and to patients with non-COVID-19 respiratory failure. Further, the results facilitate distinguishing those who are at higher risk of worse outcomes such as requiring ICU admission, or IMV. Moreover, the results indicate enhanced activation of the alternative complement pathway is most prevalent in patients with severe COVID-19 and is associated with markers of endothelial injury (i.e., angiopoietin-2) as well as hypercoagulability (i.e., thrombomodulin and von Willebrand factor). Our findings identify complement activation to be a distinctive feature of COVID-19, and provide specific targets that may be utilized for risk prognostication, drug discovery and personalized clinical trials.
Copyright © 2021, American Association for the Advancement of Science.
Figures


Update of
-
Increased complement activation is a distinctive feature of severe SARS-CoV-2 infection.bioRxiv [Preprint]. 2021 Feb 23:2021.02.22.432177. doi: 10.1101/2021.02.22.432177. bioRxiv. 2021. Update in: Sci Immunol. 2021 May 13;6(59):eabh2259. doi: 10.1126/sciimmunol.abh2259. PMID: 33655244 Free PMC article. Updated. Preprint.
References
-
- Vabret N., Britton G. J., Gruber C., Hegde S., Kim J., Kuksin M., Levantovsky R., Malle L., Moreira A., Park M. D., Pia L., Risson E., Saffern M., Salomé B., Esai Selvan M., Spindler M. P., Tan J., van der Heide V., Gregory J. K., Alexandropoulos K., Bhardwaj N., Brown B. D., Greenbaum B., Gümüş Z. H., Homann D., Horowitz A., Kamphorst A. O., Curotto de Lafaille M. A., Mehandru S., Merad M., Samstein R. M.; Sinai Immunology Review Project , Immunology of COVID-19: Current State of the Science. Immunity 52, 910–941 (2020). 10.1016/j.immuni.2020.05.002 - DOI - PMC - PubMed
-
- Wu M., Chen Y., Xia H., Wang C., Tan C. Y., Cai X., Liu Y., Ji F., Xiong P., Liu R., Guan Y., Duan Y., Kuang D., Xu S., Cai H., Xia Q., Yang D., Wang M.-W., Chiu I. M., Cheng C., Ahern P. P., Liu L., Wang G., Surana N. K., Xia T., Kasper D. L., Transcriptional and proteomic insights into the host response in fatal COVID-19 cases. Proc. Natl. Acad. Sci. U.S.A. 117, 28336–28343 (2020). 10.1073/pnas.2018030117 - DOI - PMC - PubMed
-
- Blanco-Melo D., Nilsson-Payant B. E., Liu W.-C., Uhl S., Hoagland D., Møller R., Jordan T. X., Oishi K., Panis M., Sachs D., Wang T. T., Schwartz R. E., Lim J. K., Albrecht R. A., tenOever B. R., Imbalanced Host Response to SARS-CoV-2 Drives Development of COVID-19. Cell 181, 1036–1045.e9 (2020). 10.1016/j.cell.2020.04.026 - DOI - PMC - PubMed
Publication types
MeSH terms
Substances
Grants and funding
- UL1 TR001863/TR/NCATS NIH HHS/United States
- R21 AR069833/AR/NIAMS NIH HHS/United States
- K08 HL148510/HL/NHLBI NIH HHS/United States
- P30 CA091842/CA/NCI NIH HHS/United States
- P01 AI116501/AI/NIAID NIH HHS/United States
- AHA/American Heart Association-American Stroke Association/United States
- R35 GM136352/GM/NIGMS NIH HHS/United States
- R01 EYE028602/NH/NIH HHS/United States
- P30 AR073752/AR/NIAMS NIH HHS/United States
- R01 HL142818/HL/NHLBI NIH HHS/United States
- T32 HL007317/HL/NHLBI NIH HHS/United States
- R01 HL094601/HL/NHLBI NIH HHS/United States
- UL1 TR000448/TR/NCATS NIH HHS/United States
- UL1 TR002345/TR/NCATS NIH HHS/United States
- R01 HL126094/HL/NHLBI NIH HHS/United States
LinkOut - more resources
Full Text Sources
Other Literature Sources
Medical
Miscellaneous
