. 2021 Aug 27;373(6558):1040-1046.
doi: 10.1126/science.abc9113.

Enterococcus peptidoglycan remodeling promotes checkpoint inhibitor cancer immunotherapy

Affiliations

Enterococcus peptidoglycan remodeling promotes checkpoint inhibitor cancer immunotherapy

Matthew E Griffin et al. Science. .

Abstract

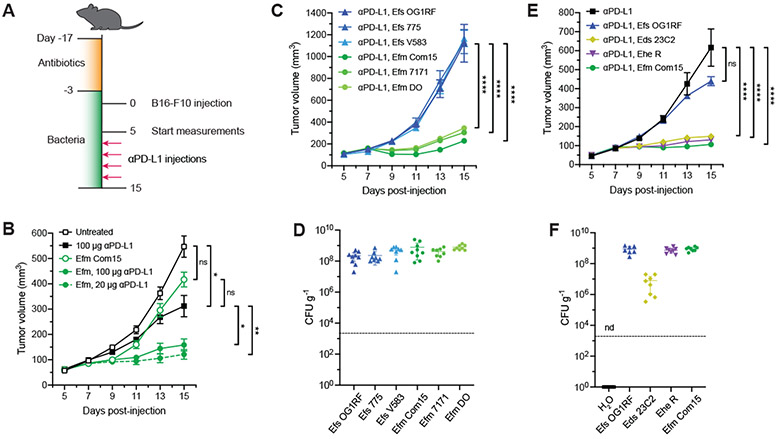
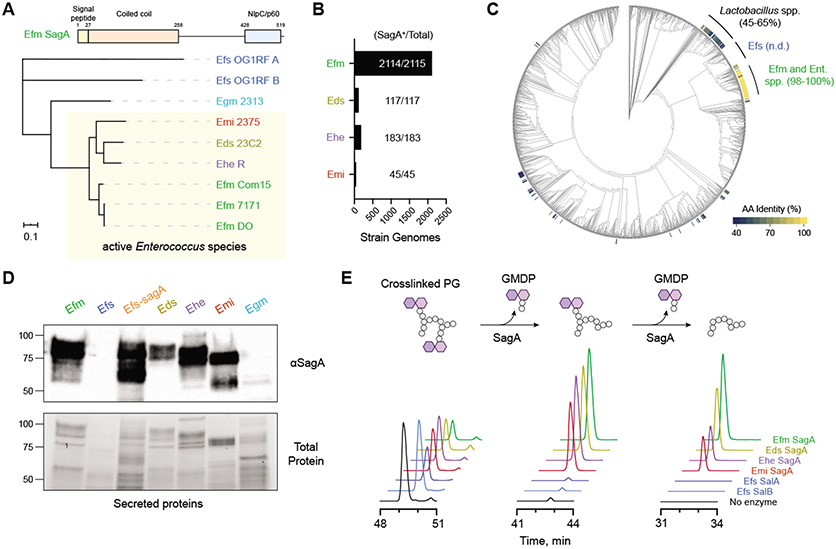
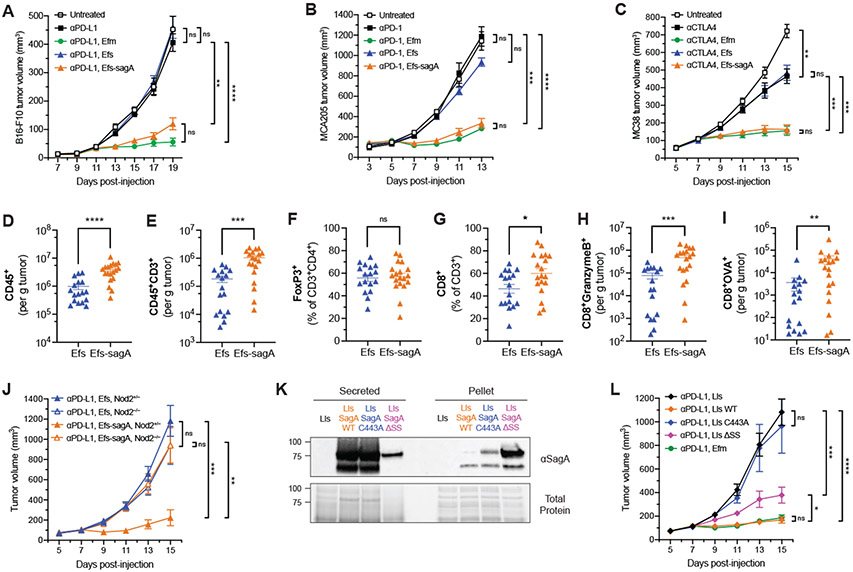
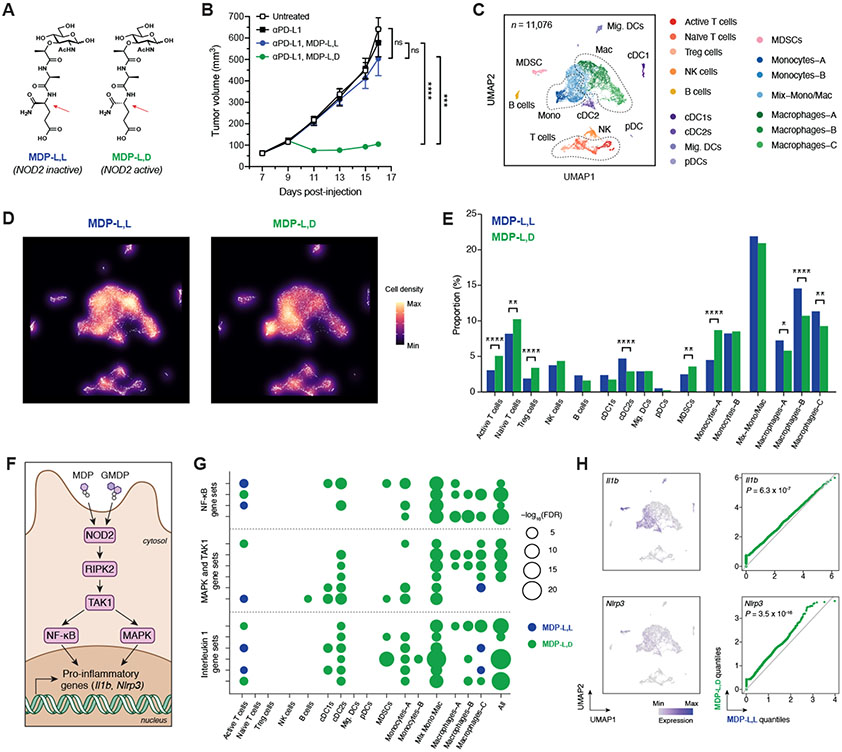
The antitumor efficacy of cancer immunotherapy can correlate with the presence of certain bacterial species within the gut microbiome. However, many of the molecular mechanisms that influence host response to immunotherapy remain elusive. In this study, we show that members of the bacterial genus Enterococcus improve checkpoint inhibitor immunotherapy in mouse tumor models. Active enterococci express and secrete orthologs of the NlpC/p60 peptidoglycan hydrolase SagA that generate immune-active muropeptides. Expression of SagA in nonprotective E. faecalis was sufficient to promote immunotherapy response, and its activity required the peptidoglycan sensor NOD2. Notably, SagA-engineered probiotics or synthetic muropeptides also augmented anti-PD-L1 antitumor efficacy. Taken together, our data suggest that microbiota species with specialized peptidoglycan remodeling activity and muropeptide-based therapeutics may enhance cancer immunotherapy and could be leveraged as next-generation adjuvants.


Figures

Fig. 1.
Fig. 1.. Specific enterococci improve efficacy of anti–PD-L1 immunotherapy in B16-F10 melanoma model.
(A) Schematic of tumor growth model in SPF mice with antibiotic treatment and oral enterococci supplementation. Days are indexed based on the day of tumor injection. Mice were provided antibiotic-containing water ab libitum for two weeks followed by water supplemented with the indicated enterococci for the remainder of the experiment. Animals were then subcutaneously implanted with B16-F10 melanoma cells, and tumor volume measurements started when tumors reached ~50-100 mm3 (day 5). Mice were treated with anti–PD-L1 by intraperitoneal injection every other day starting two days after the start of the tumor measurement. For all data except for (B), 20 μg anti–PD-L1 was used for each injection. (B) B16-F10 tumor growth in antibiotic-treated animals that were supplemented with or without E. faecium (Efm) Com15 and treated with or without anti–PD-L1 starting on day 7 at doses indicated in the legend. n = 7-8 mice per group. (C) B16-F10 tumor growth in antibiotic-treated mice that were supplemented with the indicated E. faecalis (Efs) and E. faecium (Efm) strains and treated with anti–PD-L1 starting on day 7. n = 7-8 mice per group. (D) Colony forming unit (CFU) analysis of E. faecalis (Efs) and E. faecium (Efm) strains in fecal samples harvested from animals as treated in (C). (E) B16-F10 tumor growth in antibiotic-treated mice that were supplemented with the indicated enterococci strains and treated with anti–PD-L1 starting in day 7. n = 8-9 mice per group. (F) CFU analysis of enterococci in fecal samples harvested from animals as treated in (E). nd = not detected. For (B), (C), and (E), data represent mean ± s.e.m. and were analyzed by mixed-effects model with Tukey’s multiple comparisons post-hoc test. *P < 0.05, **P < 0.01, ****P < 0.0001, ns = not significant. For (D) and (F), each symbol represents one mouse. Dotted lines indicate the limit of detection (2,000 CFU g−1). Data represent means ± 95% confidence interval.
Fig. 2.
Fig. 2.. Protective enterococci express and secrete active orthologs of the peptidoglycan NlpC/p60 hydrolase SagA.
(A) Domain structure and unrooted phylogenetic clustering of putative SagA ortholog protein sequences identified by global peptidoglycan peptidase analysis of enterococci species and strains along with the closest entries from E. gallinarum (Egm) and E. faecalis (Efs) based on IQ-Tree analysis. Numbers above each domain denote amino acid residue boundaries. Active strains are indicated by the yellow box. Scale bar represents sequence distance. (B) Bar plot and quantification of Enterococcus genomes containing SagA orthologs. (C) Cladogram of Human Microbiome Project isolates organized by 16S rRNA homology with heat map indicating amino acid (AA) sequence identity of putative SagA orthologs. n.d. = not detected; Ent. spp. = Enterococcus strains without an assigned species name. (D) Western blot detection of secreted SagA orthologs harvested from overnight cultures of the indicated enterococci using antiserum raised against E. faecium (Efm) Com15 SagA. Bottom panel shows total protein loading. Numbers indicate estimated molecular weight (kDa). (E) In vitro activity of purified SagA orthologs. Data are shown as extracted LC-MS ion chromatograms of a crosslinked peptidoglycan substrate and two iterative hydrolysis products after incubating a mixture of peptidoglycan fragments with purified SagA orthologs from the indicated species for 16 hours at 37 °C. Peak heights are shown as relative intensity of ion abundance, and all chromatograms are shown on the same scale.
Fig. 3.
Fig. 3.. SagA improves checkpoint inhibitor immunotherapy and elicits an adaptive immune response.
(A) B16-F10 tumor growth in antibiotic-treated mice that were supplemented with the indicated enterococci and treated with anti–PD-L1 starting on day 9. n = 8 mice per group. (B) MCA205 tumor growth in antibiotic-treated mice that were supplemented with the indicated enterococci and treated with anti–PD-1 starting on day 5. n = 8 mice per group. (C) MC38 tumor growth in antibiotic-treated mice that were supplemented with the indicated enterococci and treated with anti–CTLA-4 starting on day 7. n = 8 mice per group. (D) to (I) Quantification of tumor infiltrating CD45+ cells (D), total CD3+ T cells (E), FoxP3+ regulatory T cells (F), CD8+ T cells (G), granzyme B+ CD8+ T cells (H), and OVA-specific CD8+ T cells (I) from B16-OVA tumors in mice supplemented with E. faecalis (Efs) or Efs-sagA harvested five days after the start of anti–PD-L1 treatment by flow cytometry. Data are pooled from two independent experiments of 7-10 mice per group per experiment; each symbol represents one mouse. (J) B16-F10 tumor growth in antibiotic-treated Nod2+/− or Nod2−/− mice that were supplemented with Efs or Efs-sagA and treated with anti–PD-L1 starting on day 7. n = 9-11 mice per group. (K) Western blot detection of ectopically expressed Efm Com15 SagA in secreted protein and cell pellet fractions harvested from overnight cultures of the indicated engineered Lactococcus lactis (Lls) strains using antiserum raised against Efm Com15 SagA. Bottom panels show total protein loading. Numbers indicate estimated molecular weight (kDa). WT = wild-type, ΔSS = signal sequence deletion. (L) B16-F10 tumor growth in antibiotic-treated mice that were supplemented with the indicated Lactococcus lactis (Lls) strains and treated with anti–PD-L1 starting on day 7. n = 9-11 mice per group. Data for (A)-(C) and (K)-(L) represent mean ± s.e.m. and analyzed by mixed-effects model with Tukey’s multiple comparisons post-hoc test. Data for (D)-(I) represent mean ± s.e.m. and analyzed by Mann-Whitney U test. *P < 0.05, **P < 0.01, ***P < 0.001, ****P < 0.0001, ns = not significant.
Fig. 4.
Fig. 4.. Peptidoglycan fragment MDP enhances checkpoint blockade efficacy and generates a pro-inflammatory tumor microenvironment.
(A) Chemical structures of the active (l,d) and inactive (l,l) diastereomers of muramyl dipeptide (MDP). Arrows indicate the single altered stereocenter. (B) B16-F10 tumor growth in antibiotic-treated, non-supplemented mice treated with anti–PD-L1 and either MDP-l,d or MDP-l,l starting on day 9. n = 7-8 mice per group. (C) Uniform manifold approximation and projection (UMAP) plots of scRNA-seq data from CD45+ tumor-infiltrating cells after treatment with anti–PD-L1 and MDP diastereomers. n = 11,076 total cells pooled from six animals per condition. (D) Density plot and (E) quantification of immune cell clusters. (F) Schematic of NOD2-dependent signaling of pro-inflammatory genes. GMDP = GlcNAc-muramyl dipeptide. (G) Bubble plot for enrichment of curated canonical pathway gene sets involving NF-κB, MAPK/TAK1, and interleukin 1 across cell clusters. (H) UMAP plots and paired quantile-quantile plots of NF-κB target genes Il1b and Nlrp3. For (B), data represent mean ± s.e.m. and were analyzed by mixed-effects model with Tukey’s multiple comparisons post-hoc test. For (E), data represent absolute cell counts and were analyzed by Pearson’s chi-squared test for count data with Holm’s correction for multiple comparisons. For (G), false discovery rates (FDR) were obtained by model-based analysis of single transcriptomics (MAST). For (H), data were analyzed with two-sided Wilcoxon rank-sum test. *P < 0.05, **P < 0.01, ***P < 0.001, ****P < 0.0001, ns = not significant.

References

    1. Sahin U, Türeci Ö, Personalized vaccines for cancer immunotherapy. Science. 359, 1355–1360 (2018). - PubMed
    1. June CH, O’Connor RS, Kawalekar OU, Ghassemi S, Milone MC, CAR T cell immunotherapy for human cancer. Science. 359, 1361–1365 (2018). - PubMed
    1. Ribas A, Wolchok JD, Cancer immunotherapy using checkpoint blockade. Science. 359, 1350–1355 (2018). - PMC - PubMed
    1. Van Allen EM, Miao D, Schilling B, Shukla SA, Blank C, Zimmer L, Sucker A, Hillen U, Foppen MHG, Goldinger SM, Utikal J, Hassel JC, Weide B, Kaehler KC, Loquai C, Mohr P, Gutzmer R, Dummer R, Gabriel S, Wu CJ, Schadendorf D, Garraway LA, Genomic correlates of response to CTLA-4 blockade in metastatic melanoma. Science. 350, 207–211 (2015). - PMC - PubMed
    1. Łuksza M, Riaz N, Makarov V, Balachandran VP, Hellmann MD, Solovyov A, Rizvi NA, Merghoub T, Levine AJ, Chan TA, Wolchok JD, Greenbaum BD, A neoantigen fitness model predicts tumour response to checkpoint blockade immunotherapy. Nature. 551, 517–520 (2017). - PMC - PubMed

Publication types

MeSH terms