. 2021 Aug 26;12(1):5138.
doi: 10.1038/s41467-021-25391-z.

Implantable optical fibers for immunotherapeutics delivery and tumor impedance measurement

Affiliations

Implantable optical fibers for immunotherapeutics delivery and tumor impedance measurement

Ai Lin Chin et al. Nat Commun. .

Abstract

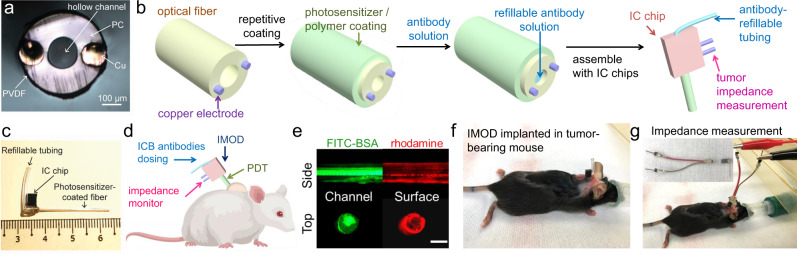
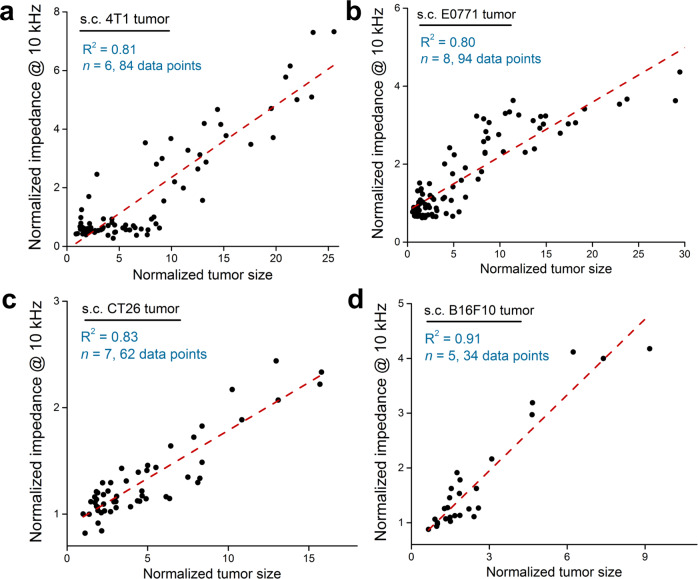
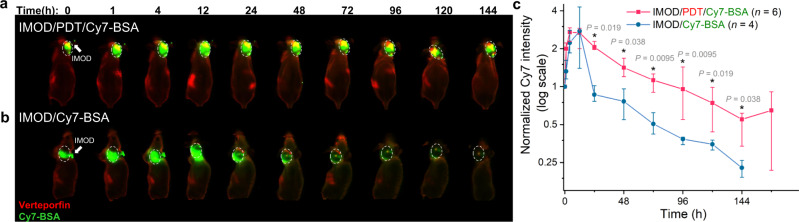
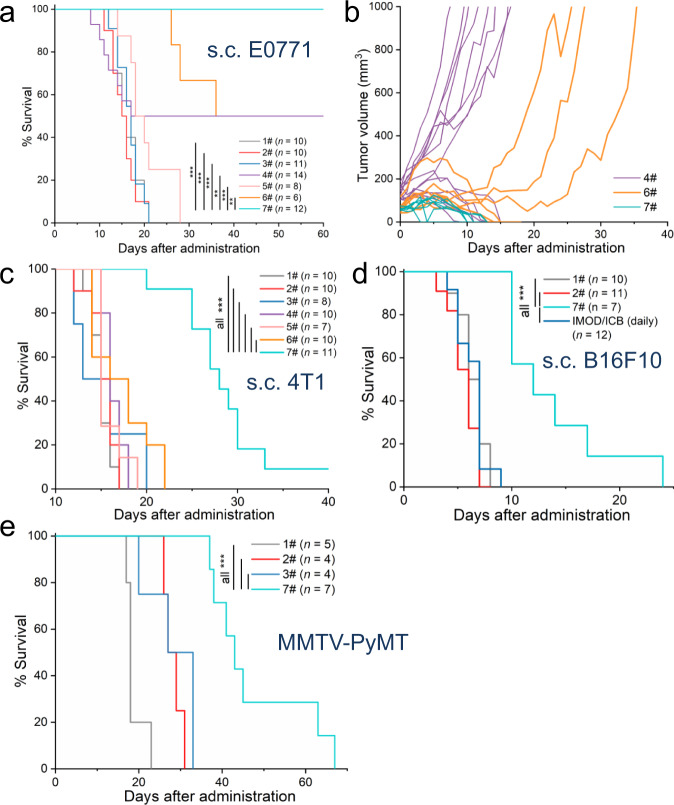
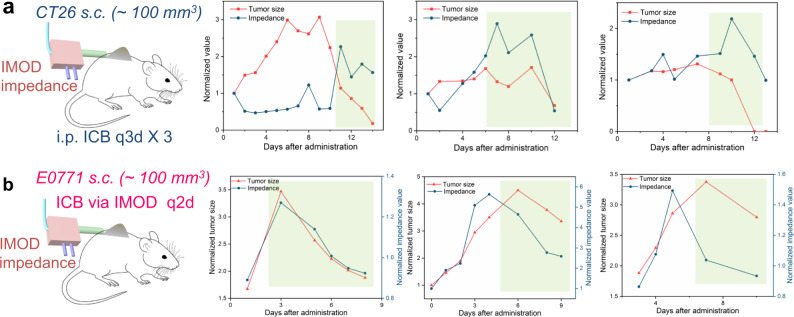
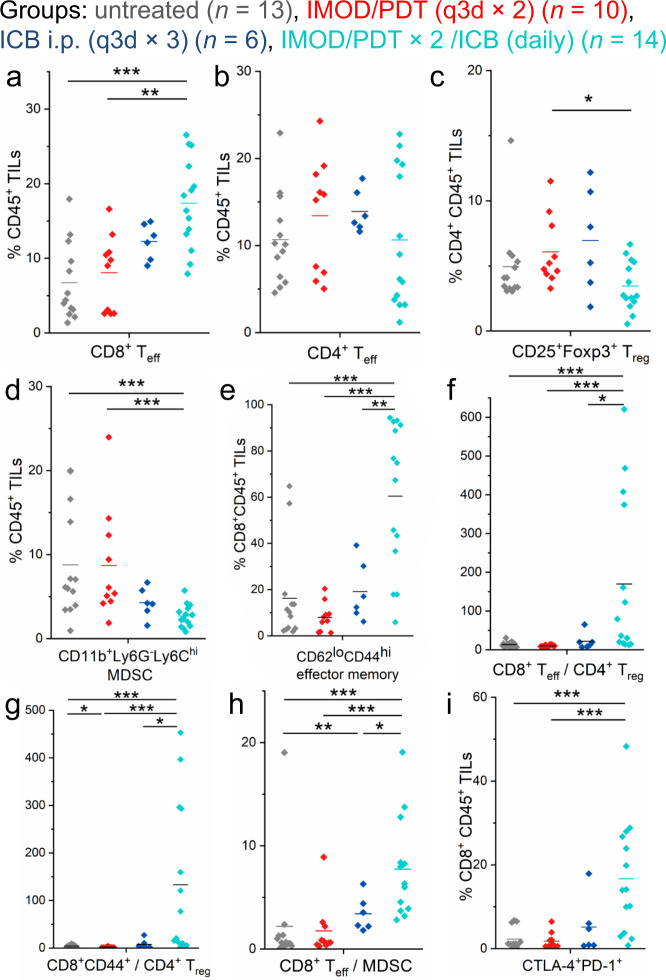
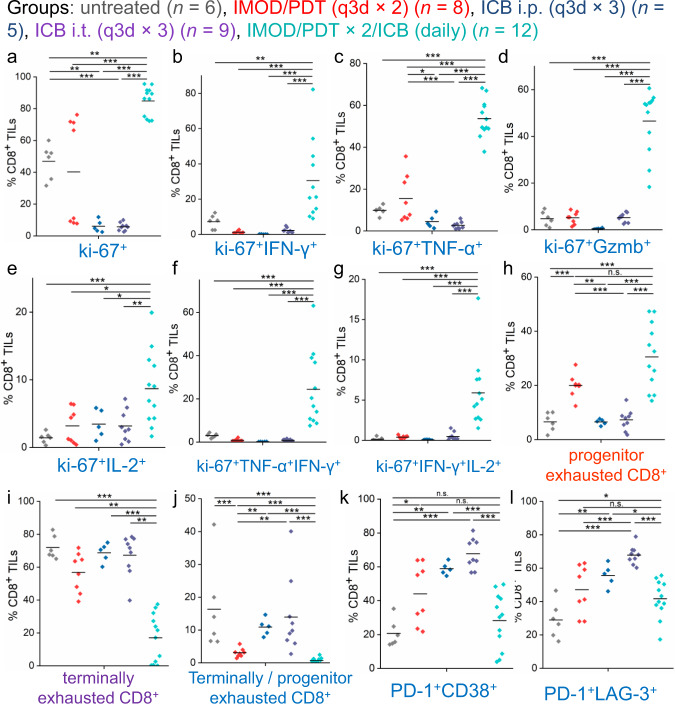
Immune checkpoint blockade antibodies have promising clinical applications but suffer from disadvantages such as severe toxicities and moderate patient-response rates. None of the current delivery strategies, including local administration aiming to avoid systemic toxicities, can sustainably supply drugs over the course of weeks; adjustment of drug dose, either to lower systemic toxicities or to augment therapeutic response, is not possible. Herein, we develop an implantable miniaturized device using electrode-embedded optical fibers with both local delivery and measurement capabilities over the course of a few weeks. The combination of local immune checkpoint blockade antibodies delivery via this device with photodynamic therapy elicits a sustained anti-tumor immunity in multiple tumor models. Our device uses tumor impedance measurement for timely presentation of treatment outcomes, and allows modifications to the delivered drugs and their concentrations, rendering this device potentially useful for on-demand delivery of potent immunotherapeutics without exacerbating toxicities.


Conflict of interest statement

A provisional patent (U.S. Patent Application No. 62/750,870) has been filed pertaining to the results presented in this paper by the authors (A.L.C., S.J., X.J., and R.T.). The authors declare no other competing interests.

Figures

Fig. 1
Fig. 1. Design and fabrication of an implantable miniaturize optical fiber device (IMOD) for on-demand drug delivery and tumor impedance measurement.
a The cross-section image of an uncoated optical fiber with embedded electrodes for measuring tumor impedance. PC, polycarbonate; PVDF, polyvinylidene difluoride. b Procedure for coating the optical fiber surface with hydrophobic molecules (e.g., verteporfin or rhodamine) and filling the inner channel of the fiber with hydrophilic drugs (e.g., immune checkpoint blockade (ICB) antibodies or fluorescein isothiocyanate–bovine serum albumin (FITC-BSA)). The obtained fiber was assembled with an integrated-circuit (IC) chip to the IMOD device. c An image of IMOD with a refilling tubing and IC chip. d IMOD combines photodynamic therapy, immune checkpoint therapy, and impedance measurement, thus allowing for monitoring of treatment efficacy and adjustment of the antibody dosage to generate a sustained anti-tumor immune response while minimizing systemic toxicities. e Fluorescence imaging of an optical fiber coated with rhodamine B (red) and loaded with FITC-BSA (green). Scale bar: 500 µm. Data are representative of three repeated experiments. f Implantation of IMOD into a subcutaneous E0771 tumor in a C57BL/6 mouse. g Connection of IMOD in (f) via an electrical connector to a Gamry potentiostat for impedance measurement.
Fig. 2
Fig. 2. In vivo tumor impedance measurements using IMOD.
The linear regression relationships (red dashed lines) between normalized tumor size and normalized impedance at 10 kHz observed for subcutaneous a 4T1, b E0771, c CT26, and d B16F10 tumors. Normalized value is calculated based on the starting value of the measurement (set as 1 for both size and impedance readings at 10 kHz).
Fig. 3
Fig. 3. Effect of photodynamic therapy (PDT) on intratumoral retention of proteins.
Representative whole-body fluorescence images of a 4T1 tumor–bearing nude mice with an implanted IMOD (white arrow) that received PDT (red, −4 h) and Cy7–bovine serum albumin (BSA) via IMOD (0 h). b 4T1 tumor–bearing nude mice that received Cy7-BSA via IMOD (0 h). In both panels, the tumors are indicated with white dashed circles. c Time course of normalized intratumoral Cy7 intensity over 1 week (n = 4–6) for the mice shown in (a) and (b). Data are medians ± quartiles. Asterisks indicate P < 0.05, determined using Mann–Whitney U-tests.
Fig. 4
Fig. 4. Effects of IMOD combining PDT and daily administration of ICB antibodies on tumor growth and survival in mice.
a, b Treatments performed in subcutaneous (s.c.) E0771 tumors in C57BL/6 mice (n = 6–14). Treatment regimens in (a), (c), (d), and (e): 1#, untreated; 2#, IMOD/PDT (q3d × 2); 3#, ICB (i.p. q3d × 4); 4#, ICB (i.t. q3d × 4); 5#, ICB (i.p. daily); 6#, IMOD/PDT (q3d × 2) + ICB (i.p. q3d × 4); 7#, IMOD/PDT × 2/ICB (daily). Abbreviation: i.p., intraperitoneal; i.t., intratumoral; q3d × 4, every three days for four times. IMOD/PDT × 2/ICB (daily): treatment with PDT (q3d × 2) and ICB antibodies (daily) via IMOD. For additional treatment groups, see Supplementary Fig. 4e. c Treatments performed in s.c. 4T1 tumors in BALB/c mice (n = 7–11). d Treatments performed in s.c. B16F10 tumors in C57BL/6 mice (n = 7–12). e Treatments performed in MMTV-PyMT transgenic female mice with spontaneous breast tumors (n = 4–7). In (a), (c), (d), and (e), statistical significance was determined using log-rank tests. * P < 0.05, ** P < 0.01, *** P < 0.001. Source data and P values in a, c, d, e are provided in the Source data file.
Fig. 5
Fig. 5. Correlation between tumor shrinkage and decreased impedance value (highlighted in light green).
a Representative results for treatment of s.c. CT26 tumor by intraperitoneally (i.p.) injections of ICB antibodies, with tumor impedance measured by an implanted IMOD. b Representative results for treatment of s.c. E0771 tumor by injection of ICB antibodies every 2 days via an implanted IMOD. Tumor impedance values were measured via IMOD before administration of treatment. Detailed results for both experiments are provided in Supplementary Fig. 8.
Fig. 6
Fig. 6. Effects of delivering a combination of PDT and ICB antibodies via IMOD on TILs in E0771 tumors.
The panels show data for E0771 tumors (n = 6–14) in C57BL/6 mice that were untreated or were treated with PDT (q3d × 2) via an implanted IMOD, or ICB antibodies (i.p. q3d × 3), or PDT (q3d × 2) and ICB antibodies (daily) via IMOD (referred to as IMOD/PDT × 2/ICB (daily)). Tumors were collected on day 9 or 10 after the start of treatment and were analyzed by flow cytometry (for mice receiving combination regimen, the collection of tumor started on day 8 while tumor sizes were ~100 mm3). a Frequencies of CD8+CD3+ effector T (Teff) cells in TILs. b Frequencies of CD4+CD3+ Teff cells in TILs. c Frequencies of CD25+Foxp3+ regulatory T (Treg) cells in CD4+ TILs. d Frequencies of CD11b+Ly6GLy6Chi myeloid-derived suppressor cells (MDSCs) in TILs. e Frequencies of CD44hiCD62Llo effector memory cells in CD8+ TILs. f Ratio of CD8+ Teff cells to CD4+CD25+Foxp3+ Treg cells. g Ratio of CD8+CD44+ T cells to CD4+CD25+Foxp3+ Treg cells. h Ratio of CD8+ Teff cells to MDSCs. i Frequencies of CTLA-4+PD-1+ cells in CD8+ TILs. Statistical significance is determined by Mann–Whitney U-tests. * P < 0.05, ** P < 0.01, *** P < 0.001. Source data and P values are provided in the Source data file.
Fig. 7
Fig. 7. Analysis of CD8+ TIL subsets that responded to combination therapy administered via IMOD in the treatment of E0771 tumors.
The panels show data for E0771 tumors (n = 5–12) in C57BL/6 mice receiving different treatments. a Frequencies of proliferative cells (ki-67+) in isolated CD8+ TILs. bg Frequencies of cytokine production in isolated CD8+ TILs after ex vivo stimulation. The graphs depict frequencies of proliferative (b) ki-67+IFN-γ+, (c) ki-67+TNF-α+, (d) ki-67+Gzmb+, (e) ki-67+IL-2+, and polyfunctional sets of (f) ki-67+TNF-α+IFN-γ+, and (g) ki-67+IFN-γ+IL-2+ cells in isolated CD8+ TILs. h, i Frequencies of progenitor (h) and terminally (i) exhausted CD8+ cells in isolated CD8+ TILs. j The ratio between terminally and progenitor exhausted CD8+ TILs. k Frequencies of PD-1+CD38+ cells in CD8+ TILs. l Frequencies of PD-1+LAG-3+ cells in CD8+ TILs. Statistical significance is determined by Mann–Whitney U-tests. *P < 0.05, **P < 0.01, ***P < 0.001. Source data and P values are provided in the Source data file.

References

    1. Sharma P, Allison JP. The future of immune checkpoint therapy. Science. 2015;348:56–61. doi: 10.1126/science.aaa8172. - DOI - PubMed
    1. Pardoll DM. The blockade of immune checkpoints in cancer immunotherapy. Nat. Rev. Cancer. 2012;12:252–264. doi: 10.1038/nrc3239. - DOI - PMC - PubMed
    1. Hodi FS, et al. Improved survival with ipilimumab in patients with metastatic melanoma. N. Engl. J. Med. 2010;363:711–723. doi: 10.1056/NEJMoa1003466. - DOI - PMC - PubMed
    1. Topalian SL, et al. Safety, activity, and immune correlates of anti-PD-1 antibody in cancer. N. Engl. J. Med. 2012;366:2443–2454. doi: 10.1056/NEJMoa1200690. - DOI - PMC - PubMed
    1. Larkin J, et al. Combined nivolumab and ipilimumab or monotherapy in previously untreated melanoma. N. Engl. J. Med. 2015;373:23–34. doi: 10.1056/NEJMoa1504030. - DOI - PMC - PubMed

Publication types