. 2021 Aug 26;12(1):5126.
doi: 10.1038/s41467-021-25186-2.

Amnion signals are essential for mesoderm formation in primates

Affiliations

Amnion signals are essential for mesoderm formation in primates

Ran Yang et al. Nat Commun. .

Abstract

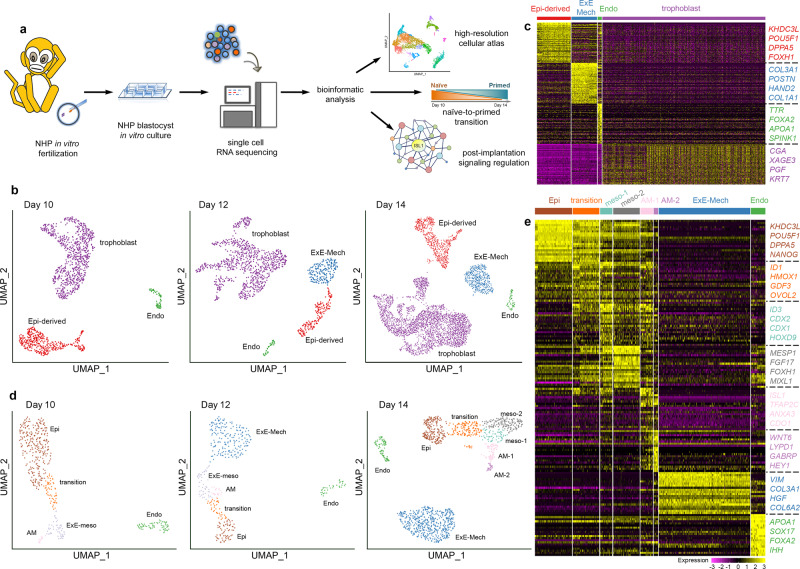
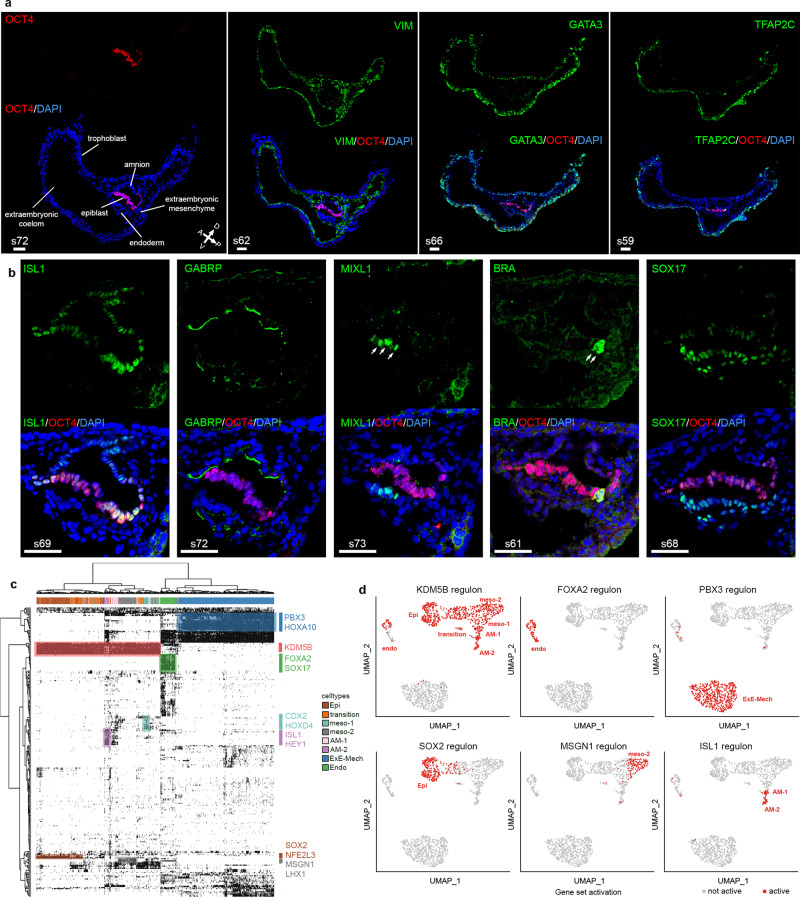
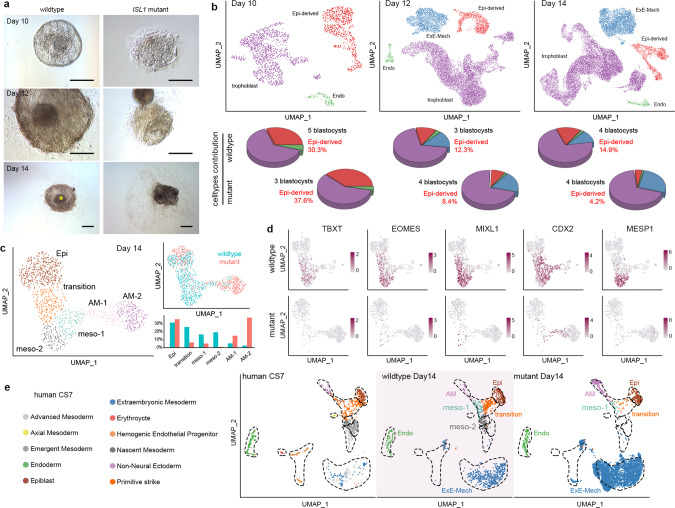
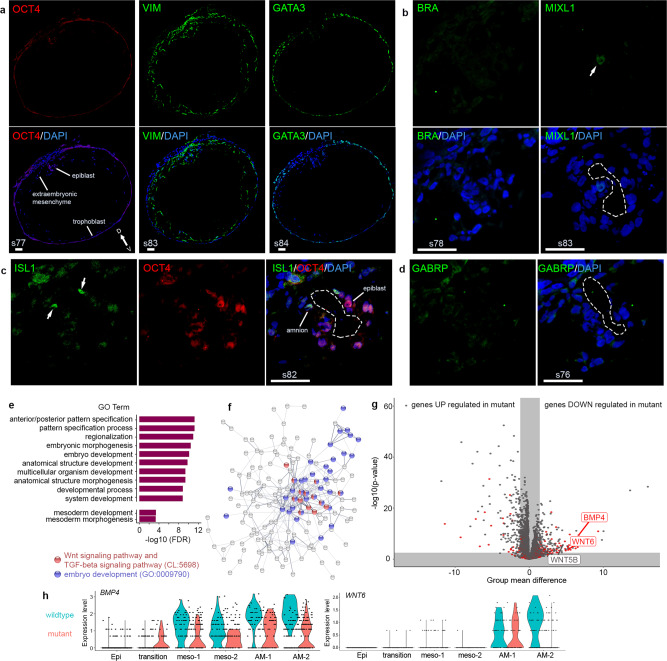
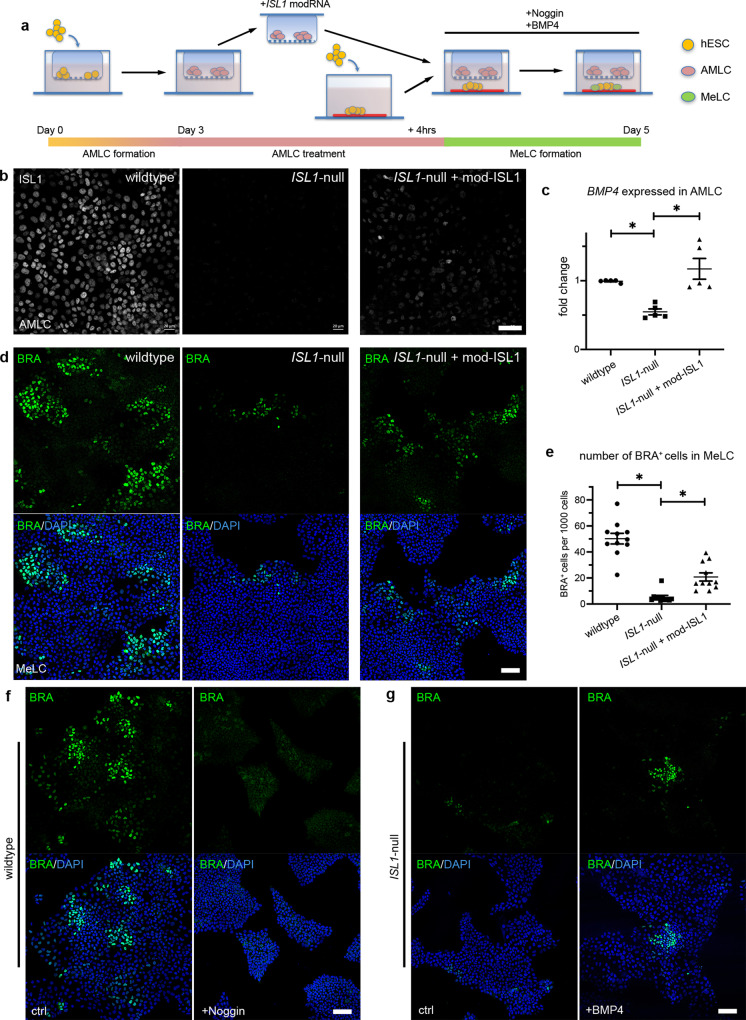
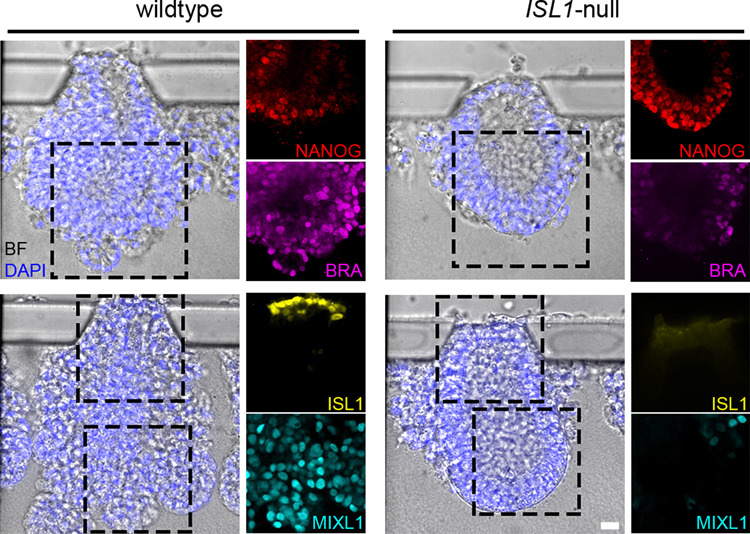
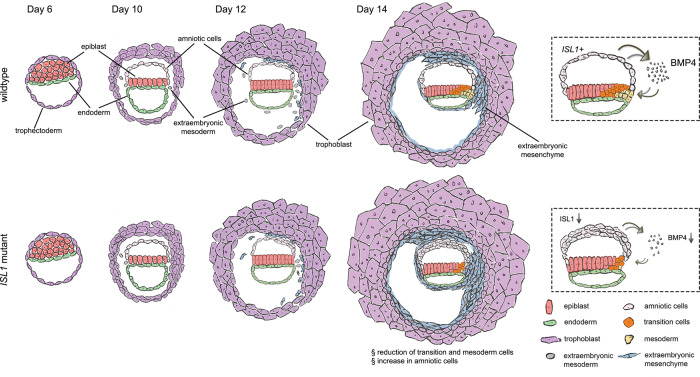
Embryonic development is largely conserved among mammals. However, certain genes show divergent functions. By generating a transcriptional atlas containing >30,000 cells from post-implantation non-human primate embryos, we uncover that ISL1, a gene with a well-established role in cardiogenesis, controls a gene regulatory network in primate amnion. CRISPR/Cas9-targeting of ISL1 results in non-human primate embryos which do not yield viable offspring, demonstrating that ISL1 is critically required in primate embryogenesis. On a cellular level, mutant ISL1 embryos display a failure in mesoderm formation due to reduced BMP4 signaling from the amnion. Via loss of function and rescue studies in human embryonic stem cells we confirm a similar role of ISL1 in human in vitro derived amnion. This study highlights the importance of the amnion as a signaling center during primate mesoderm formation and demonstrates the potential of in vitro primate model systems to dissect the genetics of early human embryonic development.


Conflict of interest statement

The authors declare no competing interest.

Figures

Fig. 1
Fig. 1. High-resolution transcriptomic map of peri-gastrulation events in wild-type in vitro cultured NHP embryos.
See also Supplementary Figs. 1–5 and Supplementary Data 1–3. a Scheme of the workflow. b UMAP plot of all cells from the in vitro cultured embryos at the different time points (Days 10, 12, and 14) colored by cell type. c Heatmap showing the scaled expression at Days 14 of 100 differentially expressed genes (DEGs) for each cell type identified in (b) selected by false discovery rate. d UMAP plot of cells from the in vitro cultured embryos at the different time points (Days 10, 12, and 14) mapping to the Epi and its derivatives, Endo and ExE-Mech colored by cell type. e Heatmap showing the scaled expression at Days 14 of 20 DEGs for each cell type identified in (d) selected by false discovery rate. Epi-derived epiblast and epiblast-derived cells, ExE-Mech extraembryonic mesenchyme, Endo endoderm, Epi epiblast, ExE-meso extraembryonic mesoderm, AM amnion, AM-1 amnion 1, AM-2 amnion 2, meso-1 mesoderm 1, meso-2 mesoderm 2.
Fig. 2
Fig. 2. Immunofluorescent staining and gene regulatory networks in wild-type in vitro cultured NHP embryos.
See also Supplementary Fig. 6 and Supplementary Data 4. a, b immunofluorescent staining of major cell types at Day 14 identified in the scRNA sequencing. n = 2 wild-type embryos a OCT4, VIM, GATA3, TFAP2C; b ISL1, GABRP, MIXL1, BRA, and SOX17. Scale bar = 50 µm. White numbers indicate section numbers and arrows indicate the signal of interest. c Binary activity matrix of regulons identified at Day 14 by gene regulatory network inference active in at least 1% of the cells clustered unsupervised. Selected master regulators are depicted in the color corresponding to the cell type they show activity in. d Binarized gene set activity of the selected regulons at Day 14 in the different cell types depicted on the UMAP plot from Fig. 1d. Epi epiblast, Endo endoderm, ExE-Mech extraembryonic mesenchyme, AM-1 amnion 1, AM-2 amnion 2, meso-1 mesoderm 1, meso-2 mesoderm 2, D dorsal, V ventral, A anterior, P posterior.
Fig. 3
Fig. 3. ISL1 mutants fail to form mesoderm.
See also Supplementary Fig. 7. a The morphology of wild-type (left) and ISL1 mutant (right) NHP embryos at Days 10, 12, and 14. Scale bar, 200 µm. Asterisk indicates the embryonic disk. n = 15 wild-type and 14 mutant embryos. b UMAP plot of all cells from the integrated dataset of wild-type and mutant embryos at the different time points (Days 10, 12, and 14) colored by cell type. Pie charts indicate the relative contribution of cell types. c UMAP plot of cells mapping to the epiblast and its derivatives at Day 14 and the relative contribution of cells to the various cell types in wild-type (blue) and mutant (red) embryos. n = 4 wild-type and 4 mutant embryos collected in two batches. d Expression of mesodermal marker genes in cells from the epiblast and its derivatives of Day 14 wild-type (top) and mutant (bottom) embryos. e UMAP plot of the integrated dataset of all cells excluding trophoblast from the in vitro cultured embryos at Day 14 with cells from a human Carnegie stage 7 (CS7) in vivo embryo colored by cell types. Epi-derived epiblast and epiblast-derived cells, Epi epiblast, Endo endoderm, ExE-Mech extraembryonic mesenchyme, AM-1 amnion 1, AM-2 amnion 2, meso-1 mesoderm 1, meso-2 mesoderm 2, wt wild type, mt mutant.
Fig. 4
Fig. 4. Loss of ISL1 impairs amnion signals essential for mesoderm formation.
See also Supplementary Fig. 8 and Supplementary Data 5. ad Immunofluorescent staining of major cell types on sections of ISL1 mutant embryos at Day 14. n = 3 mutant embryos. a OCT4, VIM, and GATA3; b BRA and MIXL1; c ISL1; d GABRP. Scale bar 50 µm. Numbers represent section numbers. Arrows indicate signals of interest and dashed lines mark the amniotic cavity. e GO categories enriched among genes significantly downregulated in cells of the mesodermal clusters in mutant embryos ordered by false discovery rate (FDR). n = 4 wild-type and 4 mutant embryos collected in two batches. f STRING network of all significantly downregulated genes in cells of the mesodermal clusters in the mutant embryos. Nodes not connected to the main network have been removed. Nodes belonging to the GO category embryonic development colored in blue; nodes belonging to the STRING network cluster Wnt signaling pathway, and TGF-beta signaling pathway colored in red. g Volcano plot showing the DEGs between amnion (AM-1 and AM-2) of the wild-type and mutant embryos. Gray areas indicate the expected group mean difference in random cell subsets (99.9th percentile) and a false discovery rate cutoff of 1%. Red labeling indicates that the gene is part of the ISL1 regulon identified by SCENIC. P values were calculated using a two-tailed Welch’s t test. The x-axis reports uncorrected p values. h Violin plot of the expression levels of BMP4 and WNT6 in the different cell types identified in (Fig. 1d) at Day 14 separated between wild-type (blue) and mutant (red) embryos. Epi epiblast, AM-1 amnion 1, AM-2 amnion 2, meso-1 mesoderm 1, meso-2 mesoderm 2, wt wild type, mt mutant, D dorsal, V ventral.
Fig. 5
Fig. 5. ISL1 in amnion-like cells regulates human mesodermal cell formation through BMP4.
See also Supplementary Fig. 9-12. a Diagram of the transwell assay. b immunofluorescent staining for ISL1 in AMLCs. Scale bar 50 µm. n = 4 biologically independent experiments c expression of BMP4 in AMLCs. Data are presented as mean ± SEM and analyzed by two-tailed Student’s t test. n = 6 biologically independent samples. *p value <0.05 (<0.0001 for wild type versus ISL1-null and 0.0002 for ISL1-null versus ISL1-null + mod-ISL1). d immunofluorescent staining for the mesoderm marker brachyury (BRA, green) in MeLCs. Nuclei stained with DAPI (blue). Scale bar 100 µm. e Quantification of BRA+ cells from (d). Data are presented as mean ± SEM and analyzed by two-tailed Student’s t test. n = 11 biologically independent samples. *p value <0.05 (<0.0001 for wild type versus ISL1-null and 0.0002 for ISL1-null versus ISL1-null + mod-ISL1). f immunofluorescent staining for BRA in wild-type MeLCs without or with Noggin treatment. Scale bar 100 µm. n = 3 biologically independent experiments. g Immunofluorescent staining for BRA in ISL1-null MeLCs without or with BMP4 treatment. Scale bar 100 µm. n = 6 biologically independent experiments. AMLCs amniotic ectoderm-like cells, MeLCs mesoderm-like cells.
Fig. 6
Fig. 6. Embryonic-like sac assay.
See also Supplementary Fig. 13. Brightfield (BF) images of embryonic-like sacs overlayed with nuclei stained with DAPI (blue) derived from wild-type (left side) and ISL1-null (right side) hESCs. Immunofluorescent staining for NANOG (red), BRA (magenta), ISL1 (yellow), and MIXL1 (cyan) are shown in the panels on the right-hand side of the corresponding brightfield images. n > 15 for each. Scale bar, 20 µm.
Fig. 7
Fig. 7. A summary scheme depicting the embryogenesis of wild-type and ISL1 mutant embryos.
In primate embryogenesis, the amnion forms a signaling center where ISL1-dependent BMP4 signaling drives streak and mesoderm formation.

References

    1. Domian IJ, et al. Generation of functional ventricular heart muscle from mouse ventricular progenitor cells. Science. 2009;326:426–429. doi: 10.1126/science.1177350. - DOI - PMC - PubMed
    1. Laugwitz KL, et al. Postnatal isl1+ cardioblasts enter fully differentiated cardiomyocyte lineages. Nature. 2005;433:647–653. doi: 10.1038/nature03215. - DOI - PMC - PubMed
    1. Moretti A, et al. Multipotent embryonic isl1+ progenitor cells lead to cardiac, smooth muscle, and endothelial cell diversification. Cell. 2006;127:1151–1165. doi: 10.1016/j.cell.2006.10.029. - DOI - PubMed
    1. Bu L, et al. Human ISL1 heart progenitors generate diverse multipotent cardiovascular cell lineages. Nature. 2009;460:113–117. doi: 10.1038/nature08191. - DOI - PubMed
    1. Sahara M, et al. Population and single-cell analysis of human cardiogenesis reveals unique LGR5 ventricular progenitors in embryonic outflow tract. Dev. Cell. 2019;48:475–490.e477. doi: 10.1016/j.devcel.2019.01.005. - DOI - PubMed

Publication types

Substances