. 2021 Aug 26;12(1):5142.
doi: 10.1038/s41467-021-25329-5.

Self-assembling human heart organoids for the modeling of cardiac development and congenital heart disease

Affiliations

Self-assembling human heart organoids for the modeling of cardiac development and congenital heart disease

Yonatan R Lewis-Israeli et al. Nat Commun. .

Abstract

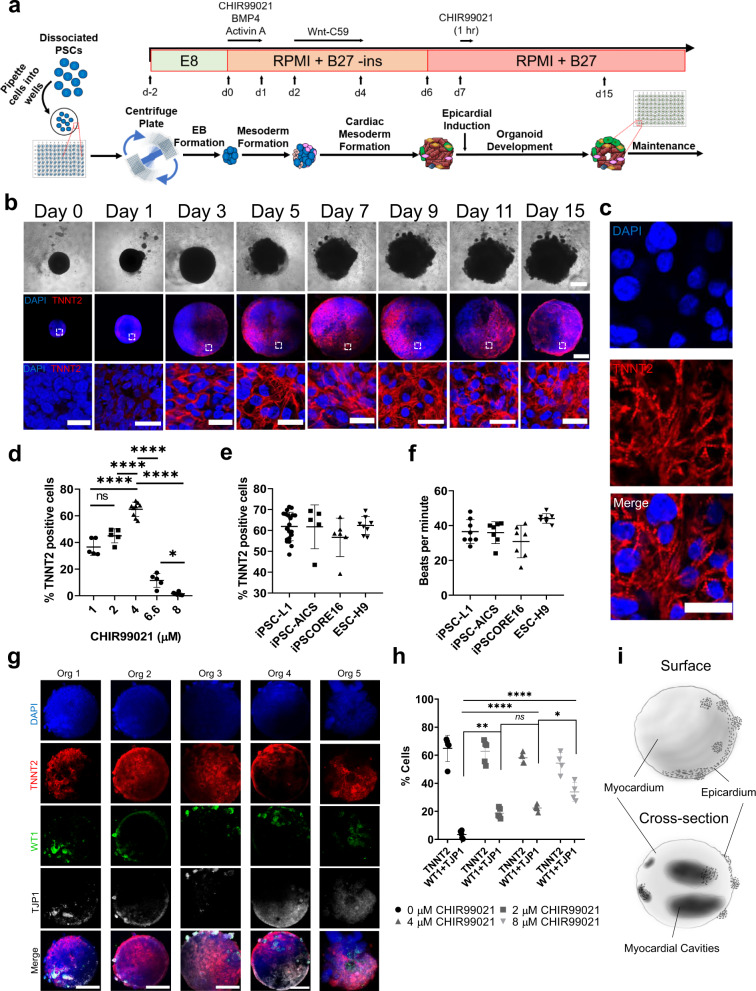
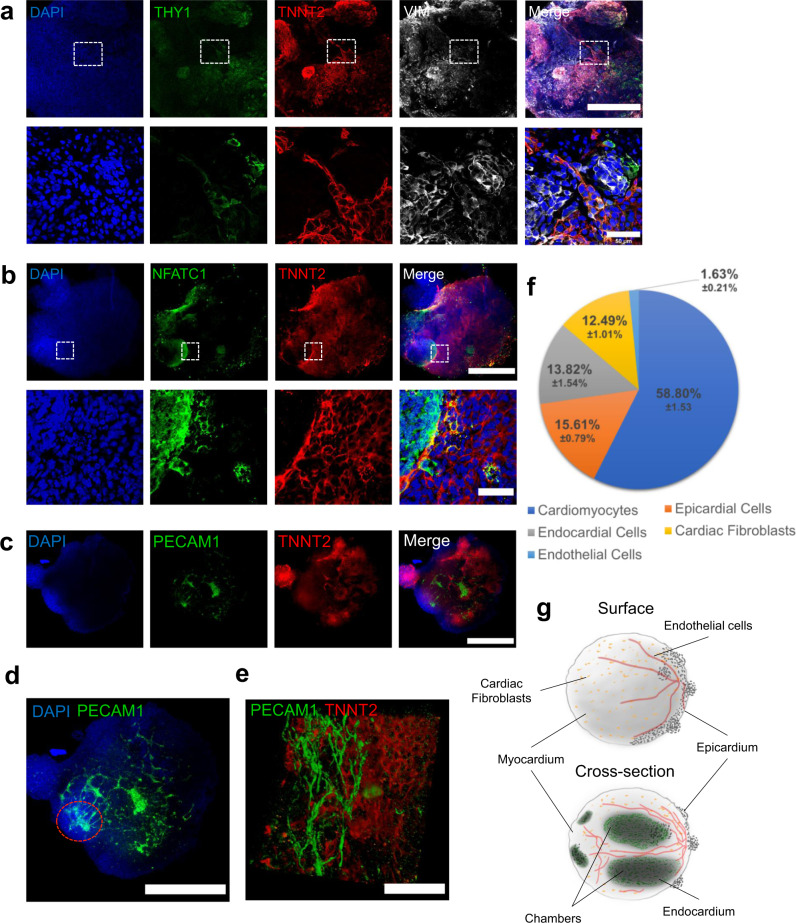
Congenital heart defects constitute the most common human birth defect, however understanding of how these disorders originate is limited by our ability to model the human heart accurately in vitro. Here we report a method to generate developmentally relevant human heart organoids by self-assembly using human pluripotent stem cells. Our procedure is fully defined, efficient, reproducible, and compatible with high-content approaches. Organoids are generated through a three-step Wnt signaling modulation strategy using chemical inhibitors and growth factors. Heart organoids are comparable to age-matched human fetal cardiac tissues at the transcriptomic, structural, and cellular level. They develop sophisticated internal chambers with well-organized multi-lineage cardiac cell types, recapitulate heart field formation and atrioventricular specification, develop a complex vasculature, and exhibit robust functional activity. We also show that our organoid platform can recreate complex metabolic disorders associated with congenital heart defects, as demonstrated by an in vitro model of pregestational diabetes-induced congenital heart defects.


Conflict of interest statement

The authors declare no conflicts of interest.

Figures

Fig. 1
Fig. 1. Three-step WNT signaling modulation triggers heart organoid formation in 3D culture.
a A schematic diagram depicting the protocol used to differentiate TNNT2 + cardiomyocytes in embryoid bodies. CHIR99021 concentration is variable at day 0 and day 7. (Blue cells represent PSCs, red cells represent cardiomyocytes, all other colors represent non-myocyte cells). b Brightfield images of developing organoid over 15 days of differentiation (top), confocal immunofluorescence images for DAPI (blue), and TNNT2 (red), of representative organoids by day from day 0 to 15; scale bar: 500 µm, inset: 50 µm (n = 20). c Confocal immunofluorescence images for DAPI (blue) and TNNT2 (red), in day 15 organoids differentiated using 4 µM CHIR99021 showing sarcomere bands; Scale bar: 25 µm. d Cell quantification of cardiomyocytes within organoids taken at multiple z-planes as a percentage of TNNT2 + cells to total cells of each organoid for the five CHIR99021 concentrations (n = 5 organoids). Value = mean ± s.d., 1 way ANOVA multiple comparison test; *p = 0.02, ****p < 0.0001, ns: no significance p = 0.08. e Percentage of TNNT2 + cells normalized to total cells in confocal images of hHOs (n = 20 organoids), and f beating frequency (n = 7 organoids), in 3 iPSC lines and 1 ESC line. Value = mean ± s.d. g Confocal immunofluorescence images of hHOs at differentiation day 15 for DAPI (blue), WT1 (green), TNNT2 (red), and TJP1 (white) after day 7 epicardial induction with 2 µM CHIR99021 (n = 12 organoids). h Cell quantification of cardiomyocyte (TNNT2 +) and epicardial cells (WT1 + and TJP1 +) within organoids taken at multiple z-planes as a percentage of total cells of each day 15 organoid (n = 5 organoids). Value = mean ± s.d., 1 way ANOVA multiple comparison test; *p = 0.04, **p = 0.0023, ****p < 0.0001, otherwise ns: no significance p = 0.9. E8: Essential 8 media, RPMI + B27 – ins: RPMI with B27 supplements without insulin. i Sketch of hHOs showing surface (top) and cross-section (bottom) features of the hHOs. Source data are provided as a Source Data file.
Fig. 2
Fig. 2. Heart organoids contain multi-cell type complexity and possess developmental and maturation characteristics similar to embryonic fetal hearts.
a K-means cluster analysis of heart organoid transcriptomes by RNA-seq. Clusters strongly associated with fetal heart development (e.g. 2, 10, and 14) appear from day 9 onwards. Pathway enrichment analysis is provided below for representative cardiac-specific clusters. b Gene expression analysis (log2 fold-change vs. day 0) of first and second heart field markers over heart organoid differentiation process (FHF, SHF respectively). c Gene expression analysis (log2 fold-change vs. day 0) for cardiac-specific cell type populations in heart organoids, including epicardial cells, fibroblasts, endocardial cells, and endothelium. d Normalized comparison of key genes involved in cardiac function across heart organoids, monolayer differentiation methods, and fetal hearts at gestational day 57–67. e Hierarchical clustering analysis of heart organoids, monolayer differentiation, and fetal hearts. FG57/67: fetal gestation day 57/67, FHF: first heart field, MONO_D19: monolayer cardiomyocytes at day 19 of differentiation, ORG_D19: human heart organoids at day 19 of differentiation, OXPHOS: oxidative phosphorylation, SHF: second heart field. Heatmap colors are relative intensity representing gene expression.
Fig. 3
Fig. 3. hHO cardiac cell lineage composition.
ae Immunofluorescence images of various cell lineages composing the hHOs. a, Cardiac fibroblast markers THY1 (green) and VIMENTIN (white) present throughout the hHOs, TNNT2 (red), DAPI (blue); scale bar: 500 µm, inset: 50 µm. b Endocardial marker NFATC1 (green) highly expressed within chambers of TNNT2 + tissue (red); scale bar: 500 µm, inset: 50 µm. ce Endothelial marker PECAM1 (green) showing a defined network of vessels throughout the organoid and adjacent to TNNT2 + tissue (red), DAPI (blue); showing a single confocal plane (c), a maximum intensity projection to visualize the vascular network throughout the organoid (d), and a high magnification 3D reconstruction showing tubular endothelial structures (e); red dotted circle in (d) indicates area of high vascular branching. Scale bar: c, d: 500 µm, e 50 µm. f Pie chart of average cell composition in hHOs, calculated as the percentage of cells with respective cell marker over all cells by nuclei counting using ImageJ. g Sketch of hHO surface (top) and cross-section (bottom) showing the organization of cell types and features of the hHOs. Source data are provided as a Source Data file.
Fig. 4
Fig. 4. Heart field development and cardiomyocyte specification in human heart organoids.
a Confocal immunofluorescent images of two representative hHO cryosections on day 8 of differentiation showing robust HAND1 (FHF) and HAND2 (SHF) transcription factor expression (green) in different sections of the same organoid; TNNT2 (red), DAPI (blue); scale bar: 500 µm, (n = 12 organoids). b Day 3 to day 9 hHOs showing formation of FHF (HAND1, left) and SHF (HAND2, right); scale bar: 500 µm. c Confocal immunofluorescence images of three representative day 15 hHOs containing well-differentiated ventricular (MYL2, green) and atrial (MYL7, red) regions, DAPI (blue); scale bar: 500 µm (n = 10). d Inset images of organoid 1 from (c) scale bar: 50 µm. e Pie chart showing the percentage of atrial cardiomyocytes (MLC2a + DAPI), ventricular cardiomyocytes (MLC2v + DAPI), and non-myocyte cells (DAPI only); value = mean ± SD, (n = 6 organoids). FHF: first heart field, Org: organoid, SHF: second heart field. Source data are provided as a Source Data file.
Fig. 5
Fig. 5. BMP4 and Activin A improve heart organoid differentiation and development.
ag All panels compare hHOs differentiated with CHIR99021 alone (control) and with CHIR + BMP4 + Activin A (treated). a Percent of cardiomyocyte and epicardial positive cells as a percentage of total DAPI + nuclei (n = 7 organoids per condition, value = mean ± s.d., 2-way ANOVA Sidak’s multiple comparisons test, ns: p = 0.76 for TNNT2 and p = 0.97 for WT1 + TJP1) and b organoid diameter, (n = 13 organoids per condition, value = mean ± s.d., two-tailed, unpaired t-test, *p = 0.012). c Dashed lines showing the diameter of a control (left) and treated (right) organoid averaged to determine the diameter. d Interconnectivity of chambers measured by their separation by thin TNNT2 + filaments or by thin channels showing clear connection (n = 10 organoids per condition, value = mean ± s.d., two-tailed, unpaired t-test, *p = 0.041). e immunofluorescence images of hHOs showing interconnected chambers (yellow arrows), TNNT2 + filaments (white arrows), and channels connecting chambers (green arrows), DAPI (blue), TNNT2 (red), scale bar: 500 µm, inset: 100 µm. f PECAM1 + cells as a percentage of total DAPI + nuclei, (n = 7 organoids per condition, value = mean ± s.d., two-tailed, unpaired t-test, **p = 0.0023). g Immunofluorescence images of hHOs showing DAPI (blue), PECAM1 tissue (green), and TNNT2 tissue (red), scale bar: 500 µm, inset: 50 µm (n = 12).
Fig. 6
Fig. 6. Heart organoids recapitulate functional and structural features of the developing heart.
a Optical coherence tomography images showing cross-sections through an organoid, revealing chambers; scale bar: 500 µm. b TEM images of hHOs showing endoplasmic reticulum (ER), gap junctions (Gj), glycogen granules (Gy), lipid droplets (Ld), mitochondria (Mi), nucleus (N), and sarcomeres (S); scale bars: 2 µm (top), 1 µm (bottom). c Immunofluorescence images of myocardial tissue in hHOs showing WGA staining of T-tubule-like structures (green); white arrowheads indicate representative T-tubule-like structures between cardiomyocytes; scale bar: 50 µm, inset: 20 µm. d Electrophysiology recordings of 4 organoids on microelectrode array spanning 15 s and a representative action potential wave (inset). e Ca2 + transients in 4 representative hHOs after two weeks of differentiation.
Fig. 7
Fig. 7. Human heart organoids faithfully recapitulate hallmarks of pregestational diabetes-induced congenital heart disease.
a Brightfield images following the development of 10 hHOs under normal glycemic conditions (NHOs, left) and under diabetic conditions (PGDHOs, right) over two weeks of differentiation. b Area of hHOs under a light microscope over the first two weeks of differentiation (value = mean ± s.d.; n = 12; 2-way ANOVA Sidak’s multiple comparisons test, exact p-values: day 0: p > 0.99, day 2: p = 0.017, day 4: p = 0.94, day 6: p = 0.99, day 8: p = 0.0008, day 10: p = 0.0003, days 12 and 14: p < 0.0001). c Electrophysiology was performed on NHOs and PGDHOs at 15 days. Arrows indicate arrhythmic events. d Seahorse analysis for oxygen consumption rate (OCR), and e extracellular acidification rate (ECAR) of normal and diabetic hHOs (Value = mean ± s.d; n = 3 organoids per condition). f Ultrastructural analysis by TEM of NHOs and PGDHOs showing endoplasmic reticulum (ER), gap junctions (Gj), glycogen granules (Gy), lipid droplets (Ld), mitochondria (Mi), nucleus (N), and sarcomeres (S); scale bars: 2 µm. g Confocal immunofluorescence images at differentiation day 15 for cardiac (TNNT2, red) and epicardial (WT1, green) formation, scale bar: 500 µm. h Confocal imaging for ventricular (MYL2, green) and atrial (MYL7, red) chamber formation under normal and diabetic-like conditions, scale bar: 500 µm. 2-DG: 2-deoxy-d-glucose, ECAR: extracellular acidification rate, NHOs: normal heart organoids, OCR: oxygen consumption rate, PGDHOs: pregestational diabetes heart organoids, Rot/AA: Rotenone and Antimycin A. Source data are provided as a Source Data file.

References

    1. Takasato M, et al. Kidney organoids from human iPS cells contain multiple lineages and model human nephrogenesis. Nature. 2015;526:564–568. doi: 10.1038/nature15695. - DOI - PubMed
    1. Crespo M, et al. Colonic organoids derived from human induced pluripotent stem cells for modeling colorectal cancer and drug testing. Nat. Med. 2017;23:878–884. doi: 10.1038/nm.4355. - DOI - PMC - PubMed
    1. Serra D, et al. Self-organization and symmetry breaking in intestinal organoid development. Nature. 2019;569:66–72. doi: 10.1038/s41586-019-1146-y. - DOI - PMC - PubMed
    1. Mansour AA, et al. An in vivo model of functional and vascularized human brain organoids. Nat. Biotechnol. 2018;36:432–441. doi: 10.1038/nbt.4127. - DOI - PMC - PubMed
    1. Dunn, K. K. & Palecek, S. P. Engineering scalable manufacturing of high-quality stem cell-derived cardiomyocytes for cardiac tissue repair. Front. Med. 5, 1–18 (2018). - PMC - PubMed

Publication types