. 2021 Aug 26;12(1):5148.
doi: 10.1038/s41467-021-25412-x.

AHR signaling is induced by infection with coronaviruses

Affiliations

AHR signaling is induced by infection with coronaviruses

Federico Giovannoni et al. Nat Commun. .

Abstract

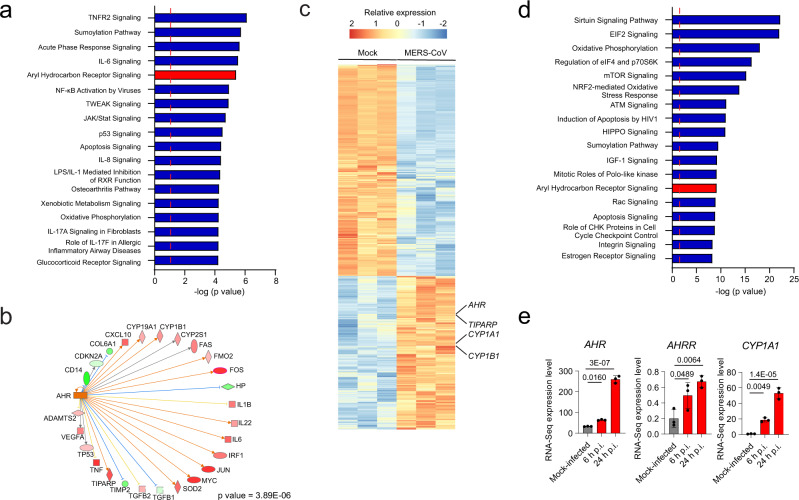
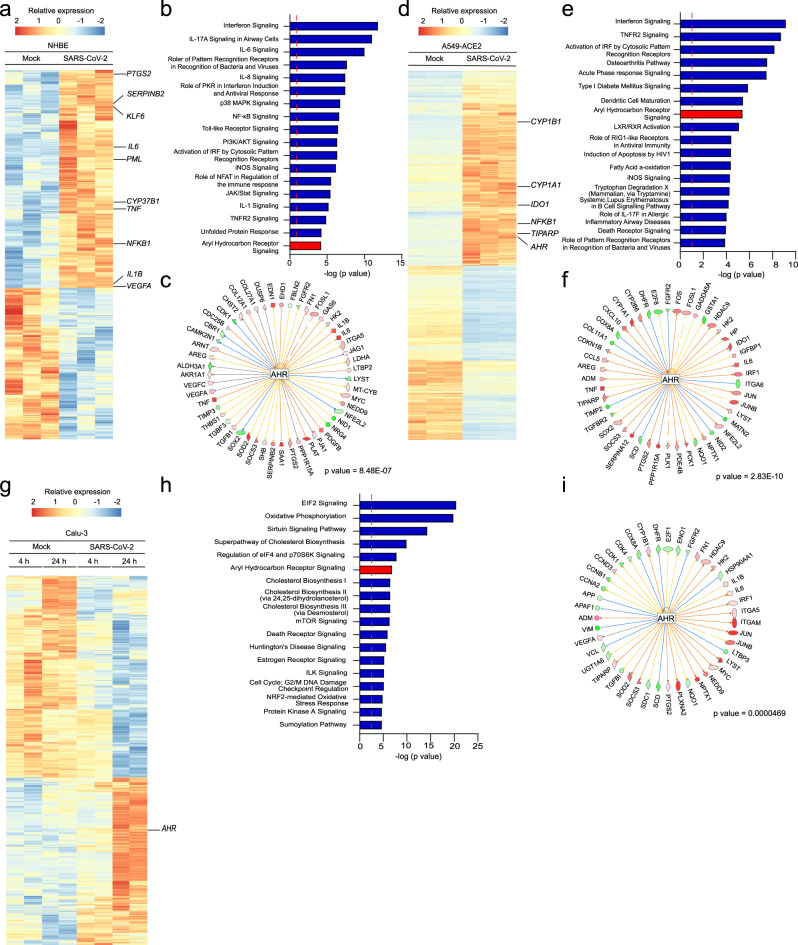
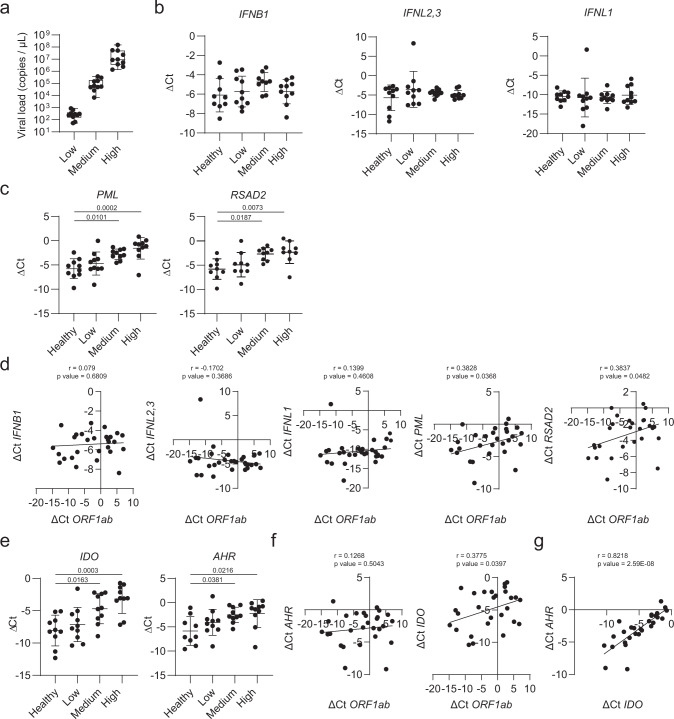
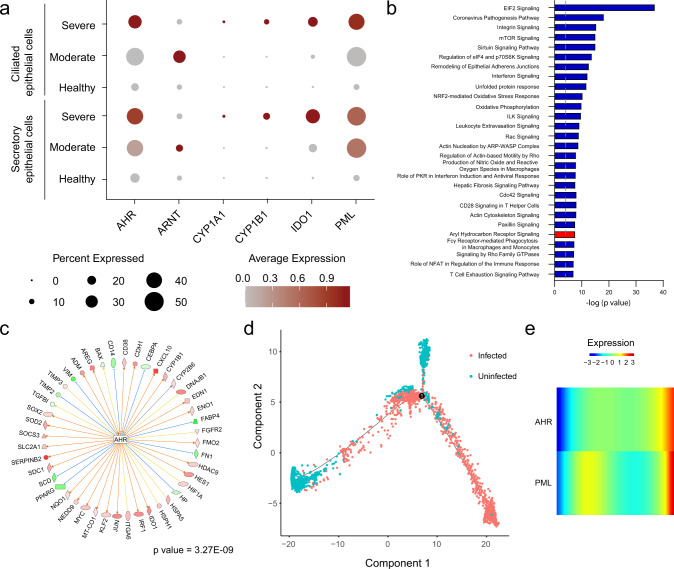
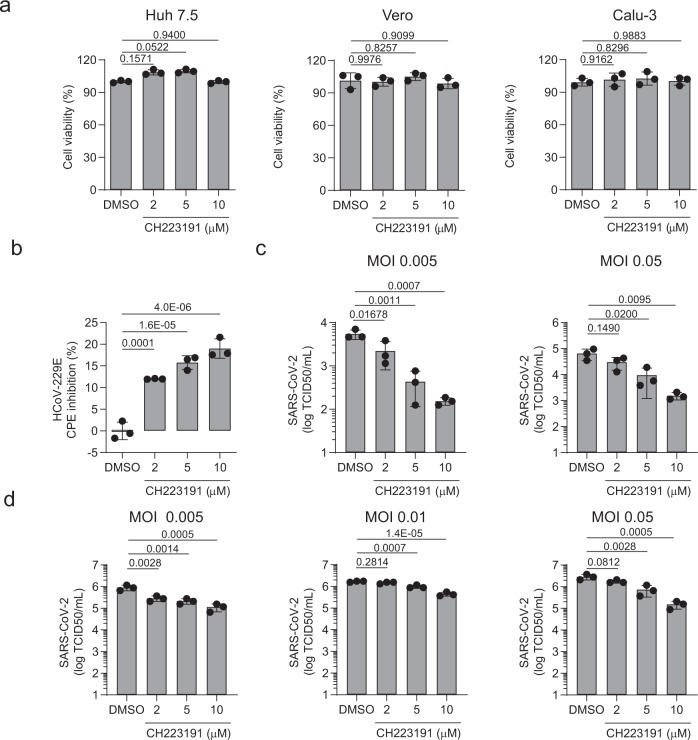
Coronavirus infection in humans is usually associated to respiratory tract illnesses, ranging in severity from mild to life-threatening respiratory failure. The aryl hydrocarbon receptor (AHR) was recently identified as a host factor for Zika and dengue viruses; AHR antagonists boost antiviral immunity, decrease viral titers and ameliorate Zika-induced pathology in vivo. Here we report that AHR is activated by infection with different coronaviruses, potentially impacting antiviral immunity and lung epithelial cells. Indeed, the analysis of single-cell RNA-seq from lung tissue detected increased expression of AHR and AHR transcriptional targets, suggesting AHR signaling activation in SARS-CoV-2-infected epithelial cells from COVID-19 patients. Moreover, we detected an association between AHR expression and viral load in SARS-CoV-2 infected patients. Finally, we found that the pharmacological inhibition of AHR suppressed the replication in vitro of one of the causative agents of the common cold, HCoV-229E, and the causative agent of the COVID-19 pandemic, SARS-CoV-2. Taken together, these findings suggest that AHR activation is a common strategy used by coronaviruses to evade antiviral immunity and promote viral replication, which may also contribute to lung pathology. Future studies should further evaluate the potential of AHR as a target for host-directed antiviral therapy.


Conflict of interest statement

F.J.Q. is a member of the Scientific Advisory Board of Kyn Therapeutics. The other authors declare no competing interests.

Figures

Fig. 1
Fig. 1. AHR signaling is triggered in response to infection with multiple CoVs.
a IPA of pathways enriched in HCoV-229E-infected cells compared to mock-infected human lung adenocarcionma (A549) cells (n = 3 independent experiments per condition). Dashed red line indicates p = 0.05. p values were determined using a right-tailed Fisher’s exact test. b IPA Upstream regulator analysis identified AHR as a transcriptional regulator of the gene expression in response to HCoV-229E infection. p value was determined using a right-tailed Fisher’s exact test. Genes are represented as nodes. The shape of a node indicates the protein main function according to IPA. The color of the nodes represents expression levels: upregulated genes are shown in red and down-regulated genes are shown in green. The color of the lines indicates the predicted directional effect between two molecules. An orange line indicates a predicted upregulation, a blue line indicates a predicted downregulation and a yellow line indicates inconsistent findings. c Heatmap showing gene expression detected by RNA-seq analysis of mock-infected and MERS-CoV-infected human lung adenocarcinoma (Calu-3) cells (n = 3 independent experiments per condition). d IPA of pathways enriched in MERS-CoV-infected cells compared to mock-infected cells (n = 3 independent experiments per condition). Dashed red line indicates p = 0.05. p values were determined using a right-tailed Fisher’s exact test. e mRNA expression levels of AHR, AHRR, and CYP1A1 determined at different times post-infection by RNA-Seq. Data represent the mean ± SD (n = 3 independent experiments). p values were determined by a one-way ANOVA followed by Dunnet’s post-hoc test. Source data are provided as a Source Data file. p.i.: post-infection.
Fig. 2
Fig. 2. AHR signaling is triggered by SARS-CoV-2 infection.
a Heatmap showing gene expression detected by RNA-seq analysis of mock-infected and SARS-CoV-2-infected primary human lung epithelium cells (n = 3 independent experiments per condition). b IPA of pathways enriched in SARS-CoV-2-infected primary human lung epithelium cells compared to mock-infected cells (n = 3 independent experiments per condition). Dashed red line indicates p = 0.05. p values were determined using a right-tailed Fisher’s exact test. c IPA Upstream regulator analysis identified AHR as an upstream transcriptional regulator of the gene expression in response to SARS-CoV-2 infection. p value was determined using a right-tailed Fisher’s exact test. Shapes and color coding as described in Fig. 1 (b). d Heatmap showing gene expression detected by RNA-seq analysis of mock-infected and SARS-CoV-2-infected A549-ACE2 cells (n = 3 independent experiments per condition). e IPA of pathways enriched in SARS-CoV-2-infected A549-ACE2 cells compared to mock-infected cells (n = 3 independent experiments per condition). Dashed red line indicates p = 0.05. p values were determined using a right-tailed Fisher’s exact test. f IPA Upstream regulator analysis identified AHR as an upstream transcriptional regulator of the gene expression in response to SARS-CoV-2 infection. p value was determined using a right-tailed Fisher’s exact test. Shapes and color coding as described in Fig. 1 (b). g Heatmap showing gene expression detected by RNA-seq analysis of mock-infected and SARS-CoV-2-infected Calu-3 cells at 4 and 24 h post-infection (n = 2 independent experiments per condition). h IPA of pathways enriched in SARS-CoV-2-infected Calu-3 cells compared to mock-infected cells at 24 h post-infection (n = 2 independent experiments per condition). Dashed red line indicates p = 0.05. p values were determined using a right-tailed Fisher’s exact test. i IPA Upstream regulator analysis identified AHR as an upstream transcriptional regulator of the gene expression in response to SARS-CoV-2 infection. p value was determined using a right-tailed Fisher’s exact test. Shapes and color coding as described in Fig. 1 (b).
Fig. 3
Fig. 3. RT-qPCR analysis on nasal swabs from COVID-19 patients revealed activation of AHR signaling.
a SARS-CoV-2 viral load in nasal swabs from COVID-19 patients was determined by RT-qPCR. Patients were classified intro three groups (low, medium, and high) on the basis of their viral load. Data is represented as a box and whiskers plot (n = 30 patients). Whiskers are plotted down to the minimum and up to the maximum value. The box extends from the 25th to 75th percentiles. The line in the middle of the box is plotted at the median. b IFNB1, IFNL2,3, and IFNL1 mRNA expression were determined by RT-qPCR in nasal swab samples from healthy (n = 10) and COVID-19 patients (n = 30). Data represent the mean ± SD. p values were determined by a one-way ANOVA followed by Tukey’s post-hoc test. c PML and RSAD2 mRNA expression was determined by RT-qPCR in nasal swab samples from healthy (n = 10) and COVID-19 patients (n = 30). Data represent the mean ± SD. p values were determined by a one-way ANOVA followed by Tukey’s post-hoc test. d Correlation analysis between expression levels of IFNB1, IFNL2,3, IFNL1, PML, RSAD2, and viral ORF1ab was computed using the Pearson correlation coefficient. Two-tailed p values were calculated. e IDO and AHR mRNA expression were determined as in (b). Data represent the mean ± SD. p values were determined by a one-way ANOVA followed by Tukey’s post-hoc test. f Correlation analysis between expression levels of IDO, AHR, and viral ORF1ab was calculated as in (d). Two-tailed p values were calculated. g Correlation analysis between AHR and IDO expression levels was calculated as in (d). Two-tailed p values were calculated. Source data are provided as a Source Data file.
Fig. 4
Fig. 4. scRNA-Seq on BALF epithelial cells identified activation of AHR signaling in COVID-19 patients.
aAHR, ARNT, CYP1A1, CYP1B1, IDO1, and PML mRNA expression levels were determined by scRNA-Seq in ciliated and secretory epithelial cells from healthy or COVID-19 patients. b Ingenuity pathway analysis comparing uninfected to SARS-CoV-2 infected secretory epithelial cells. Dashed red line indicates p = 0.05. p values were determined using a right-tailed Fisher’s exact test. c Upstream regulator analysis on infected secretory epithelial cells identified AHR as a significant transcriptional regulator in the response of secretory epithelial cells to SARS-CoV-2 infection. p value was determined using a right-tailed Fisher’s exact test. d Cell fate trajectory analysis e Pseudo-time analysis of AHR and PML expression in infected cells.
Fig. 5
Fig. 5. Pharmacological inhibition of AHR limits CoVs replication in vitro.
a Huh 7.5, Vero, and Calu-3 cells were pretreated with the indicated concentrations of the AHR antagonist CH22319 and cell viability was determined using an MTS assay. Data represent the mean ± SD (n = 3 independent experiments). p values were determined by a one-way ANOVA followed by Tukey’s post-hoc test. b Huh 7.5 cells were pretreated with the indicated concentrations of the AHR antagonist CH223191 and infected with HCoV-229E (MOI = 0.1); 72 h p.i. CPE was quantified. Data represent the mean ± SD (n = 3 independent experiments). p values were determined by a one-way ANOVA followed by Tukey’s post-hoc test. c Calu-3 cells were pretreated with the indicated concentrations of CH223191 and infected with SARS-CoV-2 at the indicated MOI; 48 h p.i. supernatants were harvested for quantification of the viral titer. Data represent the mean ± SD (n = 3 independent experiments). p values were determined by a one-way ANOVA followed by Tukey’s post-hoc test. d Vero cells were used as described in (c). Data represent the mean ± SD (n = 3 independent experiments). p values were determined by a one-way ANOVA followed by Tukey’s post-hoc test. Source data are provided as a Source Data file.

References

    1. Cui J, Li F, Shi ZL. Origin and evolution of pathogenic coronaviruses. Nat. Rev. Microbiol. 2019;17:181–192. doi: 10.1038/s41579-018-0118-9. - DOI - PMC - PubMed
    1. Drosten C, et al. Identification of a novel coronavirus in patients with severe acute respiratory syndrome. N. Engl. J. Med. 2003;348:1967–1976. doi: 10.1056/NEJMoa030747. - DOI - PubMed
    1. Ksiazek TG, et al. A novel coronavirus associated with severe acute respiratory syndrome. N. Engl. J. Med. 2003;348:1953–1966. doi: 10.1056/NEJMoa030781. - DOI - PubMed
    1. Zhong NS, et al. Epidemiology and cause of severe acute respiratory syndrome (SARS) in Guangdong, People’s Republic of China, in February, 2003. Lancet. 2003;362:1353–1358. doi: 10.1016/S0140-6736(03)14630-2. - DOI - PMC - PubMed
    1. Fouchier RA, et al. Aetiology: Koch’s postulates fulfilled for SARS virus. Nature. 2003;423:240. doi: 10.1038/423240a. - DOI - PMC - PubMed

Publication types

Substances