. 2021 Aug 26;12(1):5136.
doi: 10.1038/s41467-021-25370-4.

A TALE/HOX code unlocks WNT signalling response towards paraxial mesoderm

Affiliations

A TALE/HOX code unlocks WNT signalling response towards paraxial mesoderm

Luca Mariani et al. Nat Commun. .

Abstract

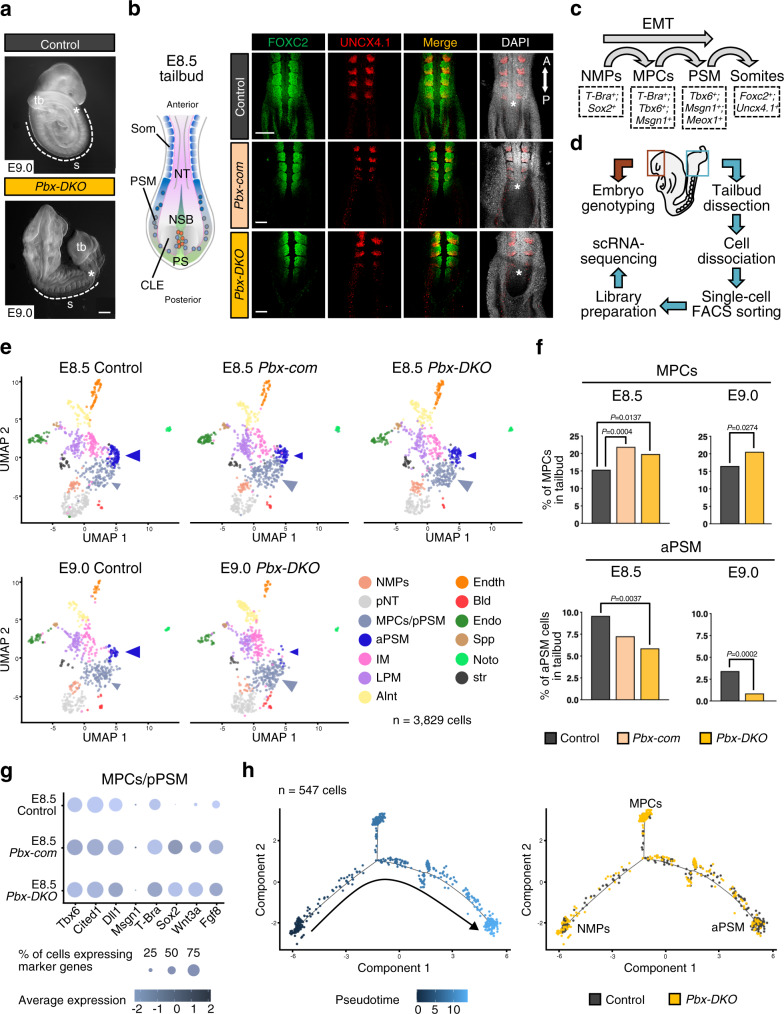
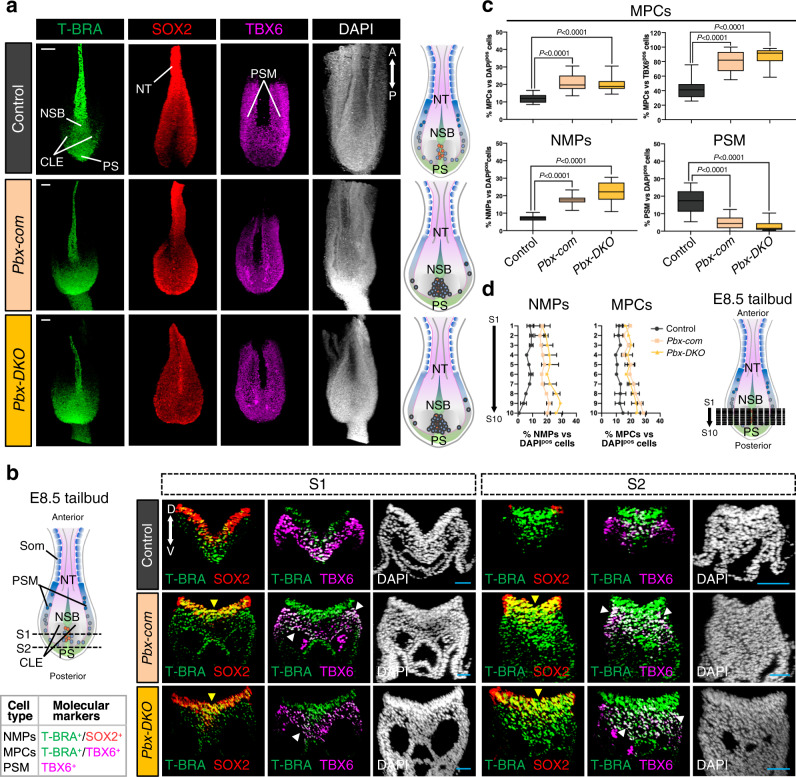
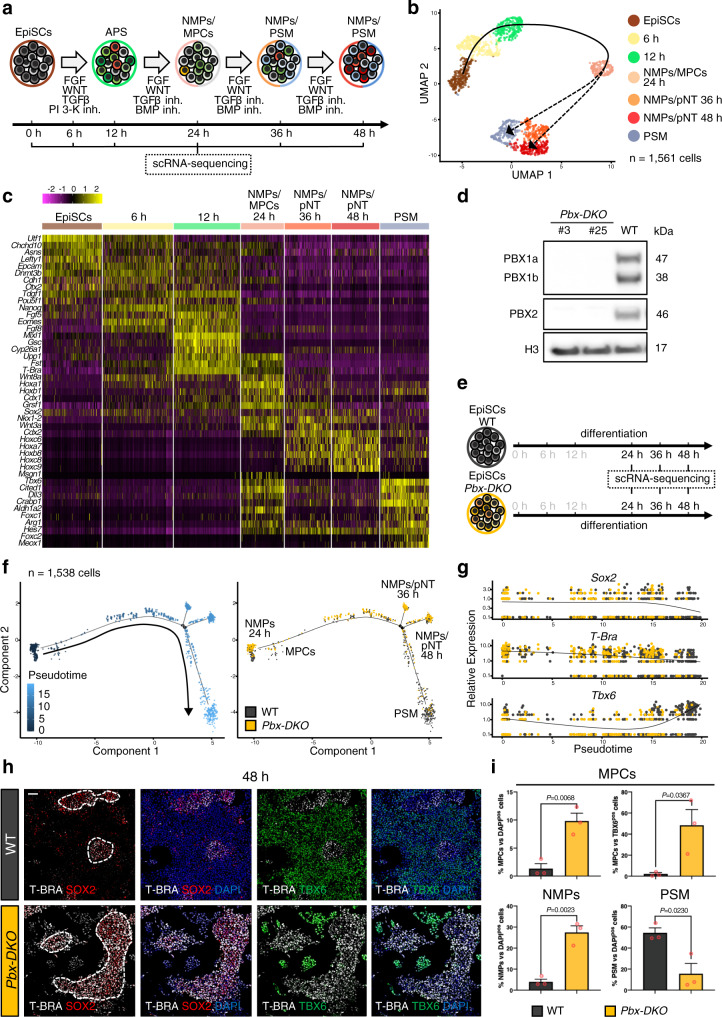
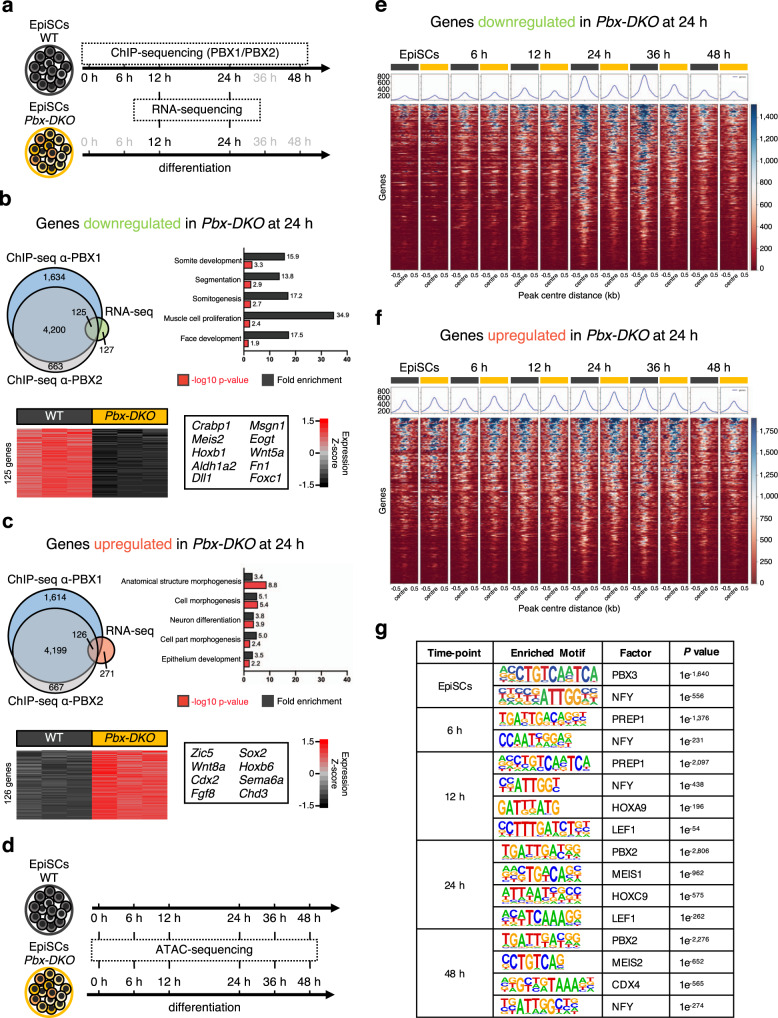
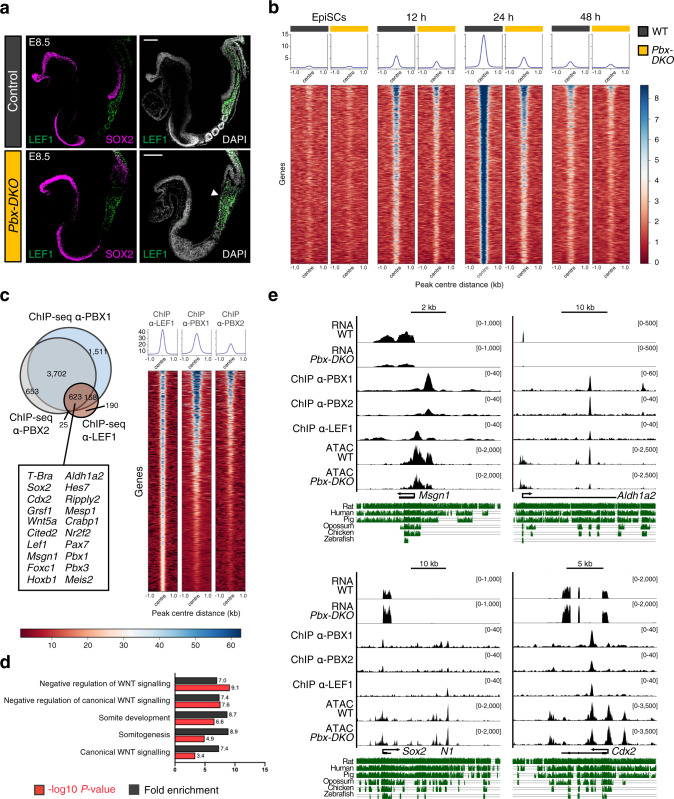
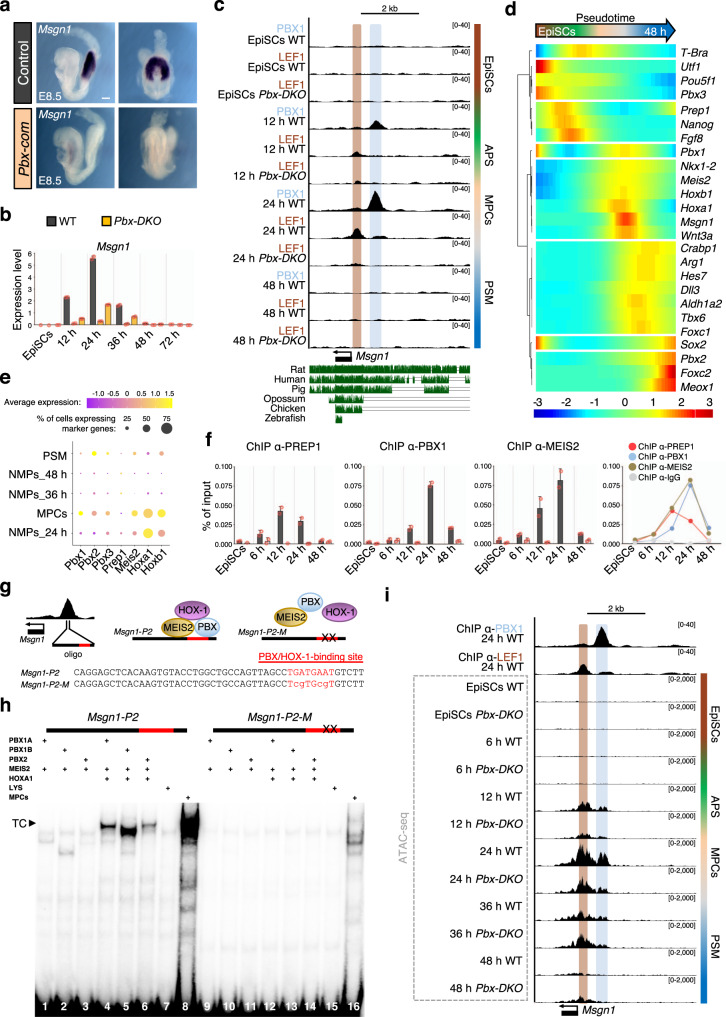
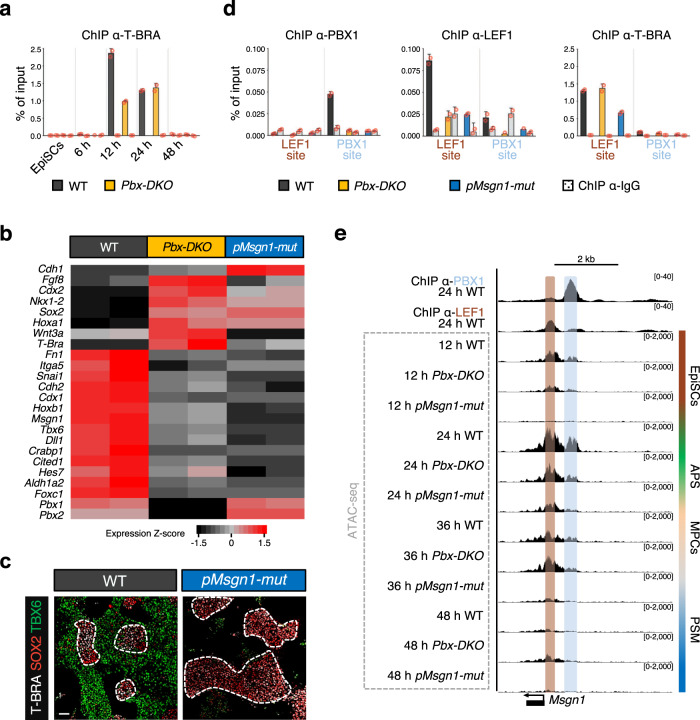
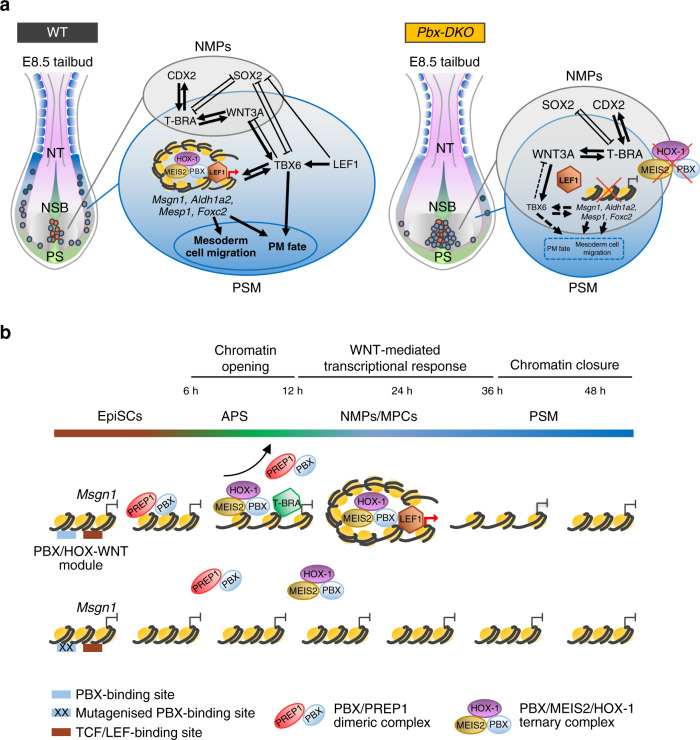
One fundamental yet unresolved question in biology remains how cells interpret the same signalling cues in a context-dependent manner resulting in lineage specification. A key step for decoding signalling cues is the establishment of a permissive chromatin environment at lineage-specific genes triggering transcriptional responses to inductive signals. For instance, bipotent neuromesodermal progenitors (NMPs) are equipped with a WNT-decoding module, which relies on TCFs/LEF activity to sustain both NMP expansion and paraxial mesoderm differentiation. However, how WNT signalling activates lineage specific genes in a temporal manner remains unclear. Here, we demonstrate that paraxial mesoderm induction relies on the TALE/HOX combinatorial activity that simultaneously represses NMP genes and activates the differentiation program. We identify the BRACHYURY-TALE/HOX code that destabilizes the nucleosomes at WNT-responsive regions and establishes the permissive chromatin landscape for de novo recruitment of the WNT-effector LEF1, unlocking the WNT-mediated transcriptional program that drives NMPs towards the paraxial mesodermal fate.


Conflict of interest statement

The authors declare no competing interests.

Figures

Fig. 1
Fig. 1. PBX proteins control the transition of NMPs towards PSM, underlying the acquisition of paraxial mesoderm identity.
a Gross morphology of E9.0 Pbx1−/−;Pbx2−/− (Pbx-DKO) embryos showing enlarged tailbud (tb), shortened trunk and rudimentary somites (s). Scale bar: 200 µm. b Dorsal views of E8.5 Pbx1−/−;Pbx2+/− (Pbx-com) and Pbx-DKO mouse embryos stained with FOXC2 (green) and UNCX4.1 (red) antibodies display abnormal somitogenesis. The cartoon on the left is a schematic representation of the E8.5 mouse tailbud. CLE caudal lateral epiblast, NSB node-streak border, PS primitive streak, PSM pre-somitic mesoderm, Som somites, NT neural tube, A anterior, P posterior. Scale bars: 70 µm. In a and b, asterisks denote the newly generated somites. c Schematics illustrating paraxial mesoderm differentiation from bipotent NMPs to somites, showing intermediate states and associated lineage markers. EMT epithelial-to-mesenchymal transition. d Strategy used to perform single-cell RNA-seq (scRNA-seq) of mouse embryonic tailbuds. e ScRNA-seq of E8.5/E9.0 control, Pbx-com and Pbx-DKO embryonic tailbuds. Unsupervised clustering and UMAP visualisation reveal reduced aPSM (dark blue arrowhead) and expanded MPCs/pPSM (light blue arrowhead) cell populations in Pbx mutants. Individual cells are coloured according to annotated cluster identities: NMPs neuromesodermal progenitors, pNT pre-neural tube, MPCs/pPSM mesodermal progenitor cells/posterior pre-somitic mesoderm, aPSM anterior pre-somitic mesoderm, IM intermediate mesoderm, LPM lateral plate mesoderm, Alnt allantois, Endth endothelial cells, Bld blood, Endo endoderm, Spp splanchnopleura, Noto notochord, str stressed cells. f Percentage of MPCs and aPSM cells in control (black), Pbx-com (light pink) and Pbx-DKO (yellow) tailbuds at E8.5 and E9.0. P-values indicated in the figure were calculated by two-sided Fisher’s exact test. g Expression analysis of selected lineage markers within the MPCs/pPSM cluster isolated from control and Pbx mutant tailbuds. Dot plot shows the relative expression of the NMP markers T-Bra, Sox2, Wnt3a, Fgf8, and the mesodermal genes Tbx6, Cited1, Dll1, Msgn1, indicating co-expression of NMP and MPC markers in Pbx-com and Pbx-DKO embryos. Colour bar indicates the intensity associated with normalised expression values. h Monocle’s pseudotemporal ordering of paraxial mesoderm-related clusters displaying the progressive maturation of control cells (black) from NMPs to aPSM and the defective NMP-to-PSM transition of Pbx-DKO cells (yellow).
Fig. 2
Fig. 2. Pbx mutant NMPs fail to acquire paraxial mesodermal fate, do not progress towards PSM, and accumulate in the tailbuds.
a Confocal maximum intensity projection images of E8.5 tailbuds probed with T-BRA (green), SOX2 (red) and TBX6 (magenta) antibodies and counterstained with DAPI (grey) reveal the enlarged CLE and accumulation of T-BRApos, SOX2pos, TBX6pos cells in Pbx-com and Pbx-DKO tailbuds. The cartoons on the right depict dorsal views of E8.5 control and Pbx mutant tailbuds, with NMPs represented as red dots and MPCs as blue dots. Scale bars: 50 µm. b Confocal transverse sections of control, Pbx-com and Pbx-DKO tailbuds through the caudal progenitor zone. Black dashed lines in the cartoon indicate the plane of sections. Representative sections S1 and S2 reveal accumulation of T-BRA/SOX2 double-positive (T-BRApos;SOX2pos) NMPs in Pbx mutants (yellow arrowheads). TBX6 staining shows reduced expression in PSM and co-localisation with NMP markers in Pbx-com and Pbx-DKO tailbuds (white arrowheads). The panel on the left summarises the molecular signature used to identify the different cell types along the path towards PSM. Scale bars: 30 µm. c Box plots assessing the proportion of T-BRApos;TBX6pos cells (MPCs) relative to DAPIpos cells (total cells) or to TBX6pos cells (PSM), and T-BRApos;SOX2pos cells (NMPs) and TBX6pos cells (PSM) relative to DAPIpos cells. The box contains the 25th to 75th percentiles of the dataset, the centre line denotes the median value (50th percentile) and the whiskers extend from the smallest to the largest value. P-values were calculated by one-way ANOVA and Tukey’s test for multiple comparisons and are indicated in the figure. d Distribution of NMPs and MPCs along the anterior/posterior axis shows accumulation of NMPs and MPCs in the posterior tailbud of Pbx-com and Pbx-DKO embryos. Data are mean ± s.e.m. Black dashed lines in the cartoon indicate the plane of sections. In c and d, the percentage of different cell types for each embryo was calculated from 10 independent sections equally distributed along the anterior/posterior axis. In a, b and d: CLE caudal lateral epiblast, NSB node-streak border, PS primitive streak, PSM pre-somitic mesoderm, Som somites, NT neural tube, A anterior, P posterior, D dorsal, V ventral.
Fig. 3
Fig. 3. Pbx mutant cells fail to acquire paraxial mesoderm identity in vitro.
a Schematics of the in vitro protocol used to differentiate EpiSCs towards anterior primitive streak (APS) and pre-somitic mesoderm (PSM). b ScRNA-seq of in vitro PSM differentiation. Cells were harvested at different time-points, as indicated in a. Unsupervised clustering and UMAP visualisation reveal temporally distinct populations of NMPs (orange-red), MPCs (light pink) and PSM (light blue). Individual cells are coloured according to annotated cluster identities. Reconstructed developmental trajectories are indicated with black dashed lines. c Heatmap showing expression of key genes along the path towards PSM. Cells acquire a NMP signature at 24 h, and subsequently undergo progressive maturation towards PSM. NMPs present at 36–48 h express higher levels of posterior Hox genes (Hox6-9), consistent with the acquisition of more posterior axial identity. Colour bar indicates the intensity associated with normalised expression values. d Western blot analysis confirms absence of PBX1 and PBX2 proteins in the Pbx-DKO cell lines obtained by inactivating Pbx1 and Pbx2 in 129 EpiSCs with a CRISPR/Cas9 approach. e Schematics of wild-type (WT) and Pbx-DKO EpiSCs differentiation towards PSM. The time-points selected for scRNA-seq analyses are highlighted in black. f Monocle’s pseudotemporal ordering of WT (black) and Pbx-DKO cells (yellow) spanning the NMP-to-PSM transition (24–48 h), showing inability to generate PSM and increased number of NMPs/MPCs caused by loss of PBX. g Pseudotime analysis of PSM differentiation showing distribution of WT (black) and Pbx-DKO cells (yellow) expressing the NMP genes Sox2 and T-Bra and the PSM marker Tbx6. h Representative immunofluorescence staining for T-BRA (white), SOX2 (red) and TBX6 (green) at 48 h of differentiation reveals an accumulation of NMPs (T-BRApos;SOX2pos, dashed white lines) in Pbx-DKO cells. Scale bar: 50 µm. i Histograms representing the percentage of progenitors in WT (black) and Pbx-DKO cells (yellow) at 48 h of differentiation. Upper panel: percentage of MPCs (T-BRApos;TBX6pos) relative to DAPIpos cells (total cells) or to TBX6pos cells (PSM). Lower panel: percentage of NMPs (T-BRApos;SOX2pos) and PSM (TBX6pos) cells relative to DAPIpos cells. Data are mean ± s.e.m. P-values indicated in the figure were calculated by two-tailed unpaired t-test (n = 3 biological replicates).
Fig. 4
Fig. 4. PBX proteins occupy regulatory regions associated with PSM genes and remodel chromatin accessibility.
a Schematics of EpiSC differentiation towards PSM. The time-points selected for ChIP-seq/RNA-seq analyses are highlighted in black. b Top: overlap of downregulated genes in Pbx-DKO cells (RNA-seq) and genes associated with PBX-occupied regions at 24 h (ChIP-seq). GO-term enrichment analysis displays significant overrepresentation of terms associated with mesoderm and somite development (Binomial test with Bonferroni correction). Bottom: heatmap showing RNA-seq expression Z-scores computed for 125 downregulated PBX targets in Pbx-DKO (yellow) compared to WT cells (black). Representative markers are indicated. c Top: overlap of upregulated genes in Pbx-DKO cells (RNA-seq) associated with PBX-occupied regions (ChIP-seq) at 24 h. GO-term enrichment analysis shows correlation with terms associated with neurectoderm and embryonic development (Binomial test with Bonferroni correction). Bottom: heatmap displaying RNA-seq expression Z-scores computed for 126 upregulated PBX targets in Pbx-DKO (yellow) compared to WT cells (black). Representative markers are indicated. In b and c, significance was assessed by DEseq2 on the basis of two-sided Wald test with Benjamini–Hochberg adjusted P-values (P ≤ 0.05, fold-change ≥1.5). n = 3 biological replicates. d Schematics of EpiSC differentiation towards PSM illustrating the time-points selected for chromatin accessibility analysis (ATAC-seq). e Heatmap of chromatin accessibility of WT (black) and Pbx-DKO cells (yellow) at PBX-occupied regions that are associated with downregulated genes in Pbx-DKO along PSM differentiation, showing reduced accessibility in Pbx-DKO cells at 24 and 36 h. f Heatmap of chromatin accessibility at PBX-bound regions associated with upregulated genes in Pbx-DKO compared to WT cells. Chromatin accessibility is comparable between WT (black) and Pbx-DKO cells (yellow). The scale represents normalised counts (RPKM) for ATAC-seq peak signals ±500 bp around the centre of the peak in e and f. g Homer de novo motif analysis of 200 bp summit regions along differentiation reveals changing in binding sites enrichment at different time-points, highlighting the variety of PBX-binding partners during PSM differentiation. Only the most relevant binding motifs are shown for each time-point. See Supplementary Data 5 for the complete list.
Fig. 5
Fig. 5. PBX complexes remodel the chromatin environment for LEF1 recruitment.
a Representative immunofluorescence staining for LEF1 (green) and SOX2 (magenta) on sagittal sections of E8.5 mouse embryos, revealing specific localisation of LEF1 in PSM and posterior somites of control and Pbx-DKO embryos. LEF1 expression is bloated in the tailbud of Pbx-DKO (white arrowhead). DAPI was counterstained in grey. Scale bars: 100 µm. b Heatmap of LEF1 ChIP-seq signals of WT (black) and Pbx-DKO cells (yellow) reveals PBX crucial role in LEF1 recruitment, as demonstrated by the extensive drop of LEF1 occupancy in Pbx-DKO cells along differentiation. c Left: overlap of genes bound by PBX1 (light blue), PBX2 (grey) and LEF1 (brown). A representative subset of target genes co-bound by PBX and LEF1 is reported in the lower box. Right: heatmap of tag densities of LEF1, PBX1 and PBX2 ChIP-seq peaks at the co-bound regions identified at 24 h of differentiation. In b and c, the scale represents normalised counts (RPKM) for ChIP-seq peak signals ±1 kb around the centre of the peak. d GO-term enrichment analysis of genes bound by PBX and LEF1 displays significant overrepresentation of terms associated with WNT signalling and somite development (Binomial test with Bonferroni correction). e RNA-seq, ChIP-seq and ATAC-seq coverage tracks for PBX-LEF1-activated (Msgn1, Aldh1a2) and repressed (Sox2, Cdx2) target genes. Threshold of vertical viewing range of data based on RPKM values is noted. Conservation across vertebrates is indicated in green.
Fig. 6
Fig. 6. Sequential recruitment of PBX/HOX-1 complexes to Msgn1 promoter changes the chromatin landscape and activates transcription.
a In situ hybridisation shows loss of Msgn1 expression in E8.5 Pbx-com tailbuds. Scale bar: 100 µm. b Relative Msgn1 mRNA expression measured by RT-qPCR, revealing dynamic expression during PSM differentiation and strong downregulation in Pbx-DKO cells (yellow). c UCSC genome browser snapshot of the murine Msgn1 locus showing conservation across vertebrates. PBX1 (light blue) and LEF1 (brown) are recruited to Msgn1 promoter at 12–24 h. LEF1 binding is lost in Pbx-DKO at any time-points. d Pseudotime kinetics of lineage markers along PSM differentiation. Prep1 is expressed before PS induction (marked by T-Bra), while Pbx1, Meis2, Hox-1 are transcribed within the same time-window of Msgn1. e Dot plot analysis of scRNA-seq data of paraxial mesoderm-related clusters showing enriched expression of Pbx, Meis2, Hox-1 in MPCs at 24 h. f ChIP-qPCR analyses of TALE proteins at indicated time-points uncover the peak of PREP1 binding at 12 h and PBX1/MEIS2 at 24 h. g Top: schematics of Msgn1 locus and formation of the PBX/MEIS2/HOX-1 complex. Bottom: Msgn1-P2 oligonucleotide sequence (50 bp in the middle of PBX1 ChIP-seq peak) containing WT (upper case) and mutated (lower case) PBX/HOX-1-binding site (red). h EMSA with in vitro-translated TALE proteins and Msgn1-P2 oligonucleotide. The composition of each binding reaction is indicated. A ternary complex (TC) is formed only when PBX, MEIS2 and HOXA1 are mixed together (lines 4–6). TC is co-migrating with a complex present in MPCs nuclear extracts (line 8). The oligonucleotide with single-base substitutions in the PBX/HOX-binding site (Msgn1-P2-M) abrogates all complex formation (lines 12–14). LYS, reticulocyte lysate (lines 7 and 15). i ATAC-seq of Msgn1 locus in WT and Pbx-DKO cells along differentiation reveals specific opening of PBX1 and LEF1-binding sites. ATAC-seq signals in WT mimic Msgn1 transcriptional profile, with maximum accessibility and expression at 24 h. In Pbx-DKO cells, accessibility to Msgn1 is reduced in the LEF1-binding and the PBX/HOX-1-binding regions. Threshold of vertical viewing range of data based on RPKM values is indicated in c and i. Data are mean ± s.e.m. (n = 2 biological replicates) in b and f.
Fig. 7
Fig. 7. Combined pioneering activity of T-BRA and TALE proteins remodels the chromatin, making it accessible at Msgn1 regulatory regions, thereby directing WNT transcriptional response.
a ChIP-qPCR analysis showing specific recruitment of T-BRA to the LEF1-binding site of the Msgn1 regulatory region at 12 and 24 h. T-BRA binding is maintained in Pbx-DKO cells (yellow). b Heatmap displaying relative expression of selected differentially regulated genes in WT (black), Pbx-DKO (yellow) and pMsgn1-mut cells (blue) at 24 h (RNA-seq, P ≤ 0.05, fold-change ≥1.5). pMsgn1-mut allele carries point mutations in the PBX/HOX-1-binding site. Representative PSM and NMP markers are indicated. n = 2 biological replicates. Significance was assessed by DESeq2 on the basis of two-sided Wald test with Benjamini–Hochberg adjusted P-values. c Representative immunofluorescence staining for T-BRA (white), SOX2 (red) and TBX6 (green) at 48 h of differentiation reveals expansion of NMPs (T-BRApos;SOX2pos, dashed white lines) and reduction of PSM (TBX6pos) in pMsgn1-mut cells. Scale bar: 50 µm. d ChIP-qPCR analysis on the Msgn1 promoter displays PBX1 recruitment at the PBX/HOX-1-binding site in WT (black), but not in Pbx-DKO (yellow) nor in pMsgn1-mut cells (blue). Similarly, ChIP-qPCR analyses with LEF1 and T-BRA antibodies highlight specific binding of LEF1 and T-BRA to the LEF1-binding region in WT cells. While T-BRA is recruited to the Msgn1 promoter in Pbx-DKO and pMsgn1-mut cells, LEF1 binding is lost in both. Data are mean ± s.e.m. (n = 2 biological replicates) in a and d. e Chromatin accessibility analysis (ATAC-seq) of the Msgn1 locus in WT, Pbx-DKO and pMsgn1-mut cells along PSM differentiation displays specific open regions overlapping with the PBX (light blue) and LEF1-binding sites (brown) in WT cells at 12 and 24 h. In Pbx-DKO cells, accessibility is strongly reduced at the PBX/HOX-1-binding region. Additionally, accessibility of the Msgn1 locus is severely impaired in both LEF1 and PBX/HOX-1-binding regions in pMsgn1-mut cells, confirming the role of the PBX complexes as modulators of chromatin accessibility on WNT-responsive elements. Threshold of vertical viewing range of data based on RPKM values is specified.
Fig. 8
Fig. 8. TALE complexes promote WNT-mediated transcriptional response in paraxial mesoderm.
a Schematics of the molecular networks at play in the E8.5 embryonic tailbud. Left: cartoon showing NMPs (red dots) transitioning to MPCs (light blue dots) and migrating to the PSM (blue) in WT embryos. GRNs governing the balance between NMP expansion in the CLE (grey) and PSM differentiation (blue) are illustrated. The TALE complexes and LEF1 bind cooperatively to the regulatory regions of PM genes, like Msgn1, Aldh1a2, Mesp1 and Foxc2, promoting their expression. The activation of the PM programme ultimately controls migration of MPCs from the progenitor zone to the PSM and the acquisition of PM fate. Right: PBX loss (yellow) results in reduced mobility of the MPCs and accumulation of NMPs-MPCs in the progenitor zone, leading to enlarged tailbuds and reduced PSM formation. Failure of TALE complex assembly on the regulatory regions of PM genes impairs LEF1 recruitment and activation of the GRN promoting PSM formation. In contrast, the molecular circuits sustaining NMP expansion are maintained by positive feedback loops. Of note, the observed PBX-LEF1 binding to the N1 repressive element of the Sox2 regulatory region suggests that PBX and LEF1 cooperative activity could repress Sox2 expression (Fig. 5e) and NMP maintenance. Thus, PBX proteins are required for the transition of NMPs to PSM, playing essential and previously unappreciated roles in the early stages of somitogenesis. CLE caudal lateral epiblast, NSB node-streak border, PS primitive streak, PSM pre-somitic mesoderm, NT neural tube. b Model of the transcriptional activation of Msgn1. Msgn1 regulatory region becomes accessible at 12 h following the collaborative pioneering activity of T-BRA and the TALE complexes. Low-affinity PBX/PREP1 dimers are recruited first and could serve as HOX-1 attractors, or assist the loading of the high-affinity PBX/MEIS2/HOX-1 ternary complex, whose cooperative binding displaces nucleosomes and generates the suitable chromatin context for LEF1 recruitment. Single-base substitutions at the PBX/HOX-1-binding site abrogate accessibility of both PBX/HOX-1 and LEF1-binding regions, emphasising the role of TALE complexes as modulators of chromatin accessibility on WNT-responsive elements.

References

    1. Aires R, Dias A, Mallo M. Deconstructing the molecular mechanisms shaping the vertebrate body plan. Curr. Opin. Cell Biol. 2018;55:81–86. doi: 10.1016/j.ceb.2018.05.009. - DOI - PubMed
    1. Stern CD, et al. Head-tail patterning of the vertebrate embryo: one, two or many unresolved problems? Int. J. Dev. Biol. 2006;50:3–15. doi: 10.1387/ijdb.052095cs. - DOI - PubMed
    1. Wilson V, Olivera-Martinez I, Storey KG. Stem cells, signals and vertebrate body axis extension. Development. 2009;136:1591–1604. doi: 10.1242/dev.021246. - DOI - PubMed
    1. Cambray N, Wilson V. Two distinct sources for a population of maturing axial progenitors. Development. 2007;134:2829–2840. doi: 10.1242/dev.02877. - DOI - PubMed
    1. Henrique D, Abranches E, Verrier L, Storey KG. Neuromesodermal progenitors and the making of the spinal cord. Development. 2015;142:2864–2875. doi: 10.1242/dev.119768. - DOI - PMC - PubMed

Publication types

MeSH terms