. 2021 Aug 26;4(1):1013.
doi: 10.1038/s42003-021-02546-8.

Redox nanomedicine ameliorates chronic kidney disease (CKD) by mitochondrial reconditioning in mice

Affiliations

Redox nanomedicine ameliorates chronic kidney disease (CKD) by mitochondrial reconditioning in mice

Aniruddha Adhikari et al. Commun Biol. .

Abstract

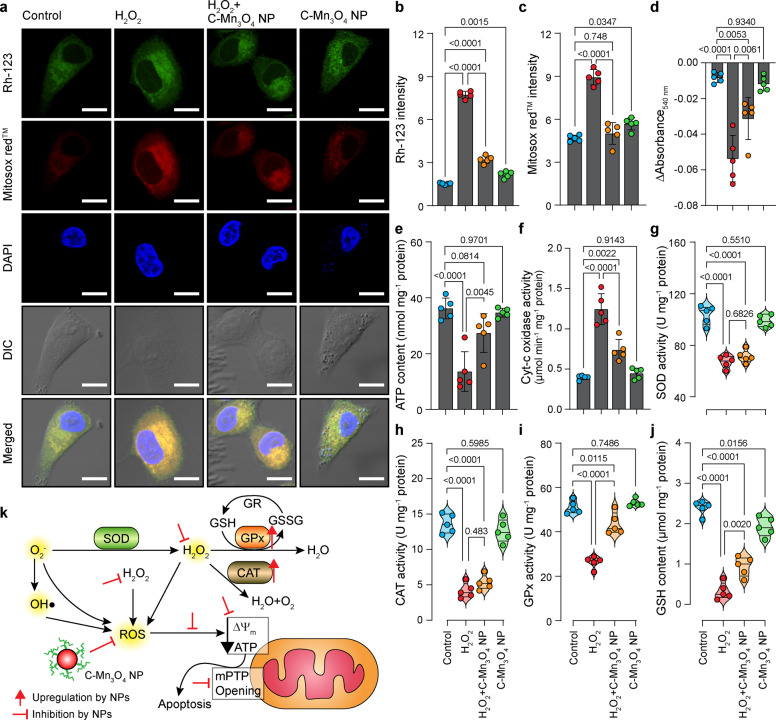
Targeting reactive oxygen species (ROS) while maintaining cellular redox signaling is crucial in the development of redox medicine as the origin of several prevailing diseases including chronic kidney disease (CKD) is linked to ROS imbalance and associated mitochondrial dysfunction. Here, we have shown that a potential nanomedicine comprising of Mn3O4 nanoparticles duly functionalized with biocompatible ligand citrate (C-Mn3O4 NPs) can maintain cellular redox balance in an animal model of oxidative injury. We developed a cisplatin-induced CKD model in C57BL/6j mice with severe mitochondrial dysfunction and oxidative distress leading to the pathogenesis. Four weeks of treatment with C-Mn3O4 NPs restored renal function, preserved normal kidney architecture, ameliorated overexpression of pro-inflammatory cytokines, and arrested glomerulosclerosis and interstitial fibrosis. A detailed study involving human embryonic kidney (HEK 293) cells and isolated mitochondria from experimental animals revealed that the molecular mechanism behind the pharmacological action of the nanomedicine involves protection of structural and functional integrity of mitochondria from oxidative damage, subsequent reduction in intracellular ROS, and maintenance of cellular redox homeostasis. To the best of our knowledge, such studies that efficiently treated a multifaceted disease like CKD using a biocompatible redox nanomedicine are sparse in the literature. Successful clinical translation of this nanomedicine may open a new avenue in redox-mediated therapeutics of several other diseases (e.g., diabetic nephropathy, neurodegeneration, and cardiovascular disease) where oxidative distress plays a central role in pathogenesis.


Conflict of interest statement

The authors declare no competing interests.

Figures

Fig. 1
Fig. 1. Characterization of C-Mn3O4 NPs.
a TEM image of C-Mn3O4 NPs shows the spherical shape of the nanoparticles with the monomodal distribution. Inset shows an HRTEM image of a single nanoparticle having a high crystalline structure with 0.311 nm interfringe distance corresponding to the (112) plane. The other inset shows the histogram for the size distribution of the nanoparticles having an average diameter of 5.58 ± 2.42 nm. b Experimental XRD peaks of the nanoparticle exactly match that of Mn3O4 hausmannite defined in the literature (JCPDS No. 24-0734). c FTIR spectra of C-Mn3O4 NPs, Mn3O4 NPs, and citrate. Perturbation at Mn–O stretching at 413, 514, 630 cm−1 (shaded gray) of Mn3O4 NPs and carboxylic groups at 1066, 1112, 1410, 1619 cm−1 (shaded yellow) of citrate confirms strong covalent binding between citrate and the nanoparticle.
Fig. 2
Fig. 2. Ability of C-Mn3O4 NPs in scavenging of intracellular ROS.
a Cell viability was measured using MTT. The gray shaded area represents H2O2 treatment. b LDH release. c Quantification of intracellular ROS as estimated from DCF fluorescence observed under confocal microscopy. d Confocal fluorescence micrographs of HEK 293 cells stained with DCFH2-DA and counterstained with DAPI. Cells were either left untreated or pretreated with C-Mn3O4 NPs (30 μg mL−1) prior exposure to H2O2 (100 µM). Scale bar: 30 µm. e Flow cytometry of HEK 293 cells stained with DCFH2-DA. Inset—intracellular ROS level quantified from flow cytometry analysis. f Dose-dependent internalization of C-Mn3O4 NPs in HEK 293 cells. The intracellular nanoparticle concentration as measured using inductively coupled plasma atomic emission spectroscopy (ICP-AES). g Correlation between biological impact (cell death and scavenging of ROS) and administered dose or intracellular nanoparticle content. All four nanoparticle concentration-biological response data are fitted with the Hill equation: y=A1+A2-A11+10logx0-xp. In bar plots data were expressed as Mean ± SD. In box plots, center lines show the medians; box limits indicate the 25th and 75th percentiles, whiskers extend 1.5 times the interquartile range from the 25th and 75th percentiles. Violins depict kernel density estimation of the underlying data distribution with the width of each violin scaled by the number of observations at that Y-value. Three lines (from the bottom to the top) in each violin plot show the location of the lower quartile (25th), the median, and the upper quartile (75th), respectively. The shaded area indicates the probability distribution of the variable. Individual data points are represented as colored circles (N = 5). One-way analysis of variance (ANOVA) followed by Tukey’s post hoc multiple comparison test was performed for comparison among the groups. The numbers inside the plots indicate numerical p values. p < 0.05 is considered significant.
Fig. 3
Fig. 3. Potential of C-Mn3O4 NPs in the regulation of cellular redox condition and protection of mitochondria from oxidative damage.
a Confocal fluorescence micrographs of HEK 293 cells stained with rhodamine 123, MitosoxTM red, and counterstained with DAPI. Cells were either left untreated or pretreated with C-Mn3O4 NPs (30 μg mL−1) prior exposure to H2O2 (100 µM). Scale bar: 10 µm. b Intensity of rhodamine 123 as a marker of mitochondrial membrane potential (Δψm). An increase in intensity indicates membrane depolarization. c Mitochondrial ROS level as quantified from MitosoxTM red fluorescence. d Change in Ca2+-induced mPTP opening. e ATP content. f Cytochrome c oxidase activity. g Superoxide dismutase (SOD) activity. h Catalase activity. i Glutathione peroxidase (GPx) activity. j Reduced glutathione (GSH) content. k Schematic representation of the redox homeostasis mechanism by C-Mn3O4 NPs against H2O2 distress through mitochondrial protection. In bar plots data were expressed as Mean ± SD. Violins depict kernel density estimation of the underlying data distribution with the width of each violin scaled by the number of observations at that Y-value. Three lines (from the bottom to the top) in each violin plot show the location of the lower quartile (25th), the median, and the upper quartile (75th), respectively. The shaded area indicates the probability distribution of the variable. Individual data points are represented as colored circles (N = 5). One-way analysis of variance (ANOVA) followed by Tukey’s post hoc multiple comparison test was performed for comparison among the groups. The numbers inside the plots indicate numerical p values. p < 0.05 is considered significant.
Fig. 4
Fig. 4. Efficacy of C-Mn3O4 NPs in the reversal of CKD in the animal model.
a Kaplan–Meier survival analysis curve. The darker shaded area represents the co-treatment period. b Blood urea nitrogen (BUN) content. c Urinary albumin excretion as an indicator of albuminuria, a hallmark of CKD. d Serum urea concentration. e Serum creatinine level. f Body weight at the end of the experimental period. g Photographs of kidneys incised after the experimental period. h Kidney index, defined as a kidney to body weight ratio (mg g−1). i Necrosis score as per the observation of an expert clinical pathologist. j Hematoxylin and eosin-stained liver sections. Insets show a magnified image of a single glomerulus. Red arrow: segmental glomerulosclerosis; Yellow arrow: global glomerulosclerosis; Yellow dotted region: mononuclear infiltration. Scale bar: 20 µm. k Glomerular injury score (GIS). l Tubular injury score (TIS). In bar plots data were expressed as Mean ± SD. Violins depict kernel density estimation of the underlying data distribution with the width of each violin scaled by the number of observations at that Y-value. Three lines (from the bottom to the top) in each violin plot show the location of the lower quartile (25th), the median, and the upper quartile (75th), respectively. The shaded area indicates the probability distribution of the variable. Individual data points are represented as colored circles or squares (N = 10). One-way analysis of variance (ANOVA) followed by Tukey’s post hoc multiple comparison test was performed for comparison among the groups. The numbers inside the plots indicate numerical p values. p < 0.05 is considered significant.
Fig. 5
Fig. 5. Effect of C-Mn3O4 NPs in the protection of intracellular redox regulatory network and inhibition of anti-inflammatory response in mice.
a Extent of lipid peroxidation (MDA, malonaldehyde content) was measured in terms of thiobarbituric acid reactive substances (TBARS). b Superoxide dismutase (SOD) activity. c Catalase activity. d Glutathione peroxidase (GPx) activity. e Tumor necrosis factor-α level. f Interleukin-1β level. g Interleukin-6 level. h Immunohistochemical analysis of kidney tissues for detection of inflammatory damages. Macrophages are stained with anti-CD-68 antibodies (brown). Scale bar: 20 µm. The dotted circles indicate the regions with high CD68 positivity (i.e., macrophage infiltration). MDA, SOD, CAT, and GPx were estimated from kidney homogenate. TNF-β, IL-1β, and IL-6 were measured from serum. Violins depict kernel density estimation of the underlying data distribution with the width of each violin scaled by the number of observations at that Y-value. Three lines (from the bottom to the top) in each violin plot show the location of the lower quartile (25th), the median, and the upper quartile (75th), respectively. The shaded area indicates the probability distribution of the variable. Individual data points are represented as colored circles (N = 10). One-way analysis of variance (ANOVA) followed by Tukey’s post hoc multiple comparison test was performed for comparison among the groups. The numbers inside the plots indicate numerical p values. p < 0.05 is considered significant.
Fig. 6
Fig. 6. Efficacy of C-Mn3O4 NPs in the protection of mitochondria, the master redox regulator in mice.
a Ca2+ induced mPTP opening measured by the decrease in 540 nm absorbance. b Mitochondrial membrane potential (Δψm) estimated using JC-1 fluorescence. c ATP content. d Cytochrome c oxidase (complex IV in the electron transport chain, ETC) activity in isolated mitochondria. e Succinate dehydrogenase (SDH, complex II in ETC) activity in isolated mitochondria. f DNA fragmentation level as a result of oxidative damage measured using agarose gel electrophoresis. In cisplatin-induced CKD animals DNA ladder formation, indicative of apoptotic DNA fragmentation, is clearly visible. The corresponding stacked bar plot shows the relative abundance of different-sized fragmented DNA in relation to the total DNA content of the lane. g Schematic overview of the comprehensive molecular mechanism of action of C-Mn3O4 NPs as a redox medicine against cisplatin-induced CKD. The numbers in the black circles indicate the sequence of events. In bar plots data were expressed as Mean ± SD. Violins depict kernel density estimation of the underlying data distribution with the width of each violin scaled by the number of observations at that Y-value. Three lines (from the bottom to the top) in each violin plot show the location of the lower quartile (25th), the median, and the upper quartile (75th), respectively. The shaded area indicates the probability distribution of the variable. Individual data points are represented as colored circles (N = 10). One-way analysis of variance (ANOVA) followed by Tukey’s post hoc multiple comparison test was performed for comparison among the groups. The numbers inside the plots indicate numerical p values. p < 0.05 is considered significant.
Fig. 7
Fig. 7. Pharmacokinetics (PK) and biocompatibility of C-Mn3O4 NPs.
a Plasma concentration-time profile following intraperitoneal administration of C-Mn3O4 NPs as measured using inductively coupled plasma-atomic emission spectroscopy (ICP-AES). Inset shows the PK parameters calculated using a non-compartmental approach. The dotted line is a guide to the eye. b Time-dependent accumulation and elimination of C-Mn3O4 NPs in the kidney. Data were normalized to wet kidney weight. c Micrographs of hematoxylin and eosin-stained sections of different organs after 1 month of treatment with the therapeutic dose (0.25 mg kg−1 body weight, i.p.) of C-Mn3O4 NPs. Both control and treated animals maintained normal tissue architecture. Scale bars: liver-100 µm, brain-50 µm, ovary-20 µm, pancreas-50 µm, spleen-100 µm, testes-100 µm. Data were expressed as Mean ± SD. Individual data points are represented as white circles (N = 5).

References

    1. Wong HL, Shimamoto K. Sending ROS on a bullet train. Sci. Signal. 2009;2:pe60. - PubMed
    1. Storz P. Reactive oxygen species–mediated mitochondria-to-nucleus signaling: a key to aging and radical-caused diseases. Sci. STKE. 2006;2006:re3. - PubMed
    1. Carroll B, et al. Oxidation of SQSTM1/p62 mediates the link between redox state and protein homeostasis. Nat. Commun. 2018;9:256. doi: 10.1038/s41467-017-02746-z. - DOI - PMC - PubMed
    1. Finkel T, Holbrook NJ. Oxidants, oxidative stress and the biology of ageing. Nature. 2000;408:239–247. doi: 10.1038/35041687. - DOI - PubMed
    1. Ling XC, Kuo K-L. Oxidative stress in chronic kidney disease. Ren. Replacement Ther. 2018;4:53. doi: 10.1186/s41100-018-0195-2. - DOI

Publication types

Substances