. 2021 Oct;24(10):1367-1376.
doi: 10.1038/s41593-021-00908-3. Epub 2021 Aug 26.

Multivariate analysis of 1.5 million people identifies genetic associations with traits related to self-regulation and addiction

Collaborators, Affiliations

Multivariate analysis of 1.5 million people identifies genetic associations with traits related to self-regulation and addiction

Richard Karlsson Linnér et al. Nat Neurosci. 2021 Oct.

Erratum in

Abstract

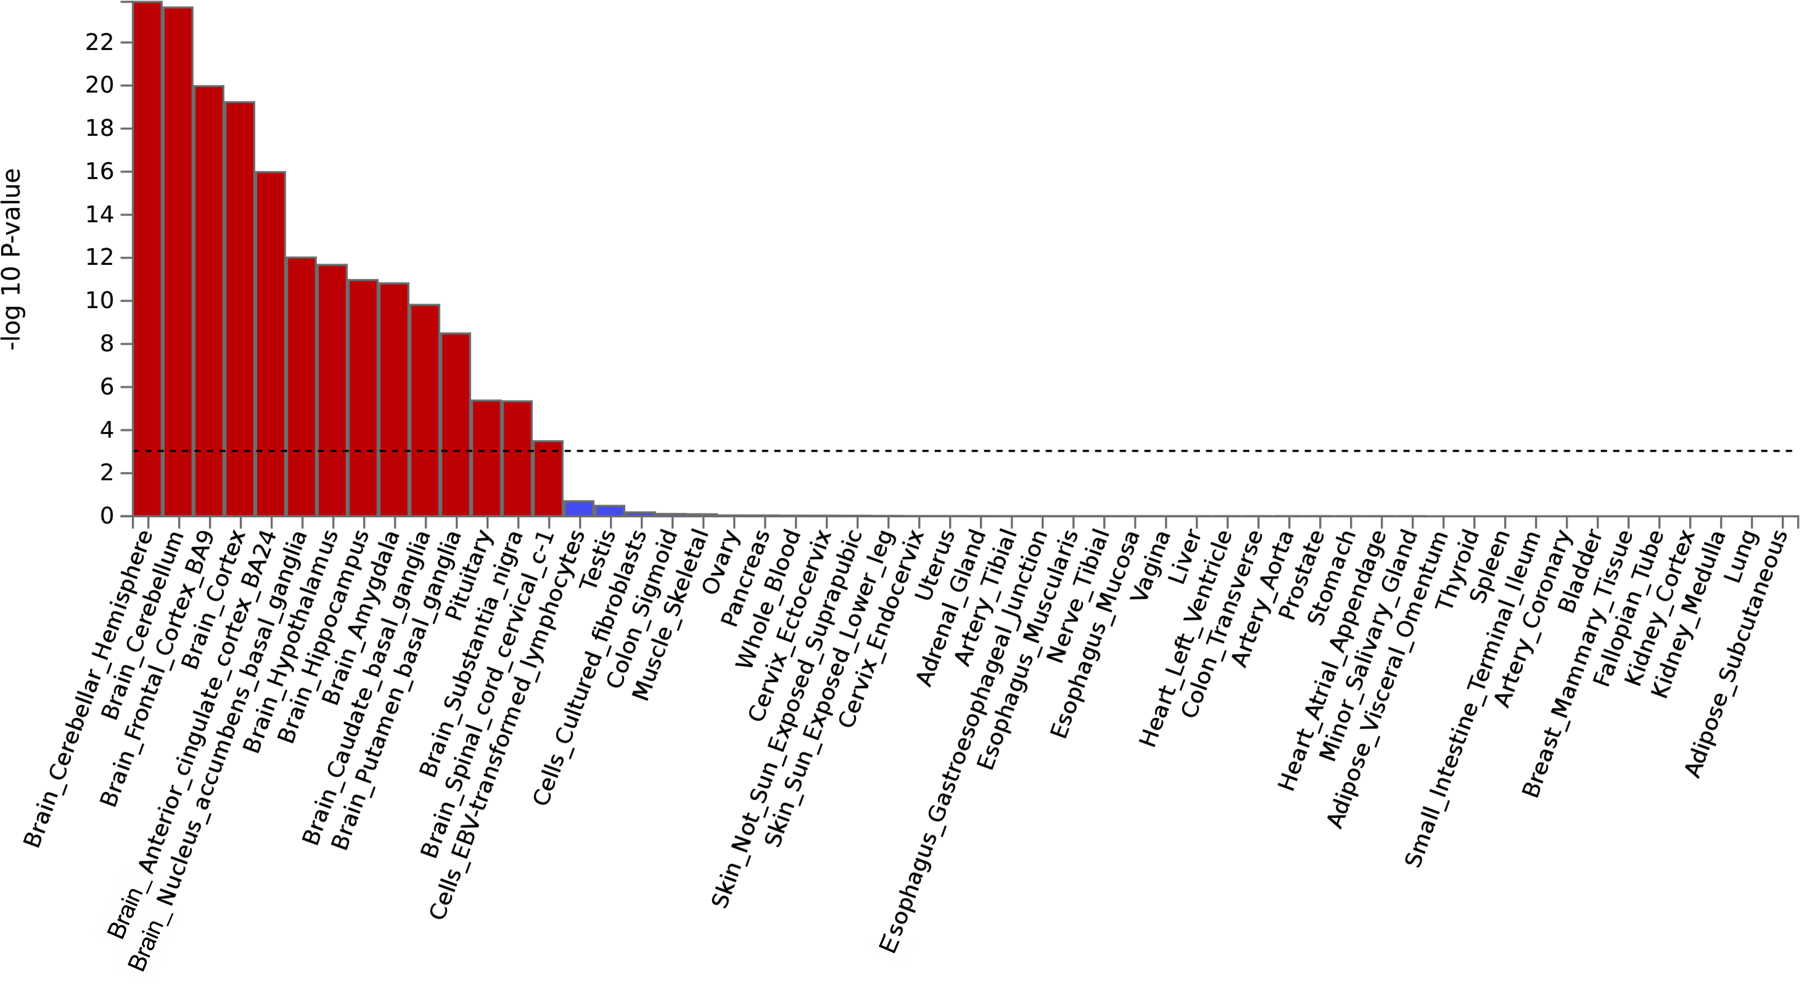
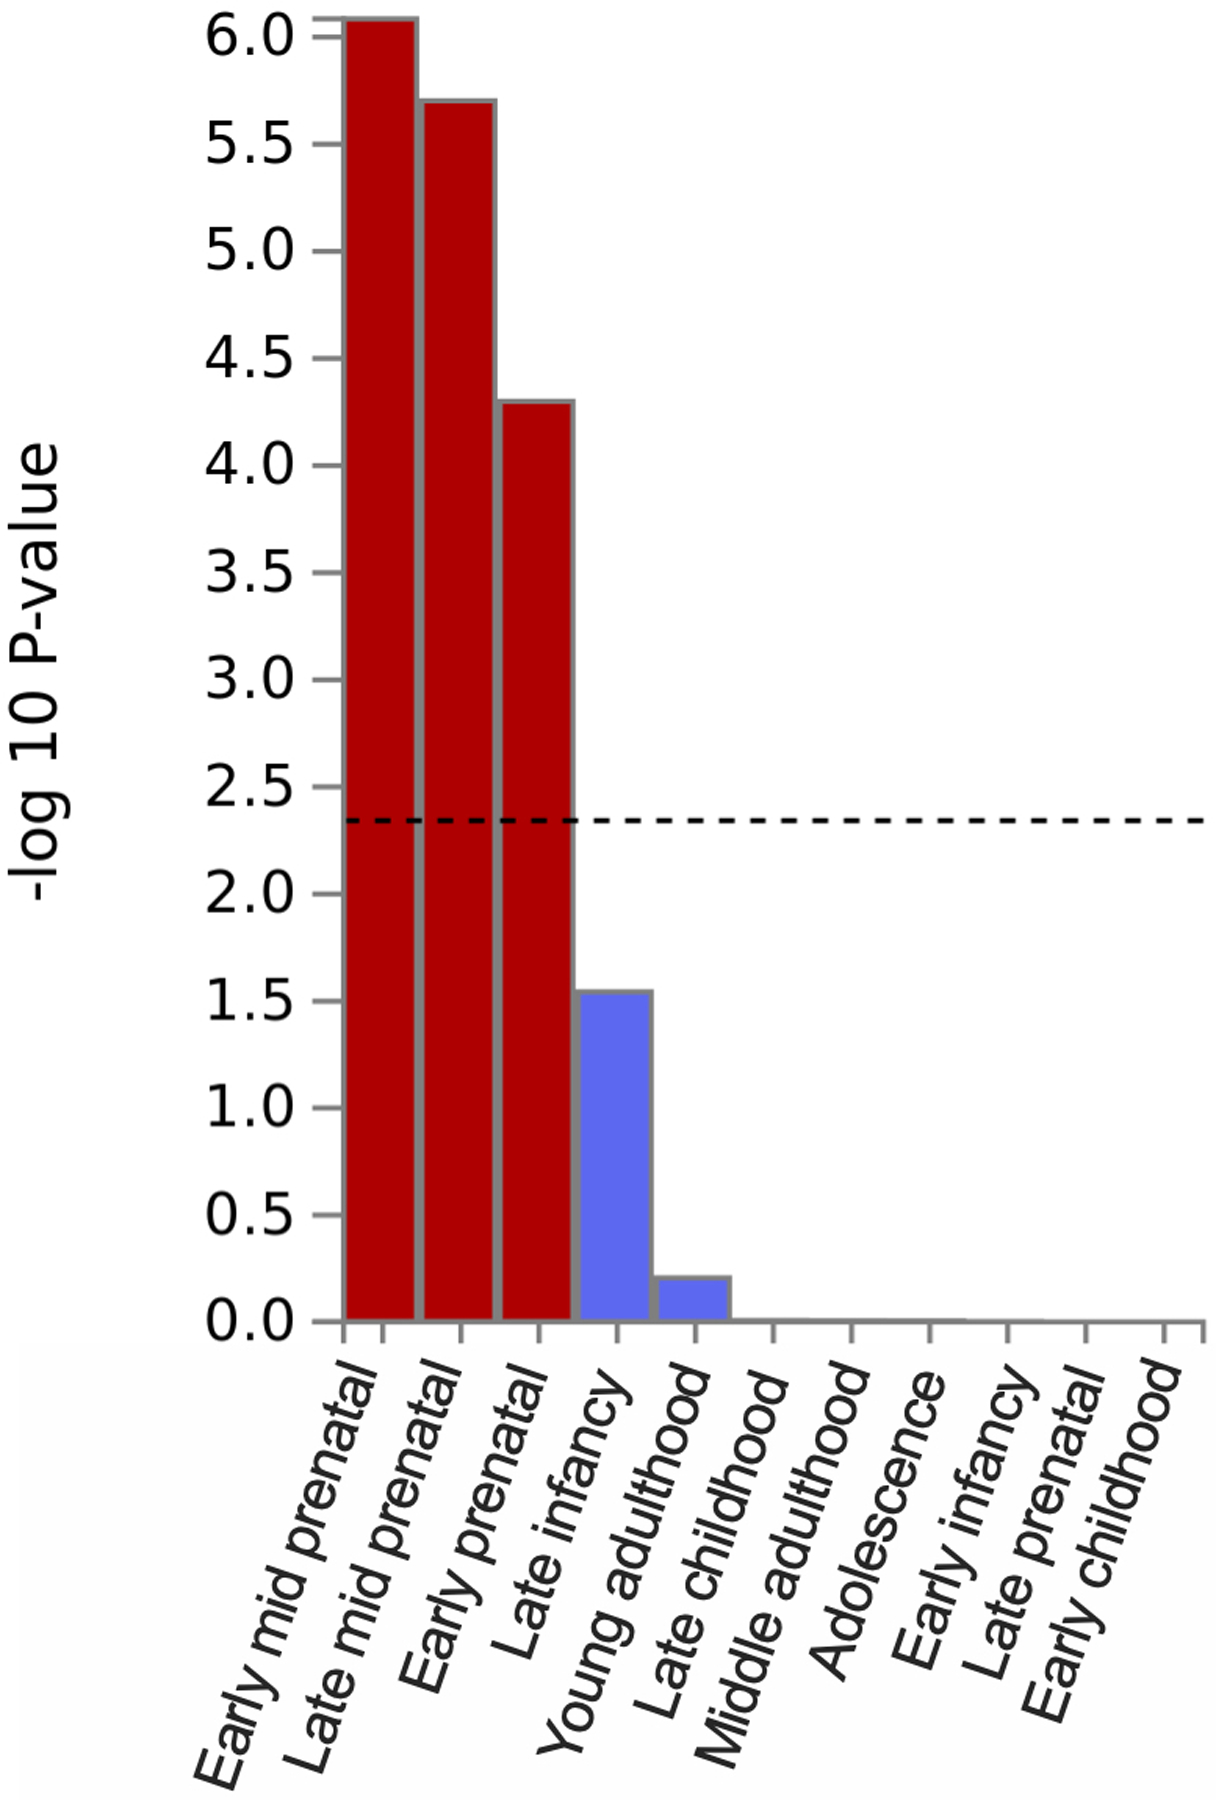
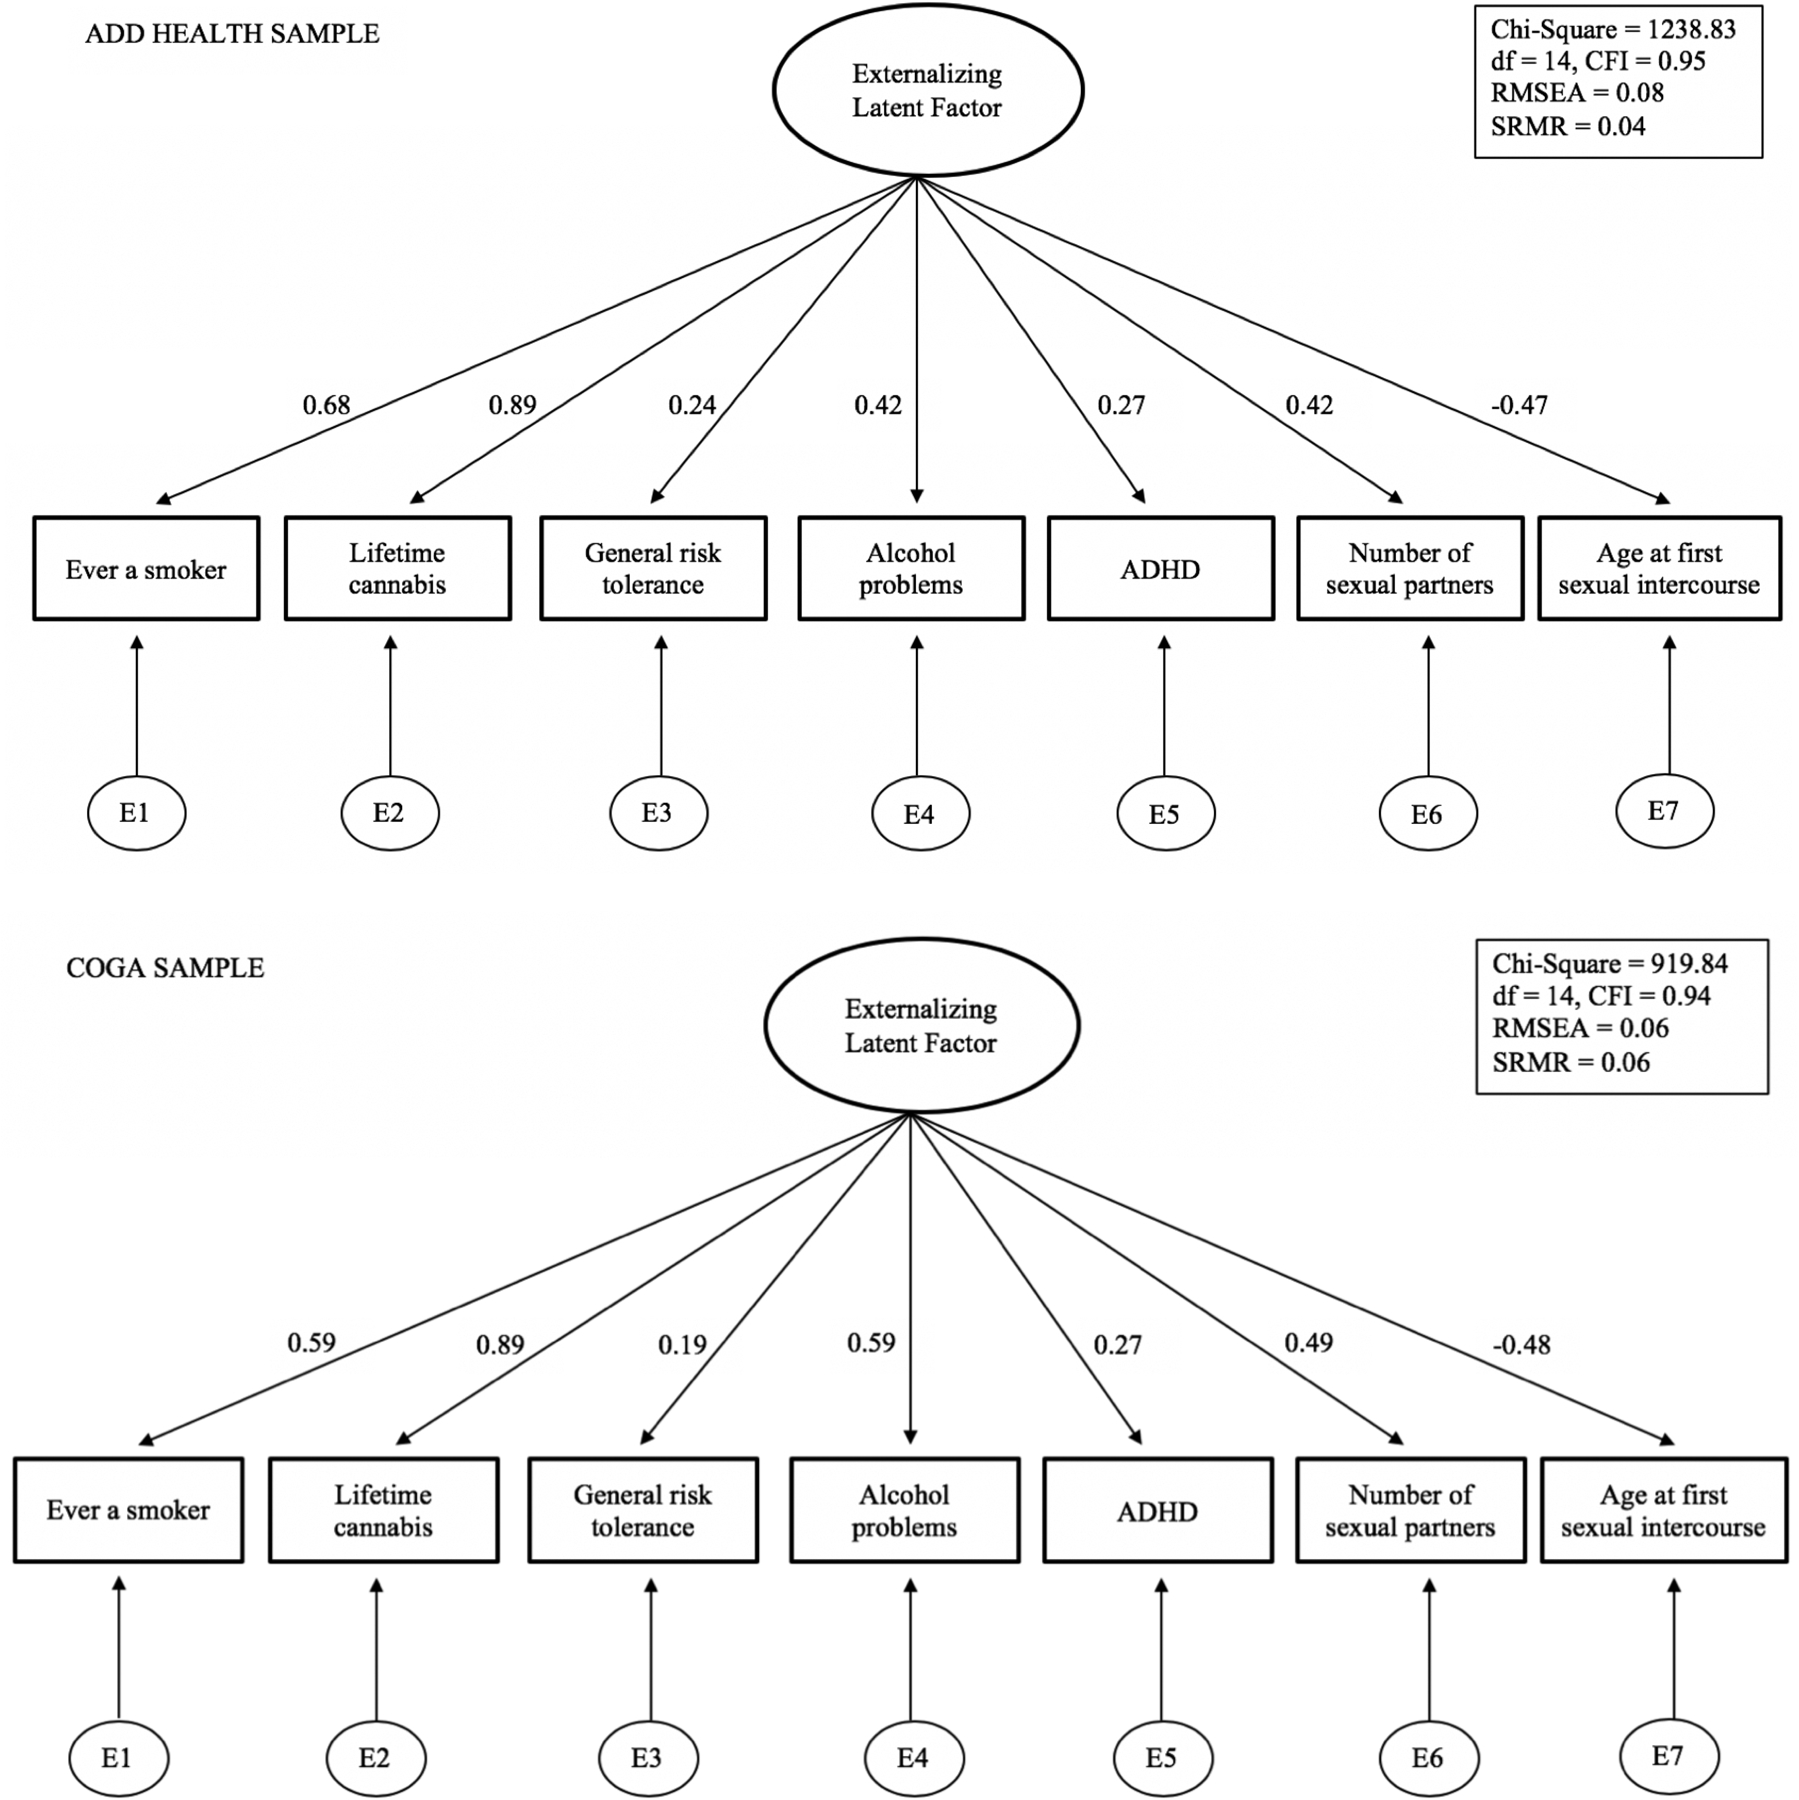
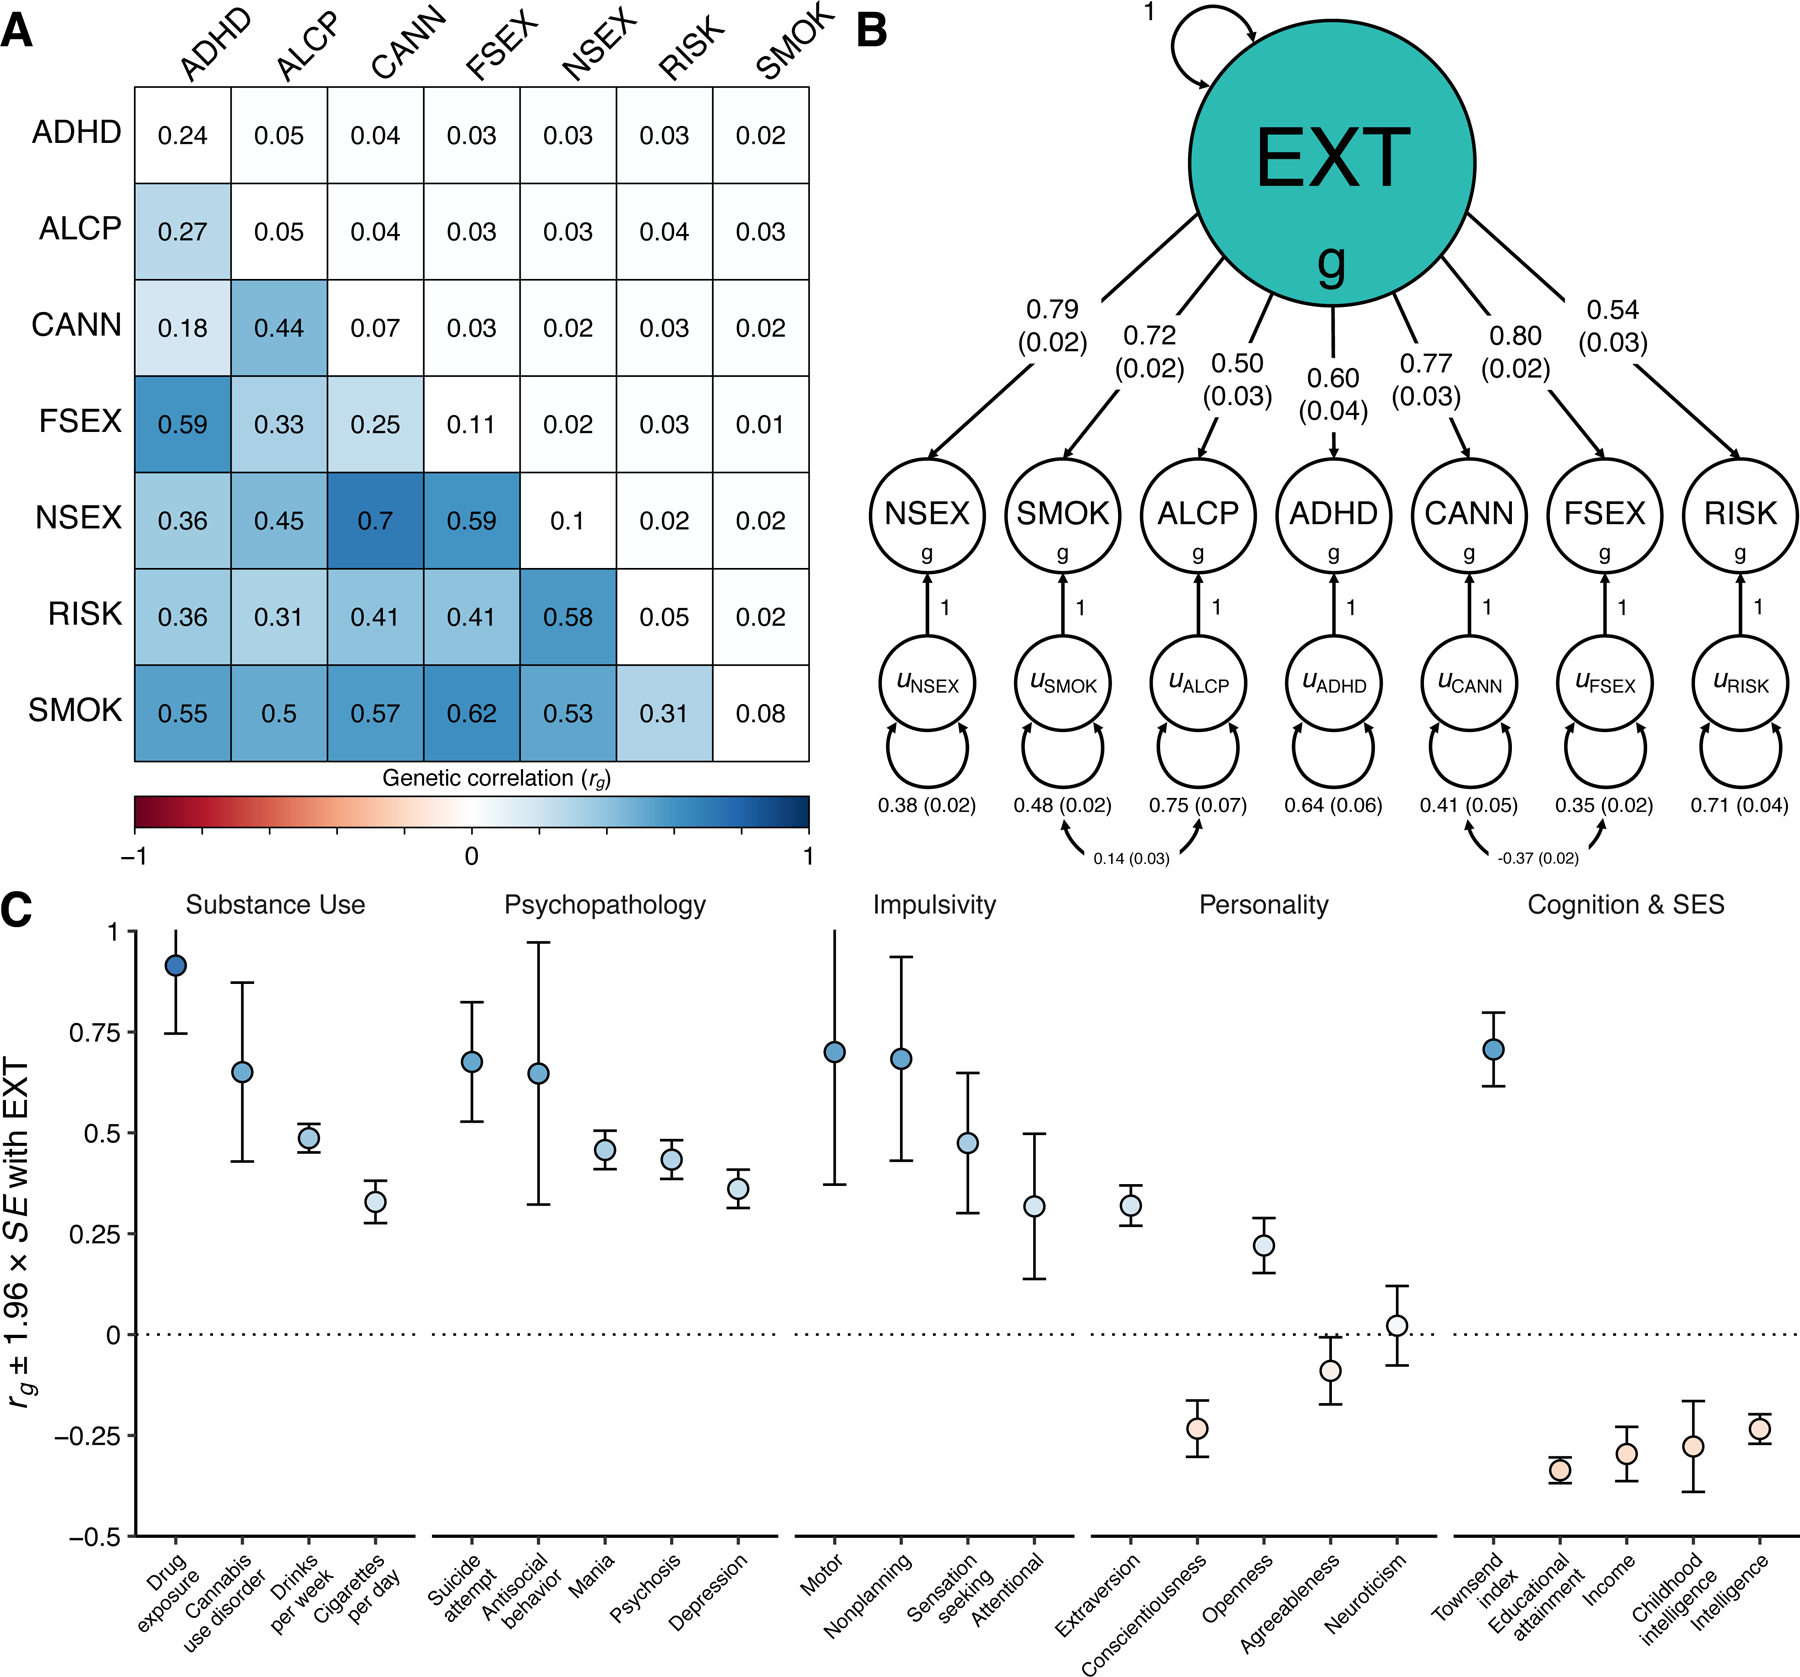
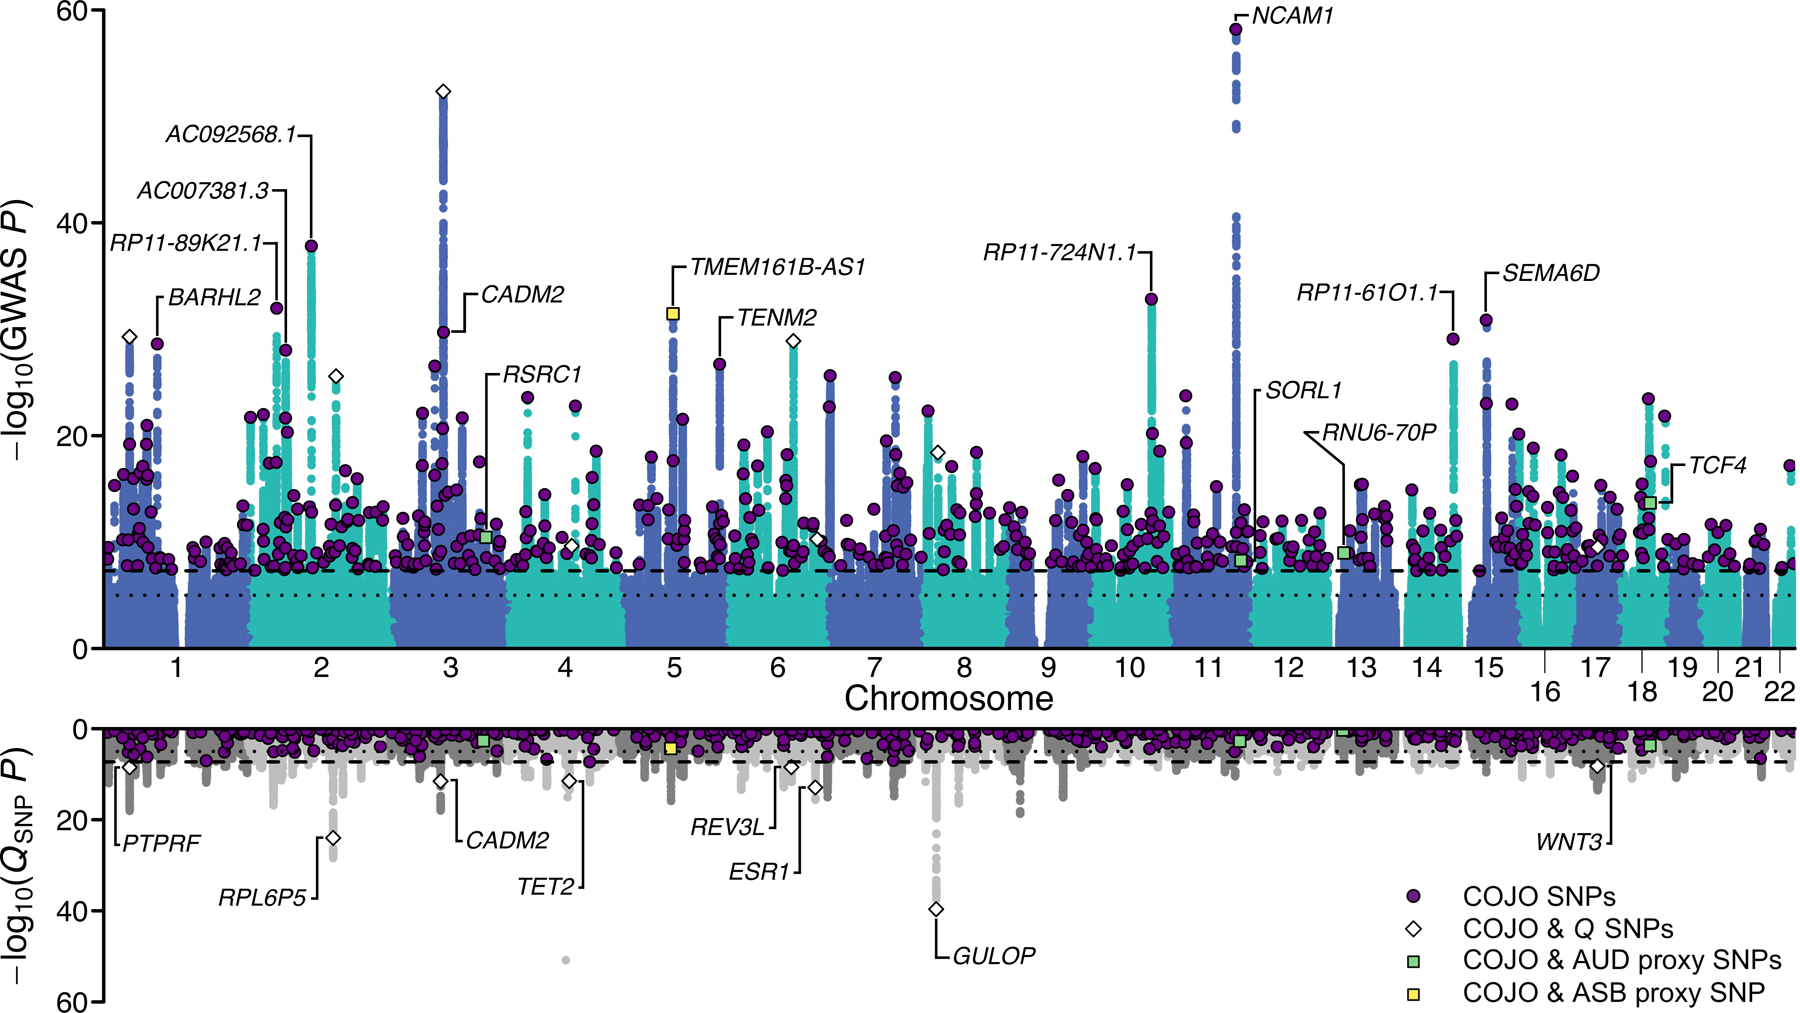
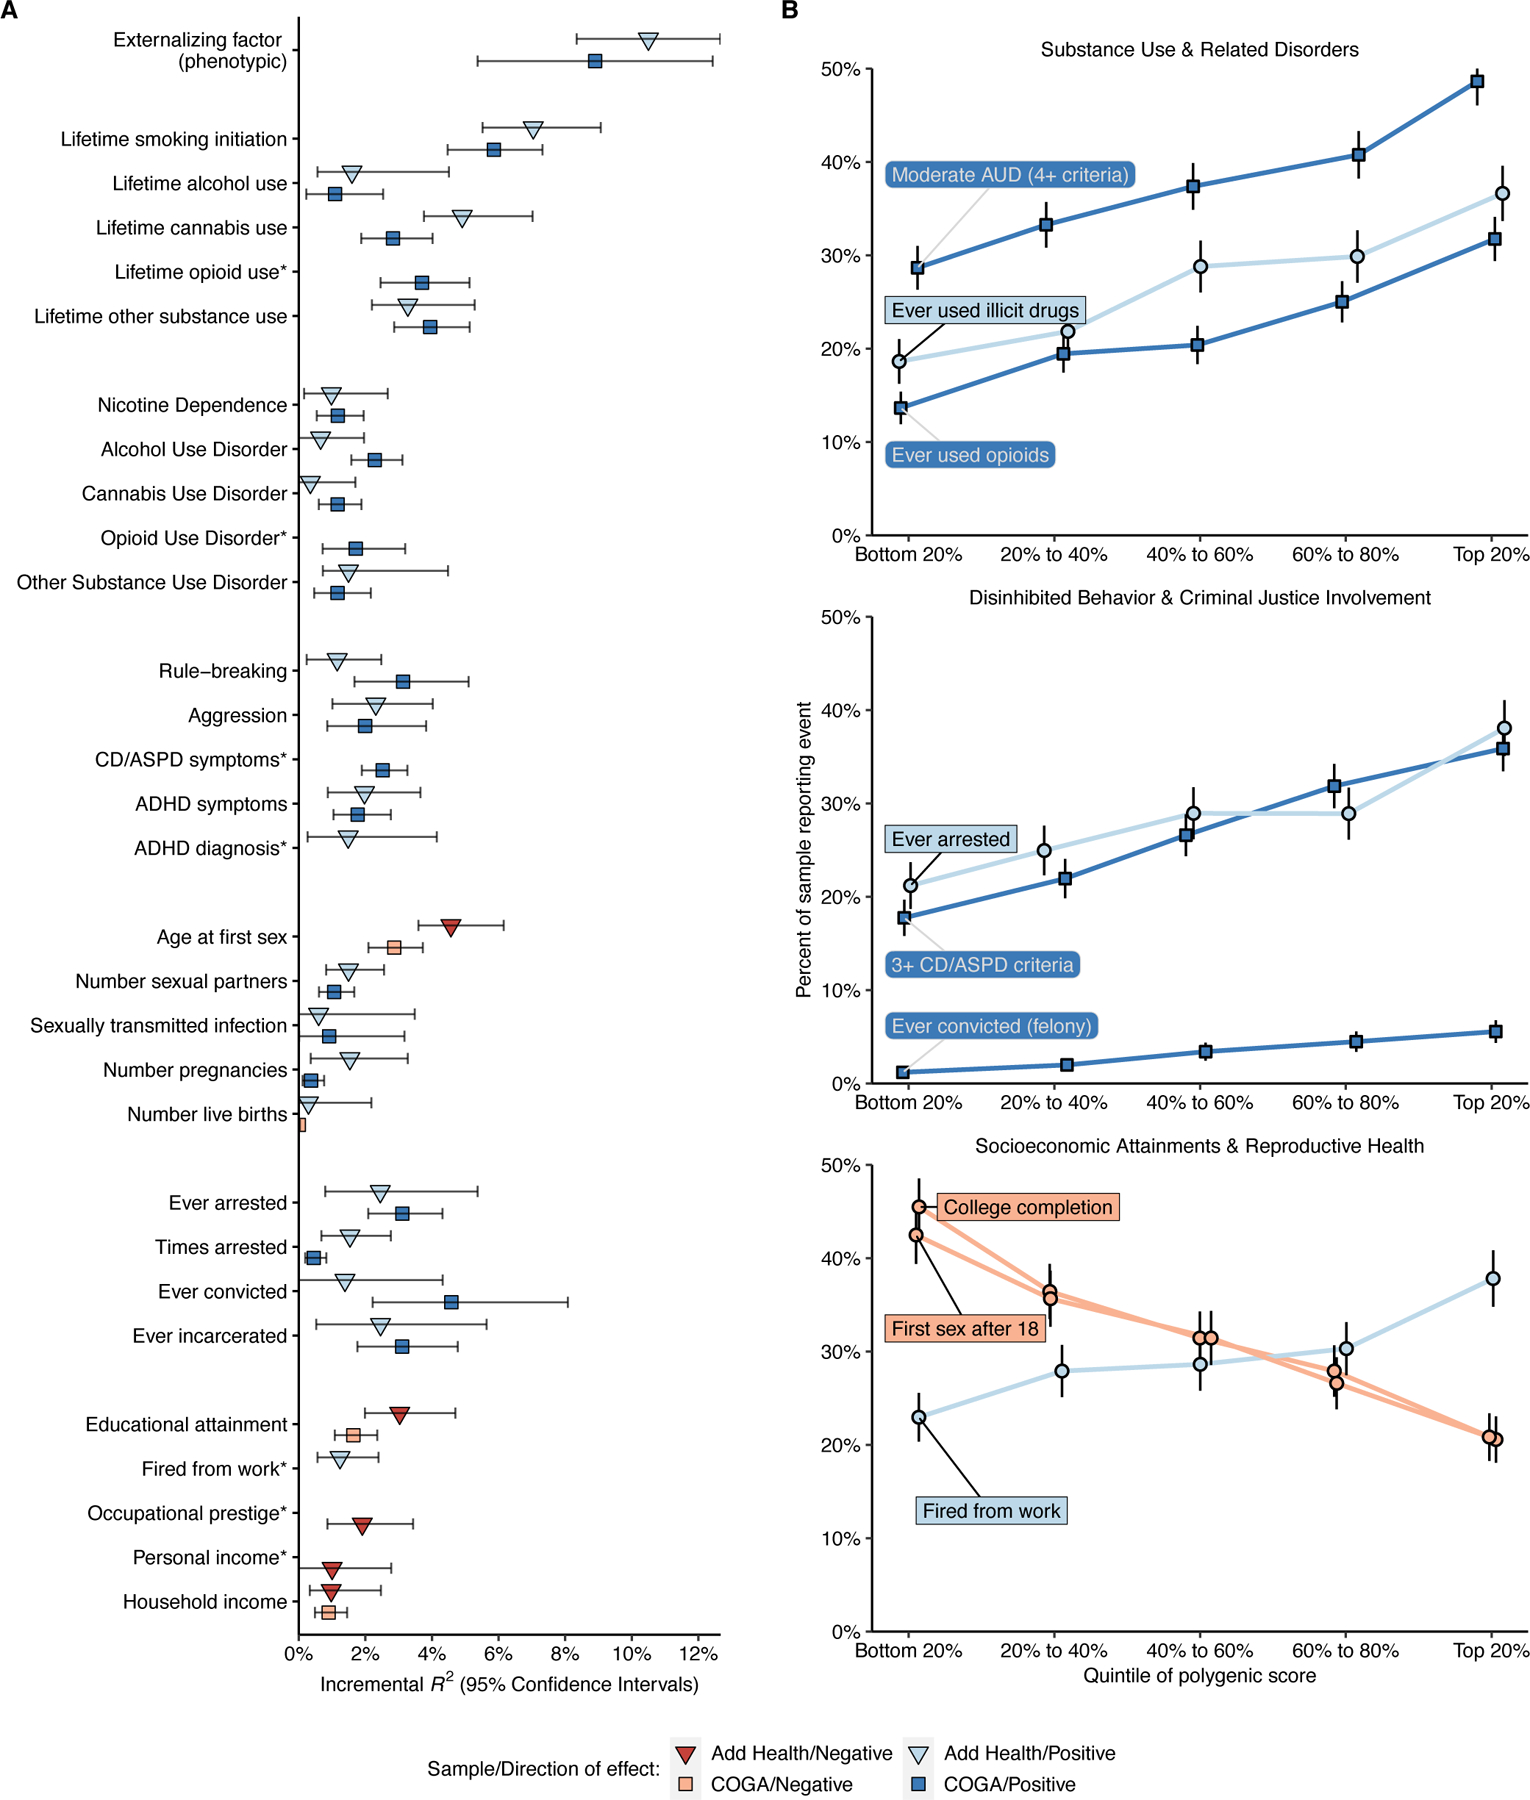
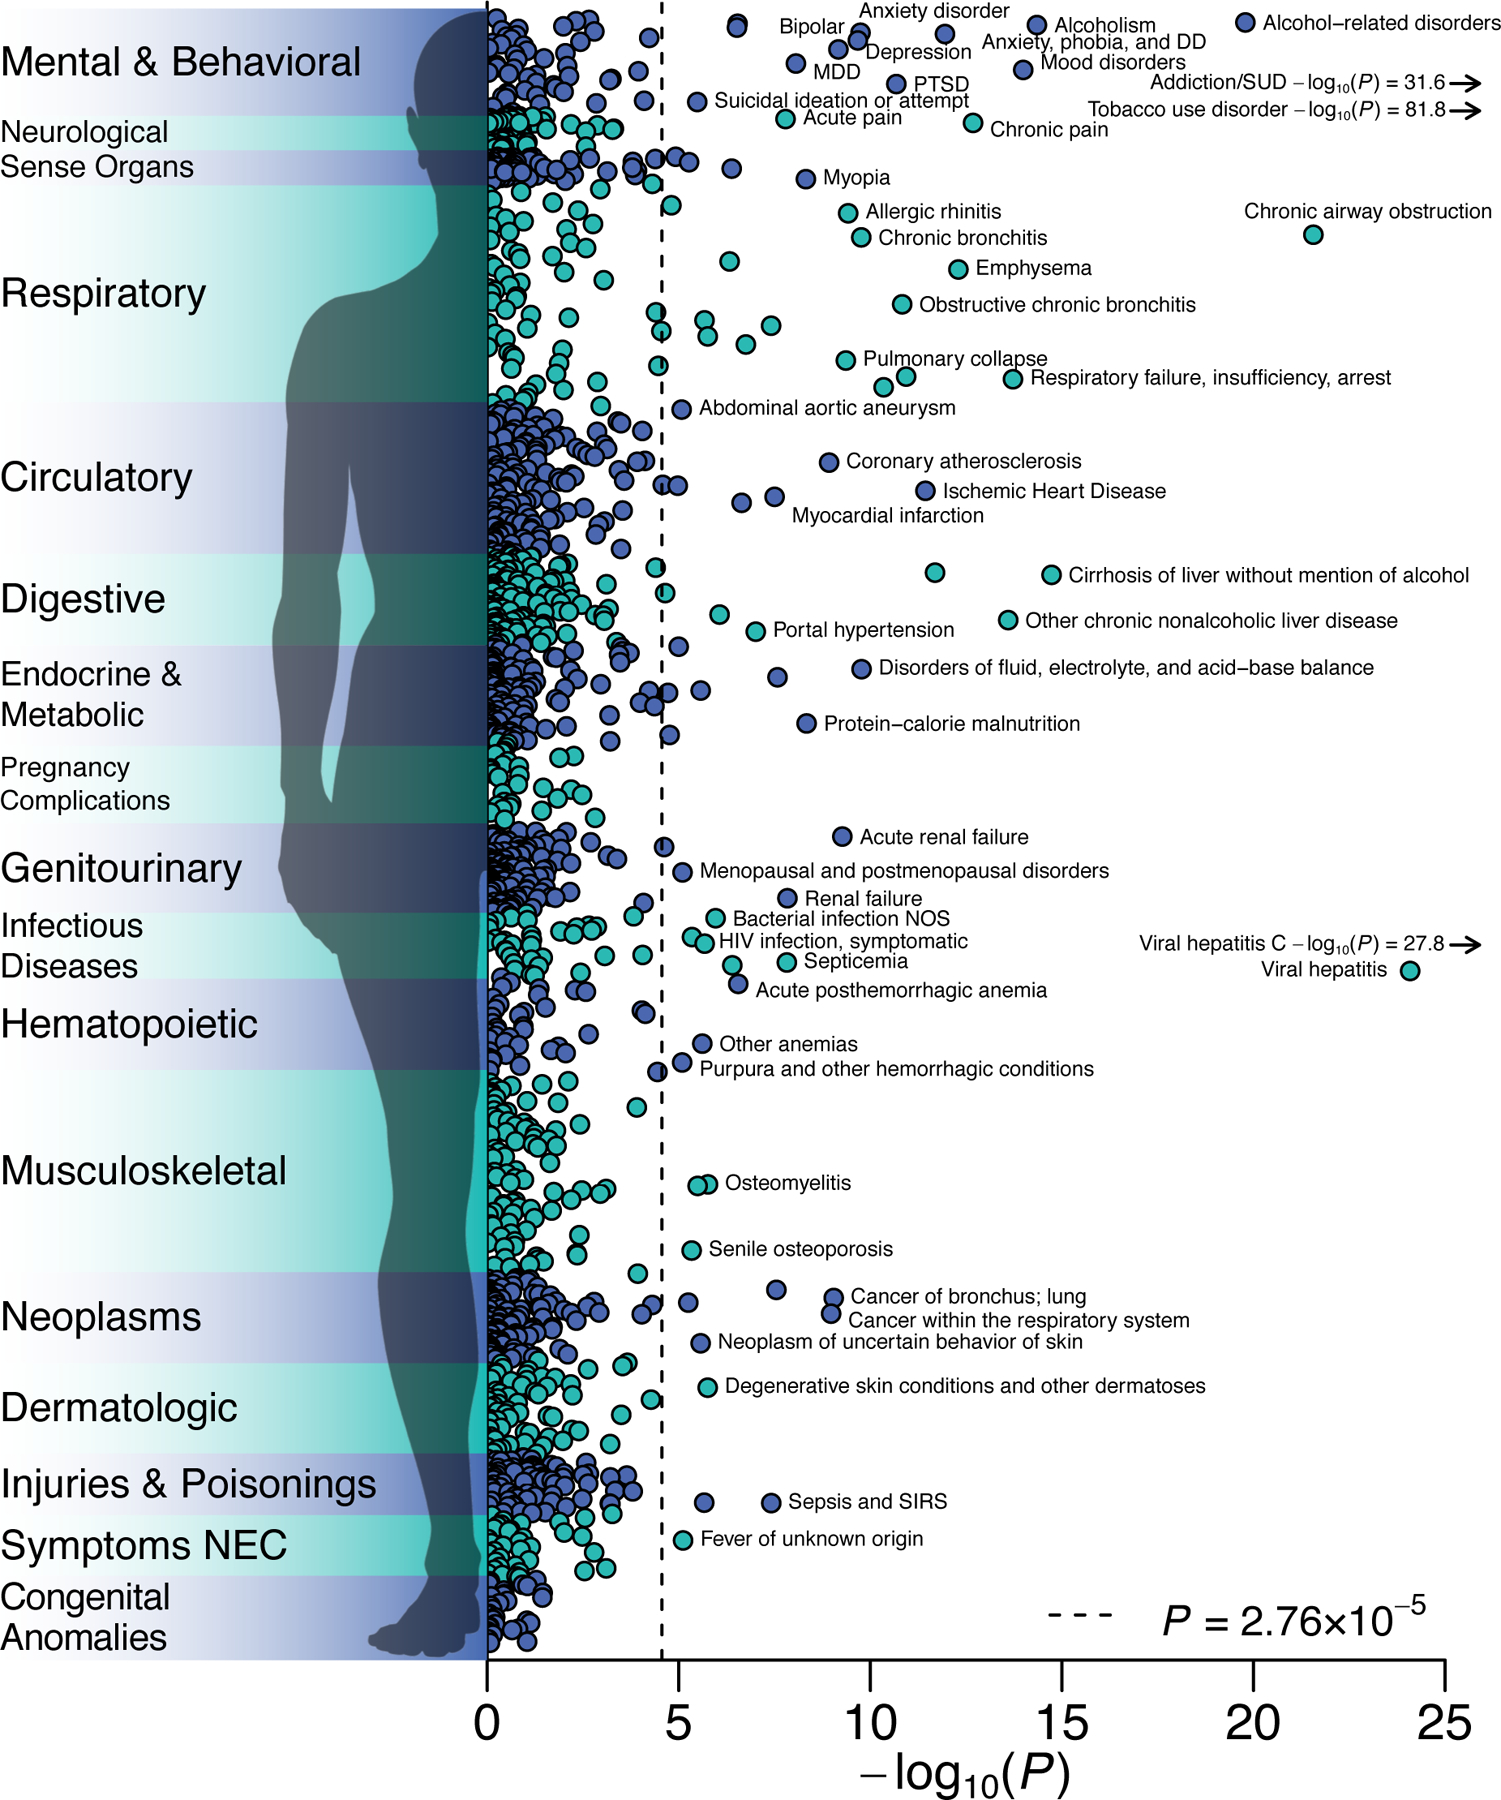
Behaviors and disorders related to self-regulation, such as substance use, antisocial behavior and attention-deficit/hyperactivity disorder, are collectively referred to as externalizing and have shared genetic liability. We applied a multivariate approach that leverages genetic correlations among externalizing traits for genome-wide association analyses. By pooling data from ~1.5 million people, our approach is statistically more powerful than single-trait analyses and identifies more than 500 genetic loci. The loci were enriched for genes expressed in the brain and related to nervous system development. A polygenic score constructed from our results predicts a range of behavioral and medical outcomes that were not part of genome-wide analyses, including traits that until now lacked well-performing polygenic scores, such as opioid use disorder, suicide, HIV infections, criminal convictions and unemployment. Our findings are consistent with the idea that persistent difficulties in self-regulation can be conceptualized as a neurodevelopmental trait with complex and far-reaching social and health correlates.


Conflict of interest statement

Competing interests Dr. Kranzler is a member of the American Society of Clinical Psychopharmacology’s Alcohol Clinical Trials Initiative, which was supported in the last three years by AbbVie, Alkermes, Ethypharm, Indivior, Lilly, Lundbeck, Otsuka, Pfizer, Arbor, and Amygdala Neurosciences. Drs. Kranzler and Gelernter are named as inventors on PCT patent application #15/878,640 entitled: “Genotype-guided dosing of opioid agonists,” filed January 24, 2018. Dr. Gelernter did paid editorial work for the journal Complex Psychiatry. Authors declare no other competing interests.

Figures

Extended Data Fig. 1
Extended Data Fig. 1. Genetic correlations with the genetic externalizing factor (EXT).
Dot plot of genetic correlations (rg) estimated with Genomic SEM between the genetic externalizing factor (EXT) with 91 other complex traits (Supplementary Information section 3). Error bars are 95% confidence intervals, calculated as 1.96×SE, centered on the rg estimate (omitted for Agreeableness). The estimates are also reported in Supplementary Table 8, together with the exact number of independent samples used to derive each estimate. This figure displays genetic correlations with personality measures based on GWAS summary statistics from the Genomics of Personality Consortium, while Figure 1 instead reports genetic correlations with personality measures based on more recent and substantially larger GWAS provided by 23andMe.
Extended Data Fig. 2
Extended Data Fig. 2. Quantile-quantile (Q-Q) plots of the externalizing GWAS and QSNP results.
The panels display Q-Q plots for (a) the externalizing GWAS (Neff = 1,492,085), and (b) SNP-level tests of heterogeneity (QSNP) with respect to the SNP-effects estimated in the externalizing GWAS (for more details see Supplementary Information section 3). The y-axis is the observed association P value on the −log10 scale (based on a two-sided Z-test in panel a, and based on a one-sided χ2 test scaled to 1 degree of freedom in panel b). The gray shaded areas represent 95% confidence intervals centered on the expected −log10(P) of the null distribution. The genomic inflation factors displayed here, λGC, is defined as the median χ2 association test statistic divided by the expected median of the χ2 distribution with 1 degree of freedom, and were calculated with 6,132,068 and 6,107,583 SNPs for (a) and (b), respectively. Although there is a noticeable early “lift-off”, the estimated LD Score regression intercepts of (a) 1.115 (SE = 0.019) and (b) 0.9556 (SE = 0.013) suggest that most of the inflation of the test statistics is attributable to polygenicity rather than bias from population stratification
Extended Data Fig. 3
Extended Data Fig. 3. Quantile-quantile (Q-Q) plots of the proxy-phenotypes analyses.
Panels (a–b) show −log10(P values from a two-sided Z-test) for linear regression of the 553 and 579 EXT SNPs (or such SNPs that could be proxied in case of missingness, r2 > 0.8) that were looked up in independent, second-stage GWAS samples on (1) antisocial behavior (N = 32,574) and (2) alcohol use disorder (N = 202,400), respectively (Supplementary Information section 4). Dashed line denotes experiment-wide significance at P < 0.05/553 and 0.05/579 for (1) and (2), respectively. Enrichment P value is the result of a one-sided test of joint enrichment with the non-parametric Mann-Whitney test against an empirical null distribution of 138,250 and 144,750 near-independent (r2 < 0.1) SNPs, matched on MAF, that were randomly selected from the GWAS on (1) and (2), respectively. Sign concordance is the proportion of looked-up SNPs with concordant direction of effect sizes across the externalizing GWAS and the second-stage GWAS, and the sign concordance P value is from a one-sided binomial tests of the sign concordance for the 579 SNPs (against the null hypothesis of 50% concordance that is expected by chance).
Extended Data Fig. 4
Extended Data Fig. 4. MAGMA gene-based association analysis.
Manhattan plot of the −log10(P from a one-sided Z-test) of 18,093 genes that were tested for association in the MAGMA (v.1.08) gene-based association analysis (Supplementary Information section 6). The 10 most significant genes are labeled with gene names. Red dashed line represents Bonferroni-significance, adjusted for the number of tested genes (one-sided P = 2.74×10⁻⁶). 928 genes were found to be significant, of which 244 have one or more genome-wide significant SNPs from the externalizing GWAS within their gene breakpoints. The results are also report in Supplementary Table 13.
Extended Data Fig. 5
Extended Data Fig. 5. MAGMA gene-property analysis.
Bar plot of the −log10(P from one-sided Z-tests) of the point estimate from a generalized least squares regression. The analysis identified that the externalizing GWAS is significantly enriched in brain and pituitary gland tissues (Supplementary Information section 6). Dashed line denotes Bonferroni-corrected significance, adjusted for testing 54 tissues (one-sided P < 9.26×10⁻⁴). 14 tissues were significantly associated with the externalizing GWAS, including 13 brain related tissues and the pituitary tissue. The results are also report in Supplementary Table 15.
Extended Data Fig. 6
Extended Data Fig. 6. MAGMA gene-property analysis of enrichment in brain tissues across 11 developmental stages (BrainSpan).
Bar plot of the −log10(P from one-sided Z-tests) of the point estimate from a generalized least squares regression. The analysis identified that the externalizing GWAS is significantly enriched during prenatal developmental stages (Supplementary Information section 6). Dashed line denotes Bonferroni-corrected significance, adjusted for testing 54 tissues (one-sided P < 9.26×10⁻⁴). The results are also report in Supplementary Table 16.
Extended Data Fig. 7
Extended Data Fig. 7. Gene overlap across multiple gene-association methods.
Venn diagram illustrating the overlap between (1) the nearest genes to the 579 jointly associated lead SNPs (denoted as the COJO EXT SNPs, see Supplementary Table 9), (2) the genes significant in the MAGMA gene-based analysis (Supplementary Table 13), (3) the genes significant in the H-MAGMA adult brain tissue analysis (Supplementary Table 17), and (4) the genes significant in the S-PrediXcan analysis (Supplementary Table 21). Across these four approaches, 34 genes were consistently implicated; these genes include CADM2, PACSIN3, ZIC4, MAPT, and GABRA2. Colored regions of this diagram correspond to the coloring shown in Supplementary Table 22, which lists all identified genes. No new statistical test was performed to generate this figure, and the statistical test used in each gene-based approach is reported in the notes of Supplementary Tables 9, 13, 17, and 21.
Extended Data Fig. 8
Extended Data Fig. 8. Externalizing systems map estimated with the Order Statistics Local Optimization Method (OSLOM) algorithm.
Representation of the externalizing network neighborhood estimated with PCNet as modular gene systems. In the top panel, circles represent distinct systems, with size indicating the number of genes belonging to each system (min 11 for “cilium organization”, and max 379 for the “externalizing systems map”). System color indicates the fraction of genes in each system that have been mapped to the externalizing phenotype by at least one of the four gene mapping methods (positional, MAGMA, H-MAGMA, and S-PrediXcan). Systems have been annotated with significantly enriched gene ontology terms. Systems without significant enrichment of biological pathways are labeled with a unique system ID (C454, C461, C453, C462), and may represent novel pathways. (i-vi) Visualization of genes within selected systems that have been mapped to the externalizing phenotype by one or more gene mapping methods, and their molecular interactions. In the bottom panel, the gene size is mapped to the number of methods in which the gene was found associated with externalizing (with the largest genes indicating the gene was identified by all 4 methods), and gene color(s) indicates which method(s) have mapped the gene.
Extended Data Fig. 9
Extended Data Fig. 9. Confirmatory factor analysis of phenotypic externalizing factor in Add Health and COGA.
Path diagram of confirmatory factor analysis (CFA) models in (top panel) Add Health (N = 15,107) and (bottom panel) COGA (N = 16,857) (Supplementary Information section 5). The reported model fit statistics and fit indices are degrees of freedom (df), comparative fit index (CFI), root mean square error (RMSEA), standardized root mean squared residual (SRMR). Standardized factor loadings presented as numbers on the paths.
Figure 1 |
Figure 1 |. Genetic correlations and structural equation modeling with Genomic SEM.
(A) The lower and upper triangles display pair-wise LD Score genetic correlations (rg) and their standard errors, respectively, among the final seven discovery phenotypes (Table 1), and the diagonal displays observed-scale SNP heritabilities (h2) (see Table 1 for standard errors). (B) Path diagram of the final revised common factor model estimated with Genomic SEM. The factor loadings were standardized, and standard errors are presented in parentheses. (C) Genetic correlations (rg) between the genetic externalizing factor (EXT, N = 1,492,085) and a subset of phenotypes selected to establish convergent and discriminant validity (Supplementary Table 8 reports all 91 estimated genetic correlations together with the exact number of independent samples used to derive each estimate), where blue and red bars represent positive and negative genetic correlations, respectively, using the same color scale as in panel A. Error bars represent 95% confidence intervals centered on the rg estimate, computed as 1.96 times the standard error. ADHD is attention deficit hyperactivity disorder (N = 53,293), ALCP is problematic alcohol use (N = 164,864), CANN is lifetime cannabis use (N = 186,875), EXT is externalizing, FSEX is reverse-coded age at first sex (N = 357,187), NSEX is number of sexual partners (N = 336,121), RISK is general risk tolerance (N = 426,379), and SMOK is lifetime smoking initiation (N = 1,251,809).
Figure 2 |
Figure 2 |. Multivariate genome-wide association analysis of EXT with Genomic SEM.
Scatterplot of −log10(P value for two-sided Z-test) for weighted least squares regression to estimate GWAS associations (top panel) and −log10(P value for one-sided χ2 test with 7–1 degrees of freedom) for QSNP tests of heterogeneity (bottom panel) for EXT. Purple dots represent the 579 EXT SNPs that are conditionally and jointly associated (COJO) at genome-wide significance (two-sided P < 5×10⁻⁸) (Supplementary Table 9). White diamonds represent eight of the 579 SNPs that also show significant QSNP heterogeneity. Four green and one yellow squares represent five out of the 579 SNPs that also were Bonferroni-significant proxy-phenotype associations with alcohol use disorder (AUD) and antisocial behavior (ASB), respectively (Supplementary Table 11–12). Gene names refer to the closest gene based on genomic location, displayed for a selection of the findings (Supplementary Table 9 reports the nearest gene for all 579 EXT SNPs).
Figure 3 |
Figure 3 |. Genome-wide EXT polygenic score associations with behavioral, psychiatric, and social outcomes in the independent Add Health (N = 5,107) and COGA (N = 7,594) datasets.
(A) Scatter plots illustrating the incremental proportion of variance (incremental R2, or ΔR2) explained by the genome-wide PRS-CS polygenic score. Light and dark hue indicates the Add Health and COGA cohort, respectively. Blue and red bars indicate positive and negative associations, respectively. The error bars represent 95% confidence intervals centered on ΔR2, computed as 1.96 times the standard error (estimated using percentile method bootstrapping over 1000 bootstrap samples). (B) Line charts illustrating the relative risks across quintiles of the polygenic score for eight (binary or dichotomized) illustrative outcomes: (1) meeting 4 or more criteria for alcohol use disorder (AUD), (2) lifetime use of an illicit substance other than cannabis, (3) lifetime opioid use, (4) ever being arrested, (5) meeting 3 or more criteria for conduct disorder (CD) or antisocial personality disorder (ASPD), (6) ever being convicted of a felony, (7) completing college, and (8) first sexual intercourse at the age of 18 or older. The error bars represent 95% confidence intervals centered on the per-quintile prevalence, computed as 1.96 times the analytical standard error.
Figure 4 |
Figure 4 |. Phenome-wide association study in the BioVU biorepository.
−log10 P values for two-sided Z-test of the log of the odds ratio for the genome-wide PRS-CS polygenic score for EXT with 1,335 medical outcomes, estimated with logistic regression in up to 66,915 patients, adjusted for sex, median age in the EHR data, and the first 10 genetic PCs. The dashed line is the Bonferroni-corrected significance threshold; adjusted for the number of tested medical conditions. 84 medical conditions were Bonferroni-significant, while 255 conditions were significant at a false discovery rate less than 0.05. The labels for some conditions were omitted. The complete results, including case-control counts, effect sizes, and standard errors, are reported in Supplementary Table 20.

References

    1. Richmond-Rakerd LS et al.Clustering of health, crime and social-welfare inequality in 4 million citizens from two nations. Nat. Hum. Behav 4, 255–264 (2020). - PMC - PubMed
    1. Case A & Deaton A Mortality and Morbidity in the 21st Century. Brookings Pap. Econ. Act 2017, 397–476 (2017). - PMC - PubMed
    1. Achenbach TM The classification of children’s psychiatric symptoms: A factor-analytic study. Psychol. Monogr. Gen. Appl 80, 1–37 (1966). - PubMed
    1. Hicks BM, Krueger RF, Iacono WG, McGue M & Patrick CJ Family transmission and heritability of externalizing disorders: a twin-family study. Arch. Gen. Psychiatry 61, 922–928 (2004). - PubMed
    1. Krueger RF et al.Etiologic connections among substance dependence, antisocial behavior and personality: Modeling the externalizing spectrum. J. Abnorm. Psychol 111, 411–424 (2002). - PubMed

Publication types

MeSH terms