. 2021 Aug 9:12:645666.
doi: 10.3389/fimmu.2021.645666. eCollection 2021.

Single-Cell RNA Sequencing of Peripheral Blood Reveals Immune Cell Signatures in Alzheimer's Disease

Affiliations

Single-Cell RNA Sequencing of Peripheral Blood Reveals Immune Cell Signatures in Alzheimer's Disease

Hui Xu et al. Front Immunol. .

Abstract

The peripheral immune system is thought to affect the pathology of the central nervous system in Alzheimer's disease (AD). However, current knowledge is inadequate for understanding the characteristics of peripheral immune cells in AD. This study aimed to explore the molecular basis of peripheral immune cells and the features of adaptive immune repertoire at a single cell level. We profiled 36,849 peripheral blood mononuclear cells from AD patients with amyloid-positive status and normal controls with amyloid-negative status by 5' single-cell transcriptome and immune repertoire sequencing using the cell ranger standard analysis procedure. We revealed five immune cell subsets: CD4+ T cells, CD8+ T cells, B cells, natural killer cells, and monocytes-macrophages cells, and disentangled the characteristic alterations of cell subset proportion and gene expression patterns in AD. Thirty-one cell type-specific key genes, comprising abundant human leukocyte antigen genes, and multiple immune-related pathways were identified by protein-protein interaction network and pathway enrichment analysis. We also found high-frequency amplification clonotypes in T and B cells and decreased diversity in T cells in AD. As clone amplification suggested the activation of an adaptive immune response against specific antigens, we speculated that the peripheral adaptive immune response, especially mediated by T cells, may have a role in the pathogenesis of AD. This finding may also contribute to further research regarding disease mechanism and the development of immune-related biomarkers or therapy.

Keywords: Alzheimer’s disease; B cell receptor; T cell receptor; adaptive immunity; single-cell RNA sequencing.


Conflict of interest statement

The authors declare that the research was conducted in the absence of any commercial or financial relationships that could be construed as a potential conflict of interest.

Figures
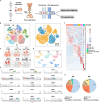
Figure 1
Figure 1
Single-cell gene expression analysis of peripheral blood mononuclear cells (PBMC) in Alzheimer’s disease (AD). (A) Experimental workflow for single-cell RNA analysis in the present study. (B) tSNE projection of 36,849 cells from PBMCs in the AD group and normal controls (NC). A total of five cell types were shown in (B), including CD4+ T cells (clusters 1, 2, 3, 4, 5, 6, 7 and 8), CD8+ T cells (clusters 9, 10, 11, 12, and 13); B cells (clusters 14, 15 and 16); Natural killer (NK) cells (clusters 17, 18 and 19) and monocyte-macrophages cells (clusters 20). (C, E) Canonical cell surface markers define CD4+ T cells, CD8+ T cells, natural killer (NK) cells, B cells, and monocyte-macrophage cells. (D) tSNE projections of cell transcriptome in each sample in this study. (F) Heatmap of the top 20 marker genes from each cluster. (G) Proportion of the five types of immune cells in the AD group and NC.
Figure 2
Figure 2
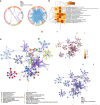
Functional and pathway enrichment analysis for B cell, CD4+ T cell, CD8+ T cell, natural killer (NK) cell, and monocyte-macrophage cell subsets. (A) The Circos plot shows how differentially expressed genes from the given immune cell subsets overlap. Each arc represents the identity of each gene list. Purple lines link the same gene that is shared by multiple gene lists. Blue lines link the different genes where they fall into the same ontology term (the term has to be statistically significantly enriched with a size no larger than 100). (B) The heatmap cells are colored based on the P-values of the enriched terms, and white cells indicate the lack of enrichment for that term. (C) Network of enriched terms; the nodes denote the enriched terms, and terms are connected by edges with a kappa statistic of >0.3. Enriched terms in the same cluster are denoted by the same color. In addition, the same enrichment network has its nodes colored based on the P-value and displayed as pies; different color sectors represent different subsets involved in the same enrichment pathway.
Figure 3
Figure 3
Protein–protein interaction (PPI) networks analysis. (A) PPI network of the differential expression genes between the Alzheimer’s disease (AD) group and normal controls (NC) from CD4+ T cell, CD8+ T cell, natural killer (NK) cell, B cell, and monocyte–macrophage cell subsets. The nodes are colored based on different subsets. (B) The top 40 genes identified though degree values in the PPI network. (C) The PPI subnetwork is constructed from the top 40 genes; three modules were identified by using the molecular complex detection (MCODE) algorithm, which comprised 31 key genes.
Figure 4
Figure 4
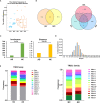
T cell receptor (TCR) repertoire analysis. (A) Box plot showing the top 10 high-frequency T cell clonotypes for each sample in this study. (B) Venn diagrams of the public T cell clonotypes within the Alzheimer’s disease (AD) group and normal controls (NC). (C) Averages of the InvSimpson index and Shannon–Weiner index of each sample are used to compare the TCR diversity of the AD group and NC. (D) Distribution of the CDR3 amino acid length of the TCR in the AD group and NC. (E) V and J genes usage frequency stacked histogram showing the distribution of common V and J genes of the TCR in the AD group and NC respectively.
Figure 5
Figure 5
B cell receptor (BCR) repertoire analysis. (A) Box plot showing the top 10 high-frequency B cell clonotypes for each sample in the present study. (B) Venn diagrams of the public B cell clonotypes within the Alzheimer’s disease (AD) and normal controls (NC). (C) Averages of the InvSimpson index and Shannon–Weiner index of each sample are used to compare the BCR diversity of the AD group and NC. (D) Distribution of the CDR3 amino acid length of the BCR in the AD group and NC. (E) V and J genes usage frequency stacked histogram showing the distribution of common V and J genes of the BCR in the AD group and NC respectively.

References

    1. Hardy J, Selkoe DJ. The Amyloid Hypothesis of Alzheimer's Disease: Progress and Problems on the Road to Therapeutics. Science (2002) 297:353–6. 10.1126/science.1072994 - DOI - PubMed
    1. Jonsson T, Stefansson H, Steinberg S, Jonsdottir I, Jonsson PV, Snaedal J, et al. . Variant of TREM2 Associated With the Risk of Alzheimer's Disease. N Engl J Med (2013) 368:107–16. 10.1056/NEJMoa1211103 - DOI - PMC - PubMed
    1. Hollingworth P, Harold D, Sims R, Gerrish A, Lambert JC, Carrasquillo MM, et al. . Common Variants at ABCA7, MS4A6A/MS4A4E, EPHA1, CD33 and CD2AP are Associated With Alzheimer's Disease. Nat Genet (2011) 43:429–35. 10.1038/ng.803 - DOI - PMC - PubMed
    1. Hong S, Beja-Glasser VF, Nfonoyim BM, Frouin A, Li S, Ramakrishnan S, et al. . Complement and Microglia Mediate Early Synapse Loss in Alzheimer Mouse Models. Science (2016) 352:712–6. 10.1126/science.aad8373 - DOI - PMC - PubMed
    1. Ziegler-Heitbrock L. The CD14+ CD16+ Blood Monocytes: Their Role in Infection and Inflammation. J Leukoc Biol (2007) 81:584–92. 10.1189/jlb.0806510 - DOI - PubMed

Publication types

Substances