. 2021 Aug 10:12:708770.
doi: 10.3389/fimmu.2021.708770. eCollection 2021.

Transcriptional Profiling and Functional Analysis of N1/N2 Neutrophils Reveal an Immunomodulatory Effect of S100A9-Blockade on the Pro-Inflammatory N1 Subpopulation

Affiliations

Transcriptional Profiling and Functional Analysis of N1/N2 Neutrophils Reveal an Immunomodulatory Effect of S100A9-Blockade on the Pro-Inflammatory N1 Subpopulation

Andreea C Mihaila et al. Front Immunol. .

Abstract

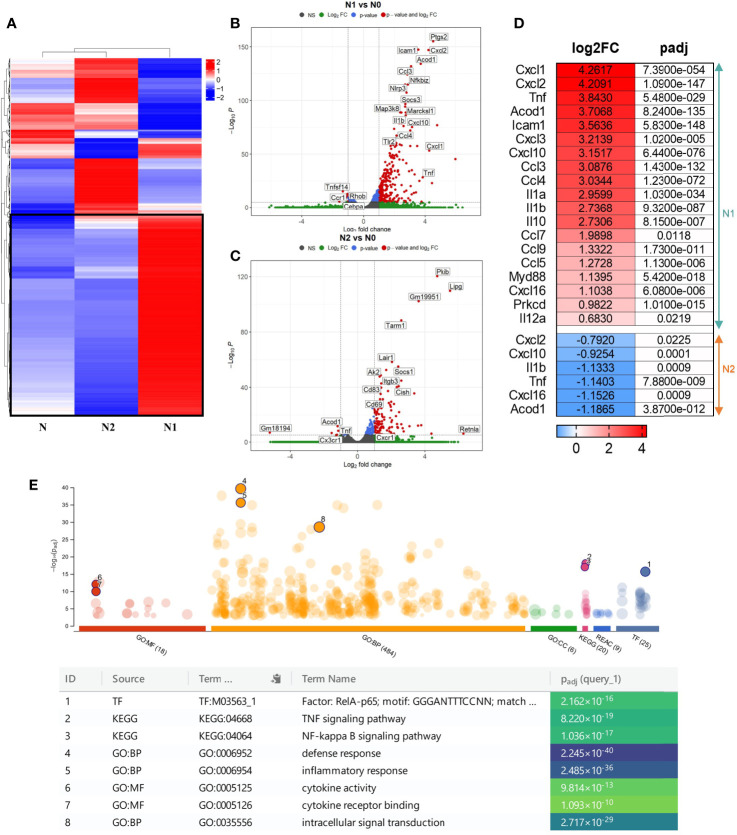
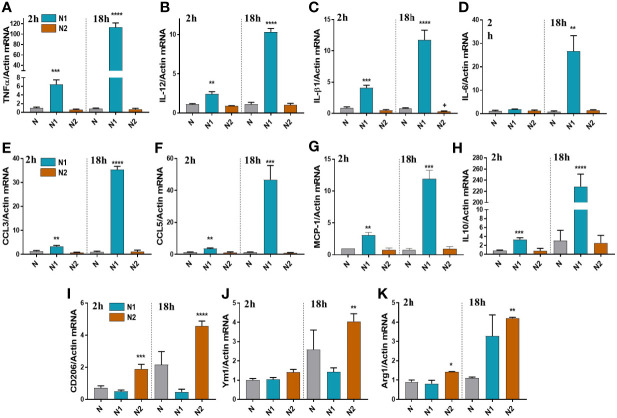
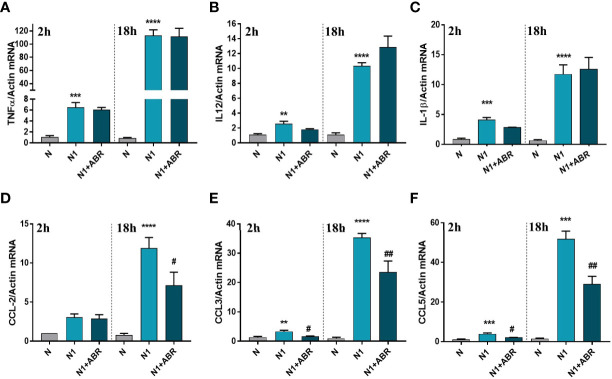
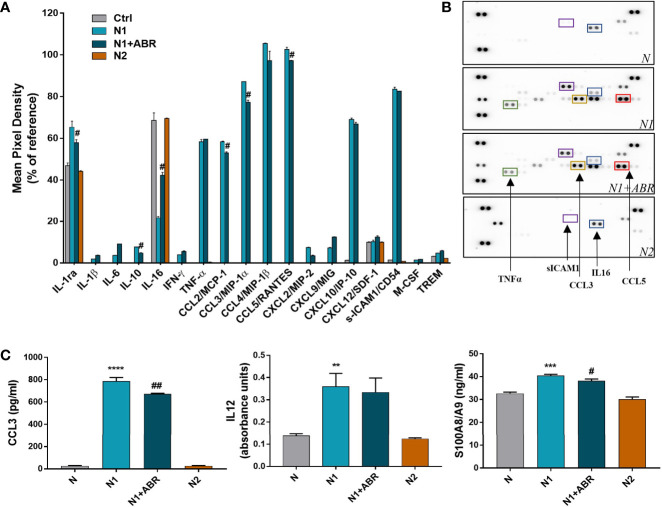
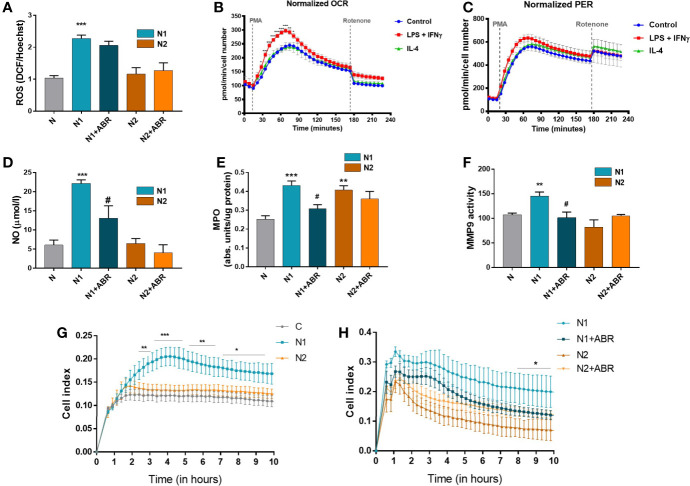
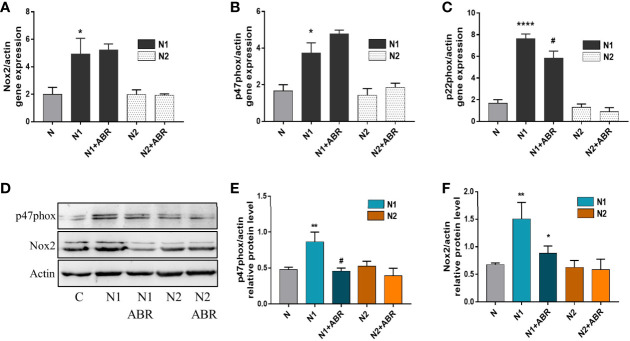
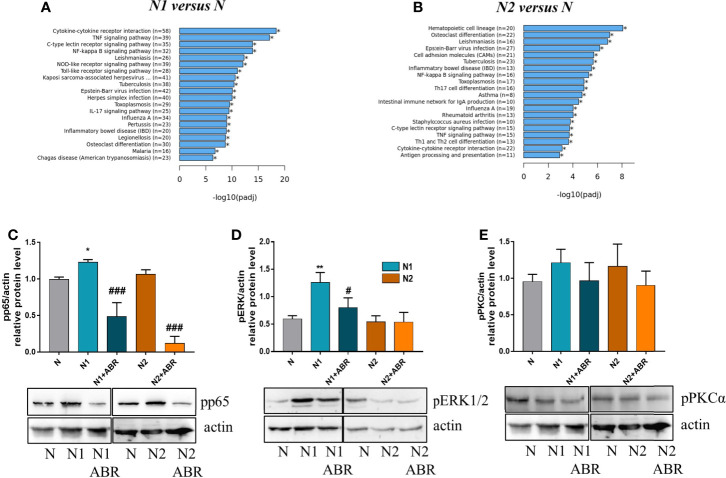
Neutrophils have been classically viewed as a homogenous population. Recently, neutrophils were phenotypically classified into pro-inflammatory N1 and anti-inflammatory N2 sub-populations, but the functional differences between the two subtypes are not completely understood. We aimed to investigate the phenotypic and functional differences between N1 and N2 neutrophils, and to identify the potential contribution of the S100A9 alarmin in neutrophil polarization. We describe distinct transcriptomic profiles and functional differences between N1 and N2 neutrophils. Compared to N2, the N1 neutrophils exhibited: i) higher levels of ROS and oxidative burst, ii) increased activity of MPO and MMP-9, and iii) enhanced chemotactic response. N1 neutrophils were also characterized by elevated expression of NADPH oxidase subunits, as well as activation of the signaling molecules ERK and the p65 subunit of NF-kB. Moreover, we found that the S100A9 alarmin promotes the chemotactic and enzymatic activity of N1 neutrophils. S100A9 inhibition with a specific small-molecule blocker, reduced CCL2, CCL3 and CCL5 chemokine expression and decreased MPO and MMP-9 activity, by interfering with the NF-kB signaling pathway. Together, these findings reveal that N1 neutrophils are pro-inflammatory effectors of the innate immune response. Pharmacological blockade of S100A9 dampens the function of the pro-inflammatory N1 phenotype, promoting the alarmin as a novel target for therapeutic intervention in inflammatory diseases.

Keywords: ABR-238901; N1 neutrophils; N2 neutrophils; RNA-Seq; S100A8/A9; neutrophil chemotaxis; neutrophil polarization.


Conflict of interest statement

The authors declare that the research was conducted in the absence of any commercial or financial relationships that could be construed as a potential conflict of interest.

Figures

Figure 1
Figure 1
Gene expression profiling of the different neutrophil subsets. (A) Hierarchical Clustering Heatmap analysis of N, N1, and N2 neutrophils. Hierarchical clustering analysis was conducted of log2(FPKM+1) of differential expression genes union within all comparison groups. The color coding indicates different levels of expression: red indicates genes with high expression, and blue indicates genes with low expression levels. A major cluster of DEGs up-regulated in N1 is highlighted in a black square. (B, C) Volcano plot of differential gene expression between N1/N2 and N cells. The red dots represent significantly up-regulated and down-regulated genes with – adjP < 0.05 and Log2FC > 1: 771 genes were up-regulated and 195 genes were down-regulated in N1 vs N neutrophils; 532 genes were up-regulated and 124 genes were down-regulated in N2 vs N cells. (D) Heatmap showing log2 Fold change and adjusted p-value for selected inflammatory cytokines and chemokines differentially expressed either in N1 (upper panel) or N2 neutrophils (lower panel). Red color indicates the up-regulated, and blue the down-regulated genes. (E) Manhattan plot illustrating the results of the enrichment analysis of the gene cluster of highly up-regulated genes in N1 compared with N and N2 neutrophils. The functional terms are grouped and color-coded by data sources, i.e., molecular function (MF) in red, biological processes (BP) in orange, cellular components (CC) in green, KEGG in pink and TRANSFAC in dark blue. Numbered terms are detailed below the plot with their respective adjP values.
Figure 2
Figure 2
Gene expression of inflammatory and anti-inflammatory markers in neutrophils polarized for 2 or 18h with LPS+IFNγ (N1) or IL-4 (N2). (A–G) qPCR for inflammatory markers: TNFα, IL-12, IL-1β, IL-6, CCL3, CCL5, MCP-1, in N1 and N2 compared to control neutrophils (N). (H–K) qPCR for anti-inflammatory markers: IL-10, CD206, Ym1 and Arg1, in N1, N2 and N. n = 5, *p < 0.05, **p < 0.01, ***p < 0.001, ****p < 0.0001 (N1 or N2 vs. N).
Figure 3
Figure 3
The effect of S100A9 blockade on gene expression of immune mediators (A–F) in neutrophils exposed to LPS+IFNγ (N1) or IL-4 (N2) in the presence of ABR-238901 (ABR). The treatment decreases significantly the gene expression of CCL2, CCL3 and CCL5 in N1 neutrophils at both 2h and 18h. n = 3; **p < 0.01, ***p < 0.001, ****p < 0.0001 (N1 vs N); #p < 0.05, ##p < 0.01 (N1+ABR vs N1).
Figure 4
Figure 4
Effects of S100A9 blockade on neutrophil mediators released in the conditioned media after 18h of culture. (A) Quantification of mediators present in the culture medium from N1, N1 treated with ABR-23901, and N2 neutrophils compared to control neutrophils (N), as detected by the Proteome Profiler mouse cytokine array. The culture medium was pooled from three experiments. Protein levels were normalized to references on each membrane. #p < 0.05 (N1+ABR versus N1 neutrophils). (B) Representative membranes incubated with the condition media from N, N1, N1+ABR and N2 neutrophils. (C) Measurement of CCL3, IL-12 and S100A8/A9 in the neutrophil s condition media by ELISA. The data represent mean ± SD from three experiments; **p < 0.01, ***p < 0.001, ****p < 0.0001 (N1 vs N); #p < 0.05; ##p < 0.01 (N1+ABR versus N1).
Figure 5
Figure 5
Functional analysis of neutrophil populations. The cells were treated for 18h with LPS + IFNγ (N1) or IL-4 (N2) in the presence or absence of ABR-238901 (ABR). (A) Quantification of intracellular ROS using the DCFDA assay. (B, C) Measurement of the neutrophil oxidative burst evaluated in response to phorbol 12-myristate 13-acetate (PMA): (B)the oxygen consumption rate (OCR) and (C) the glycolytic proton efflux rate (PER), calculated using extracellular acidification rate (ECAR) measurements. (D) Quantification of NO released in the conditioned medium of neutrophil subtypes. (E) evaluation of MPO enzymatic activity in the cell lysate of neutrophil populations. (F) Quantification of MMP-9 gelatinase activity assessed by SDS‐PAGE zymography in the condition media of neutrophils. (G, H) The chemotactic activity of neutrophil populations toward IL-8 evaluated using a CIM-plate 16 and the xCELLigence RTCA DP system. The cell index (CI), proportional to the number of transmigrated neutrophils, was measured as the cell electrical impedance every 15 min over 10h. Data are from four independent experiments; every experiment used pooled neutrophils from at least 5 mice. Data are shown as mean fold change to control ± SE (n = 4). Statistical significance is shown as *p < 0.05, **p < 0.01, ***p < 0.001, #p ≤ 0.05.
Figure 6
Figure 6
Gene and protein expression of NADPH oxidase subunits in the different neutrophil populations in the presence or absence of ABR-238901 (ABR). (A-C) Quantification of gene expression for NADPH oxidase subunits Nox2, p47phox and p22phox by qPCR. (D-F) Protein expression of NADPH oxidase subunits p47phox and Nox2 determined by Western blot. n = 3, *p < 0.05, **p < 0.01 ****p < 0.0001 (N1 versus control); #p<0.05 (N1 versus N1 + ABR).
Figure 7
Figure 7
Signaling pathways activated in neutrophils subtypes. (A, B) The top 20 signaling pathways revealed by the KEGG signaling pathway enrichment analysis in N1 and N2 compared with control neutrophils (N). (C-E) Analysis of the phosphorylation form of p65, ERK and PKC in neutrophil subsets. Cell lysate from control (N), or polarized neutrophils (N1 and N2) cultured for 18h in the presence or absence of ABR-238901 (ABR) was analyzed by Western blot; n = 3, *p < 0.05, **p < 0.01 (N1 vs N), #p < 0.05, ###p < 0.001 (N1 vs N1 + ABR).

References

    1. Kumar S, Dikshit M. Metabolic Insight of Neutrophils in Health and Disease. Front Immunol (2019) 10:2099. 10.3389/fimmu.2019.02099 - DOI - PMC - PubMed
    1. Hong CW. Current Understanding in Neutrophil Differentiation and Heterogeneity. Immune Netw (2017) 17(5):298–306. 10.4110/in.2017.17.5.298 - DOI - PMC - PubMed
    1. Silvestre-Roig C, Fridlender ZG, Glogauer M, Scapini P. Neutrophil Diversity in Health and Disease. Trends Immunol (2019) 40(7):565–83. 10.1016/j.it.2019.04.012 - DOI - PMC - PubMed
    1. Fridlender ZG, Sun J, Kim S, Kapoor V, Cheng G, Ling L, et al. . Polarization of Tumor-Associated Neutrophil Phenotype by TGF-β: “N1” Versus “N2” TAN. Cancer Cell (2009) 16(3):183–94. 10.1016/j.ccr.2009.06.017 - DOI - PMC - PubMed
    1. Denny MF, Yalavarthi S, Zhao W, Thacker SG, Anderson M, Sandy AR, et al. . A Distinct Subset of Proinflammatory Neutrophils Isolated From Patients With Systemic Lupus Erythematosus Induces Vascular Damage and Synthesizes Type I IFNs. J Immunol (2010) 184(6):3284–97. 10.4049/jimmunol.0902199 - DOI - PMC - PubMed

Publication types