A fresh look to the phenotype in mono-allelic likely pathogenic variants of the leptin and the leptin receptor gene
- PMID: 34448070
- PMCID: PMC8390564
- DOI: 10.1186/s40348-021-00119-7
A fresh look to the phenotype in mono-allelic likely pathogenic variants of the leptin and the leptin receptor gene
Abstract
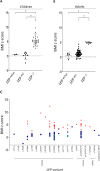
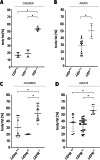
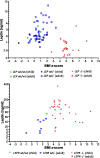
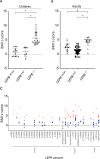
Leptin (LEP) and leptin receptor (LEPR) play a major role in energy homeostasis, metabolism, and reproductive function. While effects of biallelic likely pathogenic variants (-/-) on the phenotype are well characterized, effects of mono-allelic likely pathogenic variants (wt/-) in the LEP and LEPR gene on the phenotype compared to wild-type homozygosity (wt/wt) have not been systematically investigated. We identified in our systematic review 44 animal studies (15 on Lep, 29 on Lepr) and 39 studies in humans reporting on 130 mono-allelic likely pathogenic variant carriers with 20 distinct LEP variants and 108 heterozygous mono-allelic likely pathogenic variant carriers with 35 distinct LEPR variants. We found indications for a higher weight status in carriers of mono-allelic likely pathogenic variant in the leptin and in the leptin receptor gene compared to wt/wt, in both animal and human studies. In addition, animal studies showed higher body fat percentage in Lep and Lepr wt/- vs wt/wt. Animal studies provided indications for lower leptin levels in Lep wt/- vs. wt/wt and indications for higher leptin levels in Lepr wt/- vs wt/wt. Data on leptin levels in human studies was limited. Evidence for an impaired metabolism in mono-allelic likely pathogenic variants of the leptin and in leptin receptor gene was not conclusive (animal and human studies). Mono-allelic likely pathogenic variants in the leptin and in leptin receptor gene have phenotypic effects disposing to increased body weight and fat accumulation.
Keywords: Animal; Humans; LEP; LEPR; Phenotype.
© 2021. The Author(s).
Conflict of interest statement
The authors declare that they have no competing interests.
Figures


Similar articles
-
A National Multicenter Study of Leptin and Leptin Receptor Deficiency and Systematic Review.J Clin Endocrinol Metab. 2023 Aug 18;108(9):2371-2388. doi: 10.1210/clinem/dgad099. J Clin Endocrinol Metab. 2023. PMID: 36825860
-
Congenital leptin and leptin receptor deficiencies in nine new families: identification of six novel variants and review of literature.Mol Genet Genomics. 2023 Jul;298(4):919-929. doi: 10.1007/s00438-023-02025-1. Epub 2023 May 4. Mol Genet Genomics. 2023. PMID: 37140700 Review.
-
[Leptin promotes neointimal formation by stimulating vascular smooth muscle cell proliferation through leptin receptor].Zhonghua Xin Xue Guan Bing Za Zhi. 2009 Jul;37(7):634-8. Zhonghua Xin Xue Guan Bing Za Zhi. 2009. PMID: 19961738 Chinese.
-
Transcriptional Characterization of Porcine Leptin and Leptin Receptor Genes.PLoS One. 2013 Jun 18;8(6):e66398. doi: 10.1371/journal.pone.0066398. Print 2013. PLoS One. 2013. PMID: 23824082 Free PMC article.
-
Polymorphisms in Lep and Lepr Genes in Infants: Correlation with Serum Leptin Values in the First 6 Months of Life.J Am Coll Nutr. 2017 Aug;36(6):442-447. doi: 10.1080/07315724.2017.1318723. Epub 2017 Jun 19. J Am Coll Nutr. 2017. PMID: 28628399
Cited by
-
Population-enriched innate immune variants may identify candidate gene targets at the intersection of cancer and cardio-metabolic disease.Front Endocrinol (Lausanne). 2024 Mar 21;14:1286979. doi: 10.3389/fendo.2023.1286979. eCollection 2023. Front Endocrinol (Lausanne). 2024. PMID: 38577257 Free PMC article. Review.
-
Towards Precision Medicine in Obesity: Genetic Copy Number Variations Profiling Linked to Specific Metabolic Dysregulation Patterns.Int J Mol Sci. 2025 May 16;26(10):4782. doi: 10.3390/ijms26104782. Int J Mol Sci. 2025. PMID: 40429924 Free PMC article.
-
Lower Circulating Leptin Levels Are Related to Non-Alcoholic Fatty Liver Disease in Children With Obesity.Front Endocrinol (Lausanne). 2022 May 23;13:881982. doi: 10.3389/fendo.2022.881982. eCollection 2022. Front Endocrinol (Lausanne). 2022. PMID: 35677722 Free PMC article.
-
Aedes aegypti Shows Increased Susceptibility to Zika Virus via Both In Vitro and In Vivo Models of Type II Diabetes.Viruses. 2022 Mar 23;14(4):665. doi: 10.3390/v14040665. Viruses. 2022. PMID: 35458395 Free PMC article.
-
Oxidative Stress Markers and Na,K-ATPase Enzyme Kinetics Are Altered in the Cerebellum of Zucker Diabetic Fatty fa/fa Rats: A Comparison with Lean fa/+ and Wistar Rats.Biology (Basel). 2024 Sep 25;13(10):759. doi: 10.3390/biology13100759. Biology (Basel). 2024. PMID: 39452068 Free PMC article.
References
Publication types
Grants and funding
- FKZ 01GI1120A and 01GI1127/German Ministry of Education and Research (BMBF)
- FKZ 01GI1401/Competence Network Obesity
- LSSH1000.07/Hertha-Nathorff-Programm of the Medical Faculty of the University of Ulm
- KSKI, 002.1/Hertha-Nathorff-Programm of the Medical Faculty of the University of Ulm
- FI1700/7-1, Heisenberg Professorship/German Research Association
LinkOut - more resources
Full Text Sources
Miscellaneous

