. 2021 Aug 27:10:e64337.
doi: 10.7554/eLife.64337.

Sleeping at the switch

Affiliations

Sleeping at the switch

Maude Bouchard et al. Elife. .

Abstract

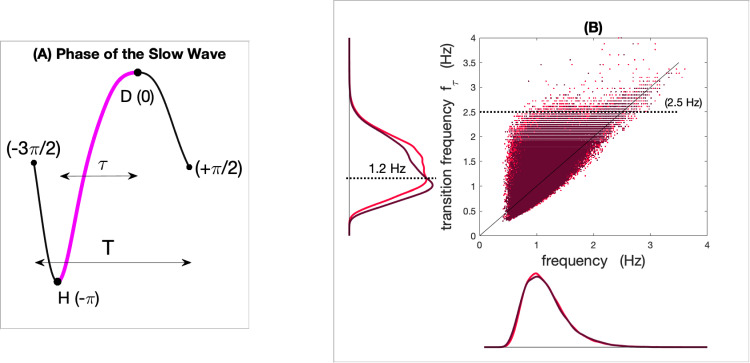
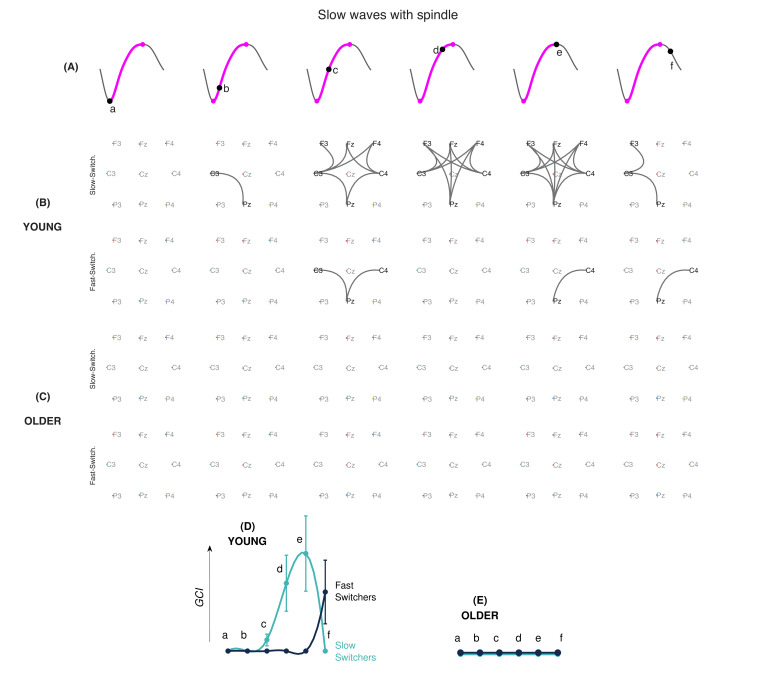
Sleep slow waves are studied for their role in brain plasticity, homeostatic regulation, and their changes during aging. Here, we address the possibility that two types of slow waves co-exist in humans. Thirty young and 29 older adults underwent a night of polysomnographic recordings. Using the transition frequency, slow waves with a slow transition (slow switchers) and those with a fast transition (fast switchers) were discovered. Slow switchers had a high electroencephalography (EEG) connectivity along their depolarization transition while fast switchers had a lower connectivity dynamics and dissipated faster during the night. Aging was associated with lower temporal dissipation of sleep pressure in slow and fast switchers and lower EEG connectivity at the microscale of the oscillations, suggesting a decreased flexibility in the connectivity network of older individuals. Our findings show that two different types of slow waves with possible distinct underlying functions coexist in the slow wave spectrum.

Keywords: EEG; aging; functional connectivity; human; neuroscience; sleep; slow waves.


Conflict of interest statement

MB, JL, PG, AL, JD, NG, JC No competing interests declared

Figures

Figure 1.
Figure 1.. Frequency and transition frequency of slow waves in young and older individuals.
Panel (A) represents the phase of a slow wave with the transition between the maximum negative phase (hyperpolarization (H)) and the maximum positive phase (depolarization (D)) in pink. Panel (B) represents a scatter plot of the exhaustive Fz inventory of the frequency (1T) and transition frequency (12τ) of each slow wave detected in N2 and N3 in young (light red) and older groups (dark red). The marginal distributions of the two frequencies show a similar distribution for the mean frequency, whereas the transition frequency shows distinct distributions with aging.
Figure 2.
Figure 2.. Transition frequency and the slow and fast switcher definition.
Panels (A) and (B) are normalized histograms of the transition frequencies (in pink) for young (A) and older subjects (B), for slow waves detected in N2 and N3 frontal derivations (average of F3, F4, and Fz). The fit of the distributions can be decomposed as a mixture of Gaussians: one Gaussian (cyan) accounts for slow switchers, and the other (dark blue) accounts for the fast switchers. The separation line at f* = 1,2 Hz stands for the intersection between the two Gaussian distributions. Panel (C) shows the Akaike Information Criterion for the increasing number of Gaussians in the mixture. The lower the criterion with a sparse decomposition, the better the mixture fit (parietal and central derivations are presented in Figure 2—figure supplement 2).
Figure 2—figure supplement 1.
Figure 2—figure supplement 1.. The transition frequency and its relationship with the slope and amplitude of slow waves.
The upper figure shows younger individuals while the lower shows older individuals. The panel (A) of the figures shows the distribution of the transition frequency defined as slope/(2×amp), slope and amp being the slope and the peak-to-peak amplitude, respectively. The dashed line in (A) is the crossing of the two Gaussians of the mixture at 1.2 Hz and defines the threshold that allows separating the slow switchers from the fast switchers. The graphics in panels (B) and (C) display the distribution of the slope and the amplitude. Both distributions are well fitted with a gamma and an exponential distribution, respectively, shown with thicker lines. The scatter plot of the panels (D) and (E) that display the slow switchers (light gray) and fast switchers (dark gray) with respect to the slope or the amplitude and the transition frequency. In (E), the slow waves (SWs) scatter inside a cone defined by the lower and higher peak-to-peak amplitudes. Although the lower side of the cone is related to the minimal value of the peak-to-peak amplitude as defined in the detector (75μV), the upper side of the cone indicates that the peak-to-peak amplitude is bounded and cannot exceed 433μV in the older individuals (this value is 515μV for the young participants).
Figure 2—figure supplement 2.
Figure 2—figure supplement 2.. Distribution of the transition frequency in central and parietal derivations.
Panels (A) and (B) are histograms of the transition frequencies (in pink) in the two groups (young and older) for the slow waves detected in central (A) and parietal (B) derivations. The fit of the distributions can be written as a sum of two Gaussians: one Gaussian (cyan) accounts for slow switchers and the other (dark blue) accounts for the fast switchers. The line in the middle (in Hz) stands for the intersection point (critical frequency) between the two Gaussian distributions. The last column stands for the Akaike Information Criterion graphs for the increasing number of Gaussians in the mixture. The lower the criterion, the better the mixture fit.
Figure 3.
Figure 3.. Slow and fast switcher slow waves.
(A) Slow wave densities in clusters of frontal (F3, Fz, F4), central (C3, Cz, C4), and parietal (P3, Pz, P4) derivations in young and older individuals. Slow waves were detected in N2 and N3. (B and C) The distribution of probabilities of slow waves being slow (cyan) or fast switchers (dark blue) in younger and older individuals, respectively, with each curve representing one participant. We can observe the two distinct modes of sleep slow waves based on their transition frequency in each derivation. (D) Age-related differences in the probability of producing a slow switcher when generating a slow wave. Significant age differences in (A) and (D) were calculated using t-tests (***p<0.0001).
Figure 3—figure supplement 1.
Figure 3—figure supplement 1.. Slow and fast switcher slow waves with and without sleep spindles.
This figure shows the histograms of slow and fast switchers based on their transition frequency for the slow waves detected in all derivations ‘without spindles’ and ‘with spindles’ in young (left) and older (right) individuals. The curves show the distribution of the probabilities to make a slow switcher (cyan) vs a fast switcher (blue).
Figure 4.
Figure 4.. Slow and fast switchers decline across sleep cycles.
For each participant in each group (Young individuals in Panel A and older individuals in Panel B), we clustered slow switchers and fast switchers with respect to the cycle during which they occurred. Considering slow and fast switchers separately, the percentage of switchers in each cycle related to the total number of switchers across the whole night is displayed. The curves are spline-interpolation of the overall average in each group.
Figure 5.
Figure 5.. EEG connectivity signature of slow and fast switchers without sleep spindles in young and older individuals.
(A) Illustration of the six different phases along the depolarization transition (a, b, c, d, and e) and the hyperpolarization transition of the slow wave (f). (B and C) EEG connectivity graphs using phase-locked connectivity (phase lag index, PLI) metrics and statistically assessed by non-parametric statistics for the slow (upper level) and fast (lower level) switchers without sleep spindles, in young (B) and older (C) individuals. (D and E) Global connectivity index (GCI) values at each phase of the slow wave, obtained by the summation of the PLI values across the significant electrode pairs. The GCI thus shows the weight of significant links obtained through non-parametric analyses. Slow switchers are represented in cyan, whereas the fast switchers are represented in dark blue. Graphs have a common scale and can therefore be compared.
Figure 6.
Figure 6.. EEG connectivity signature of slow and fast switchers with sleep spindles in young and older individuals.
(A) Illustration of the six different phases along the depolarization transition (a, b, c, d, and e) and the hyperpolarization transition of the slow wave (f). (B and C) EEG connectivity graphs, using phase-locked connectivity (phase lag index, PLI) metrics and statistically assessed by non-parametric statistics for the slow (upper level) and fast (lower level) switchers with sleep spindles, in young (B) and older (C) individuals. (D and E) Global connectivity index (GCI) values at each phase of the slow wave, obtained by the summation of the PLI values across the significant electrode pairs. Slow switchers are represented in cyan, whereas the fast switchers are represented in dark blue. Graphs have a common scale and can therefore be compared.
Author response image 1.

References

    1. Achermann P, Borbély AA. Low-frequency (< 1 Hz) oscillations in the human sleep electroencephalogram. Neuroscience. 1997;81:213–222. doi: 10.1016/s0306-4522(97)00186-3. - DOI - PubMed
    1. Baker AP, Brookes MJ, Rezek IA, Smith SM, Behrens T, Probert Smith PJ, Woolrich M. Fast transient networks in spontaneous human brain activity. eLife. 2014;3:e01867. doi: 10.7554/eLife.01867. - DOI - PMC - PubMed
    1. Beck AT, Epstein N, Brown G, Steer RA. An inventory for measuring clinical anxiety: psychometric properties. Journal of Consulting and Clinical Psychology. 1988a;56:893–897. doi: 10.1037/0022-006X.56.6.893. - DOI - PubMed
    1. Beck AT, Steer RA, Carbin MG. Psychometric properties of the beck depression inventory: twenty-five years of evaluation. Clinical Psychology Review. 1988b;8:77–100. doi: 10.1016/0272-7358(88)90050-5. - DOI
    1. Bernardi G, Siclari F, Handjaras G, Riedner BA, Tononi G. Local and widespread slow waves in stable NREM sleep: evidence for distinct regulation mechanisms. Frontiers in Human Neuroscience. 2018;12:1–13. doi: 10.3389/fnhum.2018.00248. - DOI - PMC - PubMed

Publication types

Grants and funding