. 2021 Nov 1;321(5):F559-F571.
doi: 10.1152/ajprenal.00134.2021. Epub 2021 Aug 27.

Angiotensin II biphasically regulates cell differentiation in human iPSC-derived kidney organoids

Affiliations

Angiotensin II biphasically regulates cell differentiation in human iPSC-derived kidney organoids

Stacy M Yanofsky et al. Am J Physiol Renal Physiol. .

Abstract

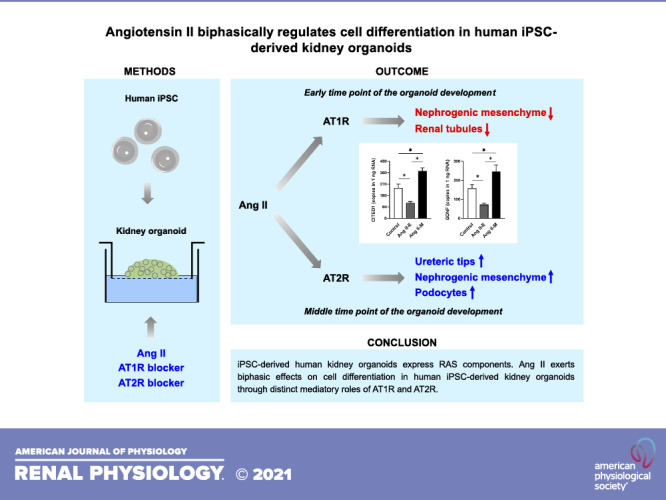
Human kidney organoid technology holds promise for novel kidney disease treatment strategies and utility in pharmacological and basic science. Given the crucial roles of the intrarenal renin-angiotensin system (RAS) and angiotensin II (ANG II) in the progression of kidney development and injury, we investigated the expression of RAS components and effects of ANG II on cell differentiation in human kidney organoids. Human induced pluripotent stem cell-derived kidney organoids were induced using a modified 18-day Takasato protocol. Gene expression analysis by digital PCR and immunostaining demonstrated the formation of renal compartments and expression of RAS components. The ANG II type 1 receptor (AT1R) was strongly expressed in the early phase of organoid development (around day 0), whereas ANG II type 2 receptor (AT2R) expression levels peaked on day 5. Thus, the organoids were treated with 100 nM ANG II in the early phase on days 0-5 (ANG II-E) or during the middle phase on days 5-10 (ANG II-M). ANG II-E was observed to decrease levels of marker genes for renal tubules and proximal tubules, and the downregulation of renal tubules was inhibited by an AT1R antagonist. In contrast, ANG II-M increased levels of markers for podocytes, the ureteric tip, and the nephrogenic mesenchyme, and an AT2R blocker attenuated the ANG II-M-induced augmentation of podocyte formation. These findings demonstrate RAS expression and ANG II exertion of biphasic effects on cell differentiation through distinct mediatory roles of AT1R and AT2R, providing a novel strategy to establish and further characterize the developmental potential of human induced pluripotent stem cell-derived kidney organoids.NEW & NOTEWORTHY This study demonstrates angiotensin II exertion of biphasic effects on cell differentiation through distinct mediatory roles of angiotensin II type 1 receptor and type 2 receptor in human induced pluripotent stem cell-derived kidney organoids, providing a novel strategy to establish and further characterize the developmental potential of the human kidney organoids.

Keywords: angiotensin II; angiotensinogen; induced pluripotent stem cells; kidney organoids.


Conflict of interest statement

No conflicts of interest, financial or otherwise, are declared by the authors.

Figures

None
Graphical abstract
Figure 1.
Figure 1.
Continued
Figure 1.
Figure 1.
Continued
Figure 2.
Figure 2.
Expression of renin-angiotensin system (RAS) components in kidney organoids. A: mRNA copy numbers of RAS components in organoids were determined by droplet digital PCR (day 18, n = 4–6 organoids). B: ANG II type 1 receptor (AT1R) and ANG II type 2 receptor (AT2R) expression levels during the development of organoids (n = 5). Data are expressed as means ± SE. *Significant difference compared with each level on day 0 and †significant difference in AT2R mRNA expression compared with AT1R expression at each timepoint (P < 0.05 by one-way ANOVA followed by a post hoc Bonferroni/Dunn’s multiple comparison test). ACE, angiotensin-converting enzyme; AGT, angiotensinogen.
Figure 3.
Figure 3.
Angiotensinogen (AGT) regulation in kidney organoids. A: immunological staining of AGT (red) and Lotus tetragonolobus agglutinin (LTA; green) in a section of organoid on day 18. B: temporal changes in histone deacetylase 9 (HDAC9) and AGT mRNA copy numbers during the development of organoids (n = 5 organoids). C: effects of different doses of CHIR99021 (CHIR) on HDAC9 and AGT mRNA copy numbers in organoids on day 18 (n = 4). *Significant difference compared with the level of each control (day 0 in C and 0 μM CHIR in D) (P < 0.05 by one-way ANOVA followed by a post hoc Bonferroni/Dunn’s multiple comparison test). D: AGT expression in organoids that received TMP269, an HDAC9 inhibitor (n = 3). Data are expressed as means ± SE. *Significant difference compared with the control group (P < 0.05 by Welch’s t test).
Figure 4.
Figure 4.
Effects of ANG II on cell differentiation in kidney organoids. A–F: after treatments of kidney organoids with 100 nM ANG II in the early phase (ANG II-E) or during the middle phase (ANG II-M) for 5 days, mRNA copy numbers of marker genes of cell differentiation were measured by droplet digital PCR (n = 5–7 organoids). G: in addition, organoids received ANG II-E or ANG II-M treatments in the presence of an ANG II type 1 antagonist [RNH-6270 (RNH)] or an ANG II type 2 receptor antagonist [PD123319 (PD)] (n = 4 to 5). Glu/Asp-rich carboxy-terminal domain 1 (CITED1, a marker of noninduced nephrogenic mesenchyme), glial cell line-derived neurotrophic factor (GDNF; nephrogenic mesenchyme), LIM homeobox 1 (LHX1; early nephron), ETS variant transcription factor (ETV4; ureteric tip), very-low-density lipoprotein receptor (VLDLR; ureteric tip), cadherin 16 (CDH16; proximal tubule), hepatocyte nuclear factor-1β (HNF1B; proximal tubule), cubilin (CUBN; proximal tubule), solute carrier family 12 member 1 (SLC12A1; thick ascending limb and distal tubule), v-maf avian musculoaponeurotic fibrosarcoma oncogene homolog B (MAFB; podocyte), podocalyxin (PODXL; podocyte), and platelet and endothelial cell adhesion molecule-1 (PECAM; vasculature) levels were evaluated. Data are expressed as means ± SE. *Significant difference among groups (P < 0.05 by one-way ANOVA followed by a post hoc Bonferroni/Dunn’s multiple comparison test). Actual P values in the ANOVA were as follows: CITED1, <0.0001; GDFN, 0.0002; LHX1, 0.0036; ETV4, <0.0001; VLDLR, 0.004; CDH16 (in D), 0.004; HNF1B, 0.0035; CUBN, 0.0672; SLC12A1, 0.0108; MAFB, <0.0001; PODXL, <0.0001; CDH16 (in G): 0.004, <0.0001; and MAFB (in G), 0.002. H: representative whole mount images (objective, ×10) of E-cadherin (ECAD) and Wilms tumor-1 (WT-1) staining in organoids.
Figure 4.
Figure 4.
Effects of ANG II on cell differentiation in kidney organoids. A–F: after treatments of kidney organoids with 100 nM ANG II in the early phase (ANG II-E) or during the middle phase (ANG II-M) for 5 days, mRNA copy numbers of marker genes of cell differentiation were measured by droplet digital PCR (n = 5–7 organoids). G: in addition, organoids received ANG II-E or ANG II-M treatments in the presence of an ANG II type 1 antagonist [RNH-6270 (RNH)] or an ANG II type 2 receptor antagonist [PD123319 (PD)] (n = 4 to 5). Glu/Asp-rich carboxy-terminal domain 1 (CITED1, a marker of noninduced nephrogenic mesenchyme), glial cell line-derived neurotrophic factor (GDNF; nephrogenic mesenchyme), LIM homeobox 1 (LHX1; early nephron), ETS variant transcription factor (ETV4; ureteric tip), very-low-density lipoprotein receptor (VLDLR; ureteric tip), cadherin 16 (CDH16; proximal tubule), hepatocyte nuclear factor-1β (HNF1B; proximal tubule), cubilin (CUBN; proximal tubule), solute carrier family 12 member 1 (SLC12A1; thick ascending limb and distal tubule), v-maf avian musculoaponeurotic fibrosarcoma oncogene homolog B (MAFB; podocyte), podocalyxin (PODXL; podocyte), and platelet and endothelial cell adhesion molecule-1 (PECAM; vasculature) levels were evaluated. Data are expressed as means ± SE. *Significant difference among groups (P < 0.05 by one-way ANOVA followed by a post hoc Bonferroni/Dunn’s multiple comparison test). Actual P values in the ANOVA were as follows: CITED1, <0.0001; GDFN, 0.0002; LHX1, 0.0036; ETV4, <0.0001; VLDLR, 0.004; CDH16 (in D), 0.004; HNF1B, 0.0035; CUBN, 0.0672; SLC12A1, 0.0108; MAFB, <0.0001; PODXL, <0.0001; CDH16 (in G): 0.004, <0.0001; and MAFB (in G), 0.002. H: representative whole mount images (objective, ×10) of E-cadherin (ECAD) and Wilms tumor-1 (WT-1) staining in organoids.

References

    1. Perlman RL. Mouse models of human disease: an evolutionary perspective. Evol Med Public Health 2016: 170–176, 2016. doi:10.1093/emph/eow014. - DOI - PMC - PubMed
    1. Justice MJ, Dhillon P. Using the mouse to model human disease: increasing validity and reproducibility. Dis Model Mech 9: 101–103, 2016. doi:10.1242/dmm.024547. - DOI - PMC - PubMed
    1. Almeqdadi M, Mana MD, Roper J, Yilmaz OH. Gut organoids: mini-tissues in culture to study intestinal physiology and disease. Am J Physiol Cell Physiol 317: C405–C419, 2019. doi:10.1152/ajpcell.00300.2017. - DOI - PMC - PubMed
    1. Morizane R, Bonventre JV. Kidney organoids: a translational journey. Trends Mol Med 23: 246–263, 2017. doi:10.1016/j.molmed.2017.01.001. - DOI - PMC - PubMed
    1. Koning M, van den Berg CW, Rabelink TJ. Stem cell-derived kidney organoids: engineering the vasculature. Cell Mol Life Sci 77: 2257–2273, 2020. doi:10.1007/s00018-019-03401-0. - DOI - PMC - PubMed

Publication types

MeSH terms