

Unusually High Risks of COVID-19 Mortality with Age-Related Comorbidities: An Adjusted Meta-Analysis Method to Improve the Risk Assessment of Mortality Using the Comorbid Mortality Data
- PMID: 34449622
- PMCID: PMC8395741
- DOI: 10.3390/idr13030065
Unusually High Risks of COVID-19 Mortality with Age-Related Comorbidities: An Adjusted Meta-Analysis Method to Improve the Risk Assessment of Mortality Using the Comorbid Mortality Data
Abstract
Background: The pandemic of Coronavirus Disease 2019 (COVID-19) has been a threat to global health. In the US, the Centers for Disease Control and Prevention (CDC) has listed 12 comorbidities within the first tier that increase with the risk of severe illness from COVID-19, including the comorbidities that are common with increasing age (referred to as age-related comorbidities) and other comorbidities. However, the current method compares a population with and without a particular disease (or disorder), which may result in a bias in the results. Thus, comorbidity risks of COVID-19 mortality may be underestimated.
Objective: To re-evaluate the mortality data from the US and estimate the odds ratios of death by major comorbidities with COVID-19, we incorporated the control population with no comorbidity reported and assessed the risk of COVID-19 mortality with a comorbidity.
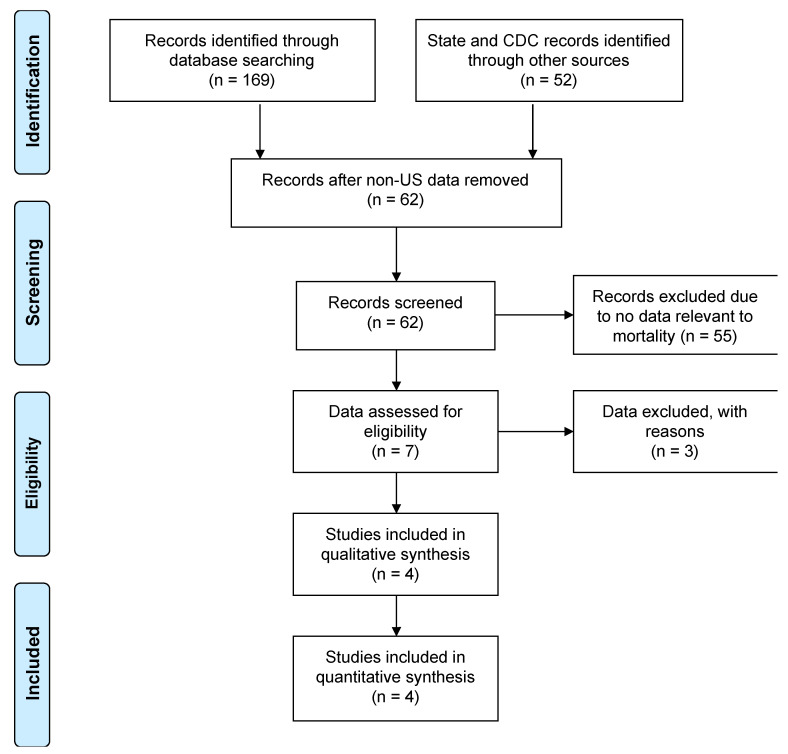
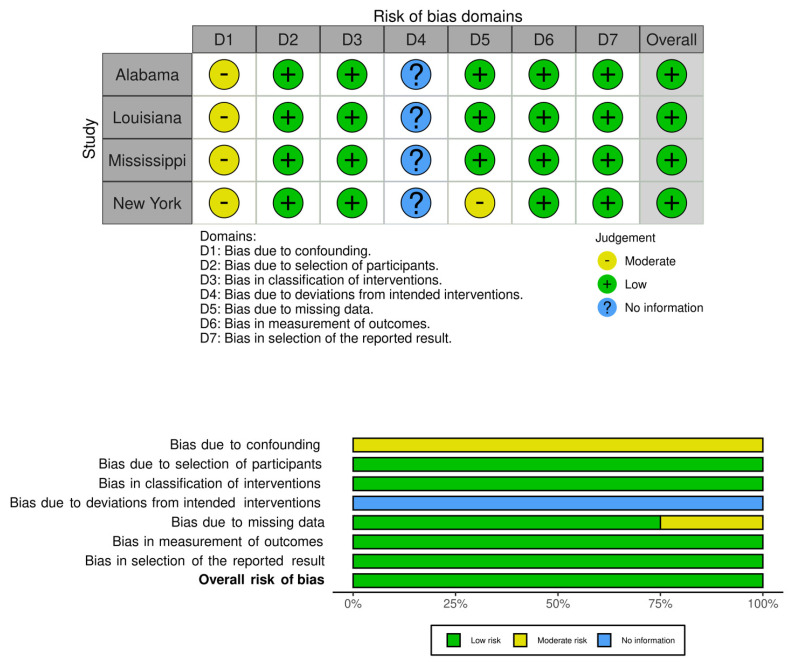
Methods: We collected all the comorbidity data from the public health websites of fifty US States and Washington DC (originally accessed on December 2020). The timing of the data collection should minimize bias from the COVID-19 vaccines and new COVID-19 variants. The comorbidity demographic data were extracted from the state public health data made available online. Using the inverse variance random-effects model, we performed a comparative analysis and estimated the odds ratio of deaths by COVID-19 with pre-existing comorbidities.
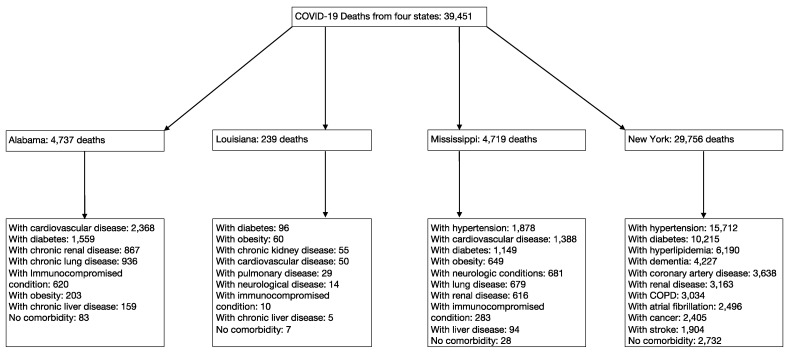
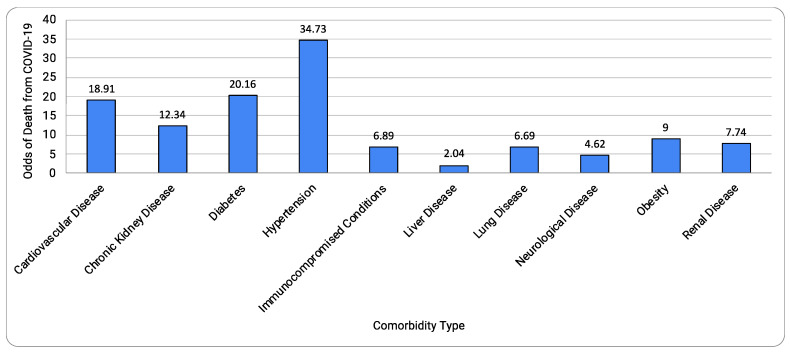
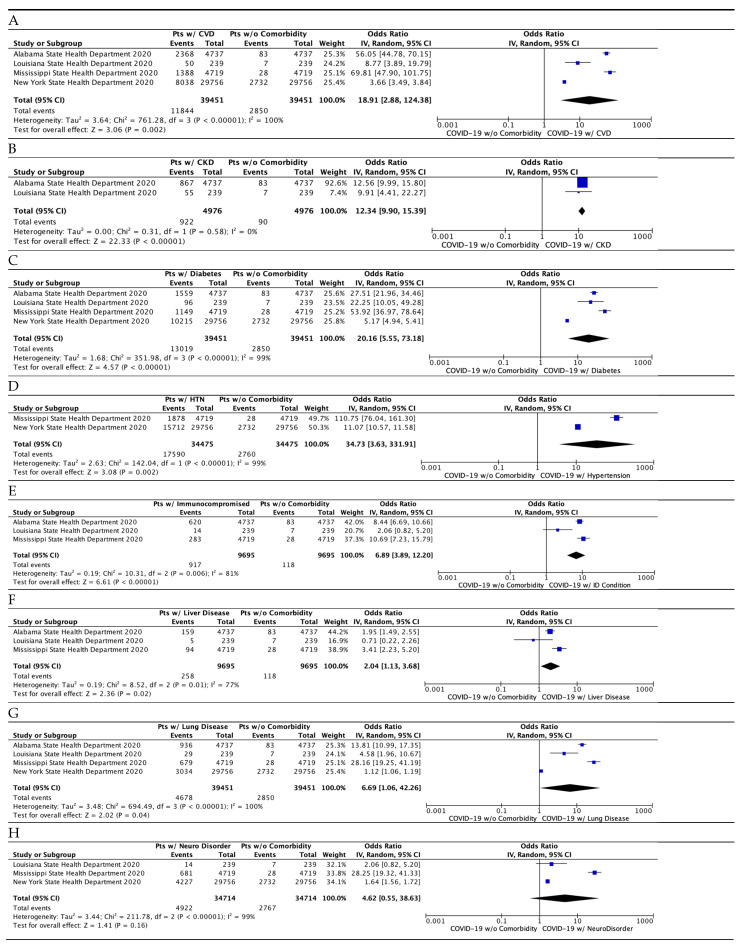
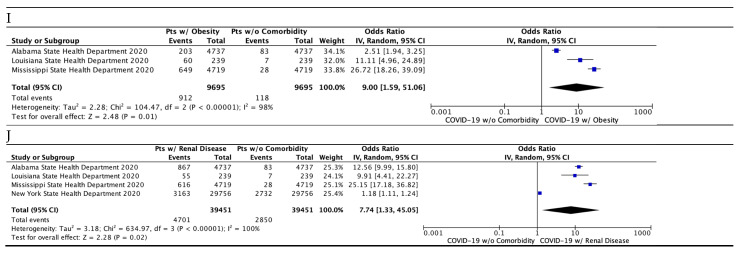
Results: A total of 39,451 COVID-19 deaths were identified from four States that had comorbidity data, including Alabama, Louisiana, Mississippi, and New York. 92.8% of the COVID-19 deaths were associated with a pre-existing comorbidity. The risk of mortality associated with at least one comorbidity combined was 1113 times higher than that with no comorbidity. The comparative analysis identified nine comorbidities with odds ratios of up to 35 times higher than no comorbidities. Of them, the top four comorbidities were: hypertension (odds ratio 34.73; 95% CI 3.63-331.91; p = 0.002), diabetes (odds ratio 20.16; 95% CI 5.55-73.18; p < 0.00001), cardiovascular disease (odds ratio 18.91; 95% CI 2.88-124.38; p = 0.002), and chronic kidney disease (odds ratio 12.34; 95% CI 9.90-15.39; p < 0.00001). Interestingly, lung disease added only a modest increase in risk (odds ratio 6.69; 95% CI 1.06-42.26; p < 0.00001).
Conclusion: The aforementioned comorbidities show surprisingly high risks of COVID-19 mortality when compared to the population with no comorbidity. Major comorbidities were enriched with pre-existing comorbidities that are common with increasing age (cardiovascular disease, diabetes, and hypertension). The COVID-19 deaths were mostly associated with at least one comorbidity, which may be a source of the bias leading to the underestimation of the mortality risks previously reported. We note that the method has limitations stemming primarily from the availability of the data. Taken together, this type of study is useful to approximate the risks, which most likely provide an updated awareness of age-related comorbidities.
Keywords: COVID-19; age-related comorbidity; mortality; risk assessment.
Conflict of interest statement
The authors declare no conflict of interest.
Figures
References
-
- The Centers for Disease Control and Prevention (CDC) People with Certain Medical Conditions. COVID-19. [(accessed on 18 August 2020)]; Available online: https://www.cdc.gov/coronavirus/2019-ncov/need-extra-precautions/people-....
-
- The Centers for Disease Control and Prevention (CDC) Underlying Medical Conditions Associated with High Risk for Severe COVID-19: Information for Healthcare Providers. [(accessed on 29 December 2020)]; Available online: https://www.cdc.gov/coronavirus/2019-ncov/hcp/clinical-care/underlyingco.... - PubMed
LinkOut - more resources
Full Text Sources
