

SARS-CoV-2 N-antigenemia in critically ill adult COVID-19 patients: Frequency and association with inflammatory and tissue-damage biomarkers
- PMID: 34449894
- PMCID: PMC8662104
- DOI: 10.1002/jmv.27300
SARS-CoV-2 N-antigenemia in critically ill adult COVID-19 patients: Frequency and association with inflammatory and tissue-damage biomarkers
Abstract
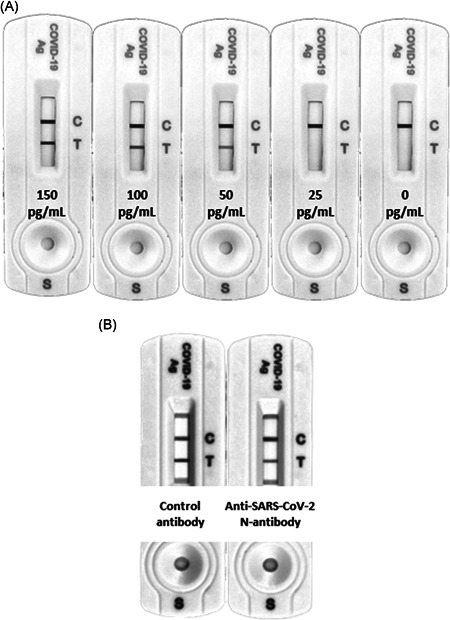
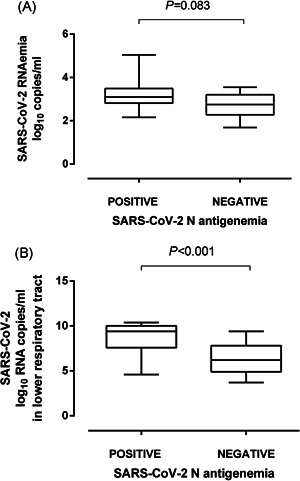
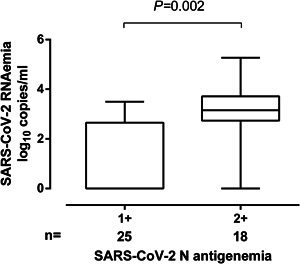
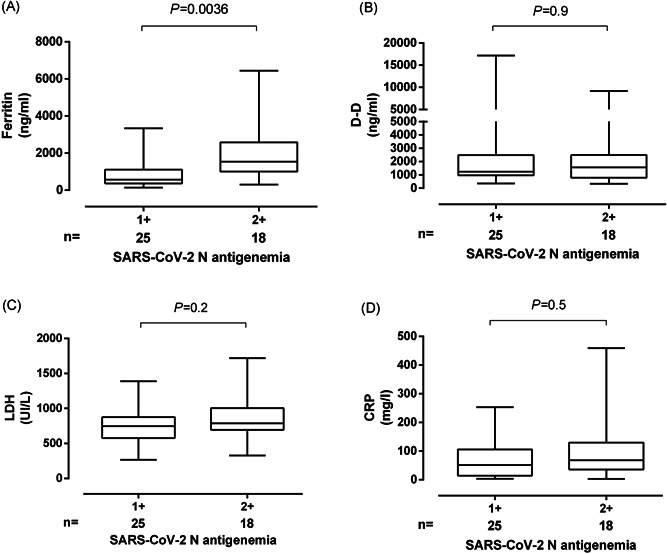
The current study aimed at characterizing the dynamics of SARS-CoV-2 nucleocapsid (N) antigenemia in a cohort of critically ill adult COVID-19 patients and assessing its potential association with plasma levels of biomarkers of clinical severity and mortality. Seventy-three consecutive critically ill COVID-19 patients (median age, 65 years) were recruited. Serial plasma (n = 340) specimens were collected. A lateral flow immunochromatography assay and reverse-transcription polymerase chain reaction (RT-PCR) were used for SARS-CoV-2 N protein detection and RNA quantitation and in plasma, respectively. Serum levels of inflammatory and tissue-damage biomarkers in paired specimens were measured. SARS-CoV-RNA N-antigenemia and viral RNAemia were documented in 40.1% and 35.6% of patients, respectively at a median of 9 days since symptoms onset. The level of agreement between the qualitative results returned by the N-antigenemia assay and plasma RT-PCR was moderate (k = 0.57; p < 0.0001). A trend towards higher SARS-CoV-2 RNA loads was seen in plasma specimens testing positive for N-antigenemia assay than in those yielding negative results (p = 0.083). SARS-CoV-2 RNA load in tracheal aspirates was significantly higher (p < 0.001) in the presence of concomitant N-antigenemia than in its absence. Significantly higher serum levels of ferritin, lactose dehydrogenase, C-reactive protein, and D-dimer were quantified in paired plasma SARS-CoV-2 N-positive specimens than in those testing negative. Occurrence of SARS-CoV-2 N-antigenemia was not associated with increased mortality in univariate logistic regression analysis (odds ratio, 1.29; 95% confidence interval, 0.49-3.34; p = 0.59). In conclusion, SARS-CoV-2 N-antigenemia detection is relatively common in ICU patients and appears to associate with increased serum levels of inflammation and tissue-damage markers. Whether this virological parameter may behave as a biomarker of poor clinical outcome awaits further investigations.
Keywords: COVID-19; SARS-CoV-2 N-antigenemia; SARS-CoV-2 RNAemia; inflammation biomarkers; mortality.
© 2021 Wiley Periodicals LLC.
Conflict of interest statement
The authors declare that there are no conflict of interests.
Figures
References
-
- Berlin DA, Gulick RM, Martinez FJ. Severe Covid‐19. N Engl J Med. 2020;383:2451‐2460. - PubMed
Publication types
MeSH terms
Substances
LinkOut - more resources
Full Text Sources
Medical
Research Materials
Miscellaneous
