. 2021 Sep 2;184(18):4651-4668.e25.
doi: 10.1016/j.cell.2021.08.002. Epub 2021 Aug 26.

Rescue of a lysosomal storage disorder caused by Grn loss of function with a brain penetrant progranulin biologic

Affiliations

Rescue of a lysosomal storage disorder caused by Grn loss of function with a brain penetrant progranulin biologic

Todd Logan et al. Cell. .

Erratum in

  • Rescue of a lysosomal storage disorder caused by Grn loss of function with a brain penetrant progranulin biologic.
    Logan T, Simon MJ, Rana A, Cherf GM, Srivastava A, Davis SS, Yoon Low RL, Chiu CL, Fang M, Huang F, Bhalla A, Llapashtica C, Prorok R, Pizzo ME, Calvert MEK, Sun EW, Hsiao-Nakamoto J, Rajendra Y, Lexa KW, Srivastava DB, van Lengerich B, Wang J, Robles-Colmenares Y, Kim DJ, Duque J, Lenser M, Earr TK, Nguyen H, Chau R, Tsogtbaatar B, Ravi R, Skuja LL, Solanoy H, Rosen HJ, Boeve BF, Boxer AL, Heuer HW, Dennis MS, Kariolis MS, Monroe KM, Przybyla L, Sanchez PE, Meisner R, Diaz D, Henne KR, Watts RJ, Henry AG, Gunasekaran K, Astarita G, Suh JH, Lewcock JW, DeVos SL, Di Paolo G. Logan T, et al. Cell. 2024 Mar 14;187(6):1565-1566. doi: 10.1016/j.cell.2024.02.015. Cell. 2024. PMID: 38490183 Free PMC article. No abstract available.

Abstract

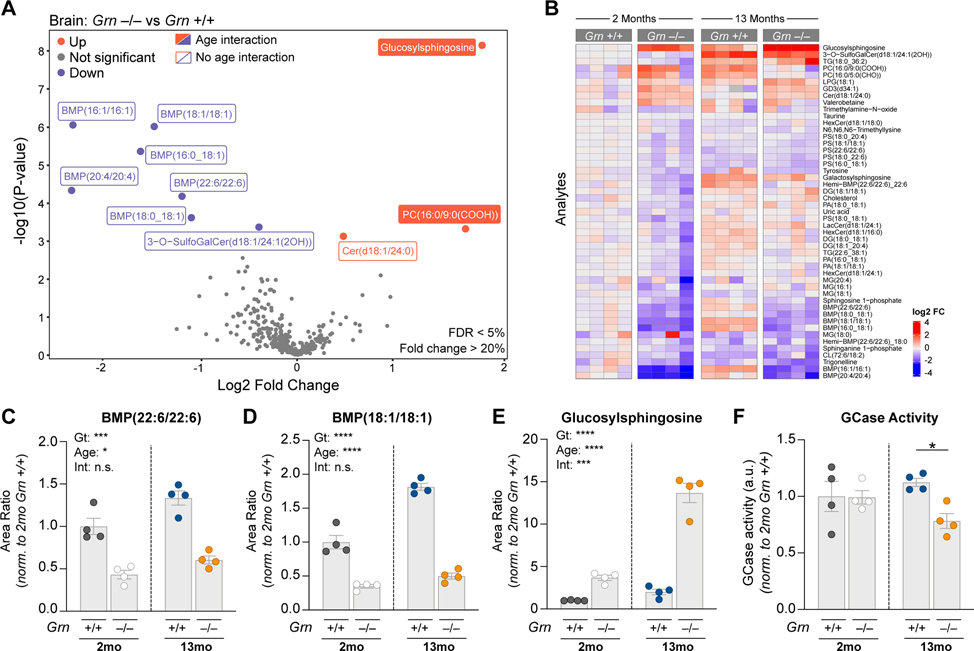
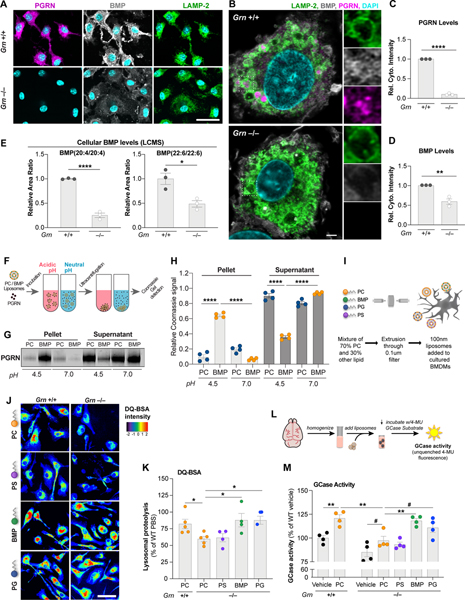
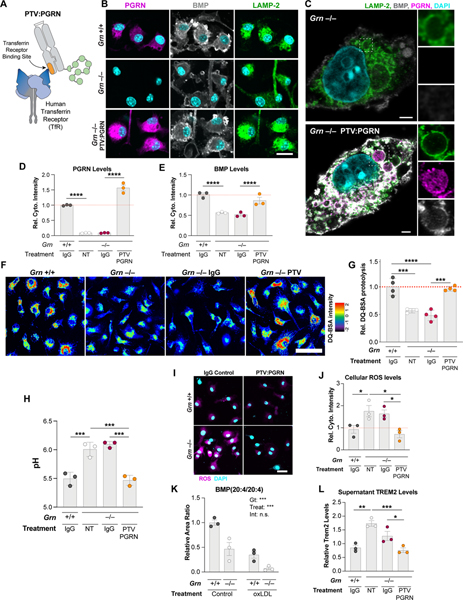
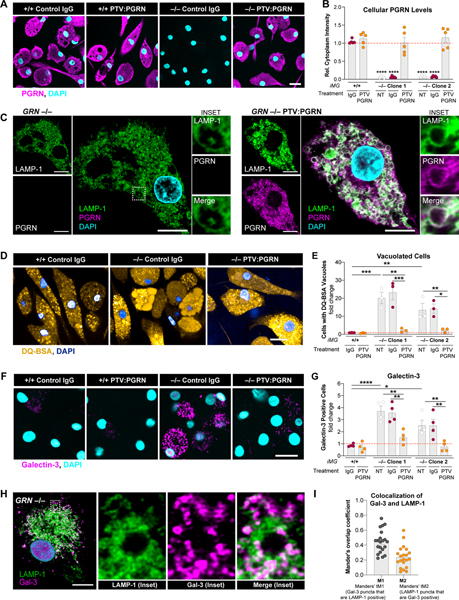
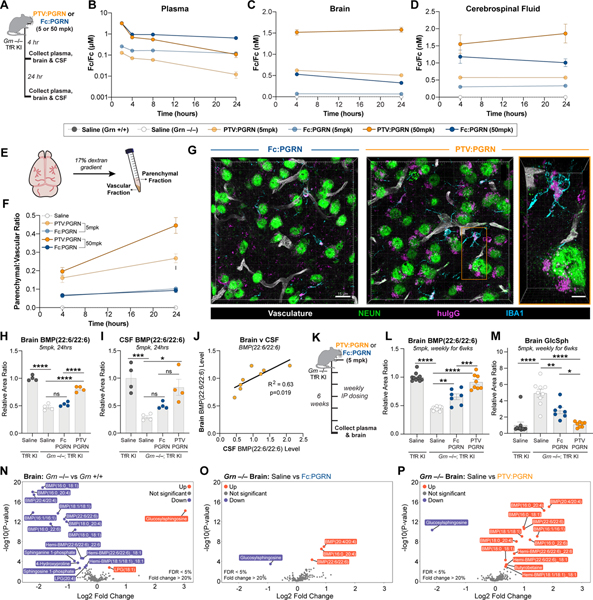
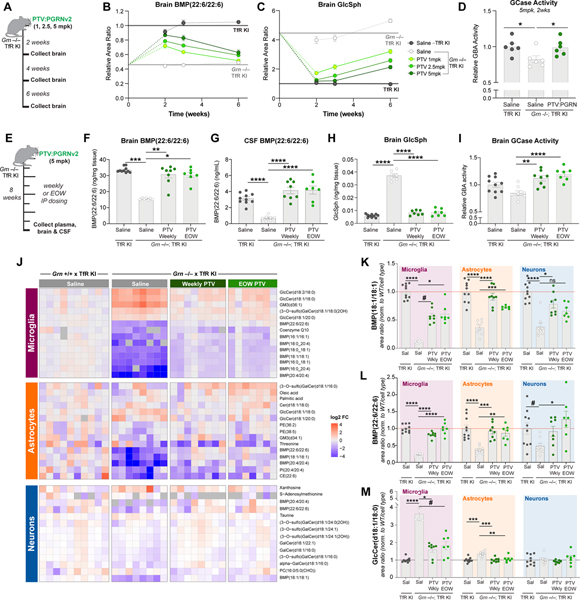
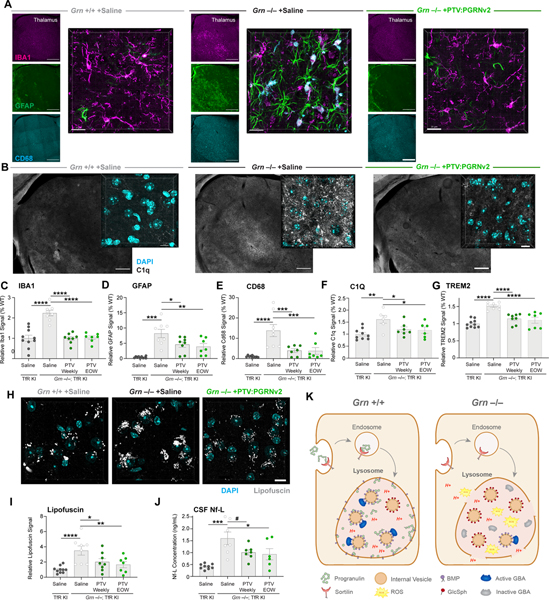
GRN mutations cause frontotemporal dementia (GRN-FTD) due to deficiency in progranulin (PGRN), a lysosomal and secreted protein with unclear function. Here, we found that Grn-/- mice exhibit a global deficiency in bis(monoacylglycero)phosphate (BMP), an endolysosomal phospholipid we identified as a pH-dependent PGRN interactor as well as a redox-sensitive enhancer of lysosomal proteolysis and lipolysis. Grn-/- brains also showed an age-dependent, secondary storage of glucocerebrosidase substrate glucosylsphingosine. We investigated a protein replacement strategy by engineering protein transport vehicle (PTV):PGRN-a recombinant protein linking PGRN to a modified Fc domain that binds human transferrin receptor for enhanced CNS biodistribution. PTV:PGRN rescued various Grn-/- phenotypes in primary murine macrophages and human iPSC-derived microglia, including oxidative stress, lysosomal dysfunction, and endomembrane damage. Peripherally delivered PTV:PGRN corrected levels of BMP, glucosylsphingosine, and disease pathology in Grn-/- CNS, including microgliosis, lipofuscinosis, and neuronal damage. PTV:PGRN thus represents a potential biotherapeutic for GRN-FTD.

Keywords: GBA; LBPA; galectin-3; lipidomics; lipids; lipofuscin; lysobisphosphatidic acid; lysosome; metabolomics; neurodegenerative disease.


Conflict of interest statement

Declaration of interests All authors, except A.L.B., H.H., H.J.R., and B.F.B., are full-time employees and/or shareholders of Denali Therapeutics. A.L.B. reports consultancy for AGTC, Alector, Arkuda, Arvinas, Asceneuron, AZTherapies, Bioage, GSK, Humana, Lundbeck, Ono, Roche, Samumed, Sangamo, Stealth Therapeutics, Third Rock, Transposon, UCB, and Wave and research support from the Association for Frontotemporal Degeneration, Biogen, Bluefield Project to Cure Frontotemporal Dementia, Eli Lilly, Eisai, National Institutes of Health (grant numbers U19AG063911, U54NS092089, R01AG031278), and the Rainwater Charitable Foundation. B.F.B. reports research support from the NIH (U19AG063911). H.J.R. reports funding from the NIH and consultancy with Alector, Ionis, Biogen, Wave, Takeda, and AFTD. This work has been in part described in one or more pending patent applications.

Figures

Figure 1.
Figure 1.. Grn−/− brains show lysosomal lipid dysregulation
(A) Volcano plot of lipid and metabolites elevated (red) or reduced (blue) in frontal cortex from Grn−/− mice relative to age-matched Grn+/+ mice (2 and 13mo mice, log2 transformed, n=4/group). Plotted p-values adjusted for age and genotype interaction. Adjusted analyte values with an FDR < 5% and a fold change of >20% are labeled with filled squares (linear regression model with Benjamini-Hochberg multiple comparisons correction). Analytes with significant genotype differences prior to adjustment indicated with open squares. (B) Heatmap of all analytes with unadjusted p-values of <0.1. Columns represent individual mice. Plotted values are log2 fold transformed and normalized to mean of 2mo. Grn+/+ mice. (C-E) Characterization of genotype and age effects on frontal cortex levels of BMP(22:6/22:6) (C), BMP(18:1/18:1) (D) and glucosylsphingosine (GlcSph) (E). LC/MS area ratios normalized to mean 2mo. Grn+/+ area ratios (left, grey circles) for each analyte. (F) GCase activity in 2mo. vs. 13mo. Grn−/− mouse brain. For (C-E), Two-way ANOVA, Sidak’s multiple comparison was used (n=4/group). *p<0.05, ***p<0.001, ****p<0.0001 (unadjusted). Data represented as geometric mean±SEM. See also Fig. S1.
Figure 2.
Figure 2.. PGRN regulates lysosomal function via control of BMP levels
(A) Epifluorescence microscopy analysis of PGRN, BMP, and LAMP-2 in BMDMs showing no PGRN signal and reduced BMP signal in Grn−/− cells. Scale bar: 50 μm. (B) Super-resolution microscopy analysis of markers in (A) highlighting lysosomal localization of PGRN and BMP in Grn+/+ cells. Scale bar: 2 μm. (C,D) Levels of PGRN (C) and BMP (D) from immunofluorescence in (A) showing PGRN loss and reduced BMP in Grn−/− BMDMs. (n=3 independent experiments; Student’s t-test). (E) LCMS analysis of BMP species in BMDMs showing a decrease in PUFA-BMP levels in Grn−/− cells. (n=3 independent experiments; Student’s t-test). (F) Cartoon of liposome sedimentation assay with recombinant huPGRN and PC vs. BMP liposomes after incubation at acidic or neutral pH. (G) Coomassie Blue stain of PGRN after sedimentation and SDS-PAGE. (H) PGRN levels in pellet (bound) and supernatant (free) fractions from (G). (n = 4 independent experiments; one-way ANOVA, Dunnett’s multiple comparison). (I) Cartoon of liposome supplementation paradigm for the DQ-BSA assay in BMDMs. (J) Fluorescence microscopy of lysosomal proteolysis using the DQ-BSA assay after artificial coloring of the fluorescence intensity. Scale bar: 50 μm. (K) Quantification of the DQ-BSA fluorescence from (J) showing rescue of lysosomal proteolysis in Grn−/− BMDMs treated with BMP and PG liposomes. (n = 5 independent experiments; one-way ANOVA, Dunnett’s multiple comparison). (L) Cartoon of liposome supplementation paradigm to assess GCase activity in brain homogenate. (M) Quantification of GCase activity in detergent-free 6–7 mo. brain extracts showing rescue of GCase activity in Grn−/− extracts treated with BMP and PG liposomes. (n = 4 mice, representative of 2 independent experiments; one-way ANOVA, Dunnett’s multiple comparison). #p<0.1, *p<0.05, **p<0.01, ****p<0.0001. Data shown as geometric mean±SEM. See also Fig. S2.
Figure 3.
Figure 3.. PTV:PGRN rescues lysosomal and inflammatory phenotypes in Grn−/− BMDMs.
(A) Architecture of PTV:PGRN fusion protein, showing the huTfR binding site in the Fc domain (orange) linked to huPGRN. (B-C) Epifluorescence (B) and super-resolution microscopy (C) representative images of PGRN, LAMP-2, and BMP in untreated Grn+/+ and Grn−/− BMDMs or Grn−/− BMDMs treated with 50nM PTV:PGRN for 72h. PTV:PGRN restores PGRN and BMP immunoreactivity in mutant cells. Scale bar: 25 μm (B), 2 μm (C). (D-E) Levels of PGRN (D) and BMP (E) from immunofluorescence in (B) showing rescue in Grn−/− BMDMs after treatment with PTV:PGRN, but not IgG control. (n = 3 independent experiments; one-way ANOVA, Dunnett’s multiple comparison). (F) Fluorescence microscopy of lysosomal proteolysis using the DQ-BSA assay. PTV:PGRN, but not IgG control, rescued the decrease in DQ-BSA fluorescence, and thus lysosomal proteolysis, in Grn−/− BMDMs. Artificial coloring of fluorescence intensity was used. Scale bar: 50 μm. (G) Quantification of the DQ-BSA fluorescence from (F) showing rescue of lysosomal proteolysis in the Grn−/− BMDMs with PTV:PGRN, but not IgG control. (n = 4 independent experiments; one-way ANOVA, Dunnett’s multiple comparison). (H) Lysosomal pH measurements showing rescue of alkalinized pH in the Grn−/− BMDMs treated with PTV:PGRN, but not IgG control. (n = 3 independent experiments; one-way ANOVA, Dunnett’s multiple comparison). (I) Fluorescence microscopy of reactive oxygen species (ROS) using the DCFDA assay. PTV:PGRN, but not IgG control, rescued the increase in DCFDA fluorescence, and thus ROS production, in Grn−/− BMDMs. Scale bar: 25 μm. (J) Quantification of the DCFDA fluorescence from (I) showing rescue of ROS levels in the Grn−/− BMDMs treated with PTV:PGRN, but not IgG control. (n = 3 independent experiments; one-way ANOVA, Dunnett’s multiple comparison). (K) Quantification of BMP (20:4/20:4) levels showing a decrease in both Grn+/+ and Grn−/− after treatment with oxLDL, but not vehicle control. (n = 3 independent experiments; two-way ANOVA, Tukey’s multiple comparison). (L) Quantification of soluble TREM2 levels in conditioned media from BMDM analyzed in (J) showing an increase in Grn−/− BMDMs and a rescue after PTV:PGRN treatment, but not control IgG. (n = 3 independent experiments; one-way ANOVA, Dunnett’s multiple comparison). *p<0.05, **p<0.01, ***p<0.001, ****p<0.0001. Data shown as geometric mean±SEM. See also Fig. S3.
Figure 4.
Figure 4.. PTV:PGRN rescues endolysosomal vacuolization and endomembrane damage in human GRN−/− iMG.
(A) Epifluorescence microscopy of PGRN in GRN+/+ and GRN−/− human iPSC-derived microglia (iMG) treated with 100 nM control IgG or PTV:PGRN each day for 3 days. PTV:PGRN restores PGRN in mutant cells. Scale bar: 25 μm. (B) Quantification of PGRN levels in (A) showing rescue of the protein in two independent GRN−/− iMG clones after treatment with PTV:PGRN. NT, no treatment. (n = 3 independent experiments; one-way ANOVA, Dunnett’s multiple comparison). (C) Super-resolution microscopy of PGRN and LAMP-1 in GRN−/− iMG showing PTV:PGRN restores PGRN localization in the lysosomes and corrects the vacuolization phenotype. Insets: higher magnification of lysosomes with single channels and merge. Scale bar: 10 μm. (D) Fluorescence microscopy of DQ-BSA fluorescence in GRN+/+ and GRN−/− iMG showing PTV:PGRN rescues the vacuolization of GRN−/− iMG. Images show increase in fraction of cells containing one or more large vacuoles filled with the fluorescent dye GRN−/− iMG. Scale bar: 25 μm. (E) Quantification of % cells with DQ-BSA-filled vacuoles GRN+/+ and GRN−/− iMG with no treatment (NT) or after treatment with IgG control or PTV:PGRN. (n = 3 independent experiments; one-way ANOVA, Dunnett’s multiple comparison). (F) Epifluorescence microscopy of galectin-3 (Gal-3) in iMG showing an increase in endolysosomal membrane damage, as denoted by the increased Gal-3 fluorescence, in GRN−/− iMG and a rescue with PTV:PGRN. Scale bar: 25 μm. (G) Quantification of Gal-3 positive GRN+/+ and GRN−/− iMG with no treatment (NT) or after a treatment with IgG control or PTV:PGRN. (n = 4 independent experiments; one-way ANOVA, Dunnett’s multiple comparison). (H) Super-resolution microscopy of Gal-3 and LAMP-1 in GRN−/− iMG. Insets: higher magnification of lysosomes with single channels and merge. Scale bar: 10 μm. (I) Quantification of colocalization of Gal-3 and LAMP-1 from (H) using Mander’s overlap coefficients. *p<0.05, **p<0.01, ***p<0.001, ****p<0.0001. Data shown as geometric mean±SEM. See also Fig. S4.
Figure 5:
Figure 5:. PTV:PGRN increases brain uptake and lysosomal lipid rescue in Grn−/−; TfRmu/hu mice relative to Fc:PGRN.
(A) Schematic of 24h biodistribution study in 3mo Grn−/−; TfRmu/hu mice. (B-D) Concentration of Fc domain in plasma (B), brain (C) and CSF (D) as determined by Fc sandwich ELISA (n=4/group, Two-way ANOVA with Sidak’s multiple comparison test). (B) PTV:PGRN (dark orange = 50 mg/kg, light orange = 5mg/kg) is cleared more rapidly from plasma than Fc:PGRN (dark blue = 50mg/kg, light blue = 5mg/kg) at both dose levels (50mg/kg: padj<0.0001, 5mg/kg: padj<0.0001). (C) Brain PTV:PGRN concentrations are higher at either dose than 50mg/kg Fc:PGRN (50mg/kg PTV:PGRN: padj<0.0001, 5mg/kg PTV:PGRN: padj<0.001). (D) CSF Fc concentrations are greater for PTV:PGRN than Fc:PGRN at 50mg/kg dose (50mg/kg: padj<0.01, 5mg/kg: padj=0.3946). (E) Capillary depletion allows for separation of parenchymal and vascular brain fractions. (F) The parenchymal:vascular ratio of drug levels is increased by PTV:PGRN at 5 and 50mg/kg doses (n=4/group, Two-way ANOVA with Sidak’s multiple comparison test, 50mg/kg: padj<0.0001, 5mg/kg: padj<0.0001). (G) Representative fluorescence image 3D projections of thalamic huIgG (magenta) distribution 24h after a 50mg/kg IV dose of Fc:PGRN (left) or PTV:PGRN (right). Neuronal (NEUN), microglial (IBA1) and vascular (podocalyxin/CD31) compartments also labeled (scale bar: 15 μm). Inset: single cells with intracellular huIgG uptake. Scale bar: 5μm. (H) Relative brain abundance of BMP(22:6/22:6) 24h after 5mg/kg dose. PTV:PGRN increases huIgG concentrations vs. Fc:PGRN (n=4/group; one way ANOVA, Dunnett’s multiple comparison). (I) CSF BMP (22:6/22:6) in Grn−/−; TfRmu/hu mice treated with PTV:PGRN vs. Fc:PGRN. Only PTV:PGRN significantly increases BMP levels (n=4/group; one way ANOVA, Dunnett’s multiple comparison). (J) Correlation of brain and CSF BMP(22:6/22:6) levels in PTV:PGRN-treated mice (n=8, linear regression). (K) Schematic of 6-week repeat dosing study in 7mo Grn−/−; TfRmu/hu mice. (L) Rescue of brain BMP(22:6/22:6) by Fc:PGRN and PTV:PGRN. (n=7–10/group; one way ANOVA, Dunnett’s multiple comparison). (M) Rescue of brain GlcSph by Fc:PGRN and PTV:PGRN. (n=7–10/group; Kruskal-Wallis with Dunn’s post-hoc multiple comparisons). (N-P) Volcano plots of lipid and metabolite changes in Grn−/− vs. Grn+/+ mice (N), Fc:PGRN-treated (O), and PTV:PGRN-treated Grn−/− mice (P). **p<0.01, ***p<0.001, ****p<0.0001. Data shown as mean±SEM. See also Fig. S5.
Figure 6:
Figure 6:. PTV:PGRNv2 rescues lipid anomalies across CNS cell types.
(A) Schematic of single dose, 6-week IV dose titration study in 4mo. mice. (B-C) Time course of PTV:PGRNv2 driven rescue of BMP(22:6/22:6) (1mg/kg: padj<0.0001) (B) or GlcSph (1mg/kg: padj<0.0001) (C) in Grn−/−; TfRmu/hu at 5mg/kg (dark green), 2.5mg/kg (medium green) or 1mg/kg (light green) dose (n=6/group, Two-way ANOVA with Sidak’s multiple comparison test). (D) Rescue of GCase activity 2 weeks following IV dosing of 5mg/kg PTV:PGRNv2 (n=6/group; one way ANOVA, Dunnett’s multiple comparison). (E) Schematic of 8 week repeat dosing study with weekly or every other week (EOW) PTV:PGRNv2 starting at 7mo. in Grn−/−; TfRmu/hu mice (n=7–10/group). (F-G) Rescue of BMP(22:6/22:6) in brain (F) and CSF (G) (Kruskal-Wallis with Dunn’s post-hoc multiple comparison (F), and one way ANOVA, Dunnett’s multiple comparison, respectively). (H) Rescue of brain GlcSph (one way ANOVA, Dunnett’s multiple comparison). (I) Restoration of brain GCase activity (one way ANOVA, Dunnett’s multiple comparison). (J) Heatmap of the top differentially regulated lipids and metabolites in cell-type enriched populations. Analyte abundance normalized to Grn+/+; TfRmu/hu (left). Columns represent biological replicates (n=7–10/group). (K-M) Bar plots of BMP(18:1/18:1) (K), BMP(22:6/22:6) (L), and GlcCer(18:1/18:0) (M) from all three cell types, demonstrating rescue across CNS cell types with both weekly (Wkly) and EOW PTV:PGRNv2 treatment (Kruskal-Wallis with Dunn’s post-hoc multiple comparison (K, M (microglia)), or one way ANOVA with Dunnett’s multiple comparison, (M, L)). #p<0.1, *p<0.05, **p<0.01, ***p<0.001, ****p<0.0001. Data shown as mean±SEM. See also Fig. S6.
Figure 7:
Figure 7:. PTV:PGRNv2 rescues gliosis, lipofuscin and neurodegeneration.
(A-F) Representative images and quantification of markers of microgliosis (IBA1), astrogliosis (GFAP) and reactive microglia (CD68, and C1Q), in thalamus of 9mo. Grn−/−; TfRmu/hu mice after weekly or EOW dosing with PTV:PGRNv2 for 8 weeks, as shown in Fig. 6E (n=6–10/group; one way ANOVA, Dunnett’s multiple comparison). (A) Low (left) and high (right) magnification images of thalamic gliosis markers after weekly PTV:PGRNv2 treatment. Left scale bar: 500 μm, right scale bar: 20μm. (B) Low (left) and high (right) magnification images of C1Q expression in thalamus and rescue with weekly PTV:PGRNv2 treatment. Left scale bar: 500 μm, right scale bar: 10μm. Increased total gliosis as measured by IBA1 (C), astrogliosis marker GFAP (D), and reactive microgliosis markers CD68 (E) and C1Q (F) are rescued by PTV:PGRNv2. (G) Reduction of total brain TREM2 levels measured by MSD in Grn−/−; TfRmu/hu by PTV:PGRNv2. (H-I) Representative images (H) and quantification (I) of thalamic lipofuscin in Grn−/−; TfRmu/hu and rescue by PTV:PGRNv2 (n=7–10/group; one way ANOVA, Dunnett’s multiple comparison). (J) Reduced CSF Nf-L levels by PTV:PGRNv2 in Grn−/−; TfRmu/hu mice (n=6–9/group; one way ANOVA, Dunnett’s multiple comparison). (K) Model for PGRN deficiency driven lysosomal dysfunction. Under normal conditions, PGRN is delivered to lysosomes via interaction with sortilin (or indirectly via prosaposin, not shown). There, it is proteolytically cleaved into granulin peptides. PGRN and/or GRN peptides stabilize BMP via both direct physical interaction and prevention of ROS mediated oxidation. This preserves the stimulatory function of BMP toward GCase activity, possibly via saposin C peptides (not shown). In the context of Grn LoF, lysosomal PGRN and GRN peptide deficits result in destabilization of BMP, and vulnerability of lysosomal limiting membrane to oxidative damage, ultimately leading to membrane permeabilization and proton leak. Additionally, depletion of BMP disrupts the interaction of GCase enzyme with the surface of internal vesicles. Impairing lipase activity and driving accumulation of the Gcase substrate GlcSph. #p<0.1, *p<0.05, **p<0.01, ***p<0.001, ****p<0.0001. Data shown as mean±SEM. See also Fig. S7.

References

    1. Abdul-Hammed M, Breiden B, Schwarzmann G, and Sandhoff K (2017). Lipids regulate the hydrolysis of membrane bound glucosylceramide by lysosomal beta-glucocerebrosidase. J Lipid Res 58, 563–577. - PMC - PubMed
    1. Andreone BJ, Przybyla L, Llapashtica C, Rana A, Davis SS, van Lengerich B, Lin K, Shi J, Mei Y, Astarita G, et al. (2020). Alzheimer’s-associated PLCgamma2 is a signaling node required for both TREM2 function and the inflammatory response in human microglia. Nat Neurosci 23, 927–938. - PubMed
    1. Arrant AE, Roth JR, Boyle NR, Kashyap SN, Hoffmann MQ, Murchison CF, Ramos EM, Nana AL, Spina S, Grinberg LT, et al. (2019). Impaired beta-glucocerebrosidase activity and processing in frontotemporal dementia due to progranulin mutations. Acta Neuropathol Commun 7, 218. - PMC - PubMed
    1. Baker M, Mackenzie IR, Pickering-Brown SM, Gass J, Rademakers R, Lindholm C, Snowden J, Adamson J, Sadovnick AD, Rollinson S, et al. (2006). Mutations in progranulin cause tau-negative frontotemporal dementia linked to chromosome 17. Nature 442, 916–919. - PubMed
    1. Beel S, Moisse M, Damme M, De Muynck L, Robberecht W, Van Den Bosch L, Saftig P, and Van Damme P (2017). Progranulin functions as a cathepsin D chaperone to stimulate axonal outgrowth in vivo. Hum Mol Genet 26, 2850–2863. - PMC - PubMed

Publication types

MeSH terms