. 2021 Sep 2;184(18):4734-4752.e20.
doi: 10.1016/j.cell.2021.08.003. Epub 2021 Aug 26.

Spatially organized multicellular immune hubs in human colorectal cancer

Karin Pelka  1 Matan Hofree  2 Jonathan H Chen  3 Siranush Sarkizova  4 Joshua D Pirl  4 Vjola Jorgji  5 Alborz Bejnood  2 Danielle Dionne  2 William H Ge  4 Katherine H Xu  6 Sherry X Chao  7 Daniel R Zollinger  8 David J Lieb  4 Jason W Reeves  8 Christopher A Fuhrman  8 Margaret L Hoang  8 Toni Delorey  2 Lan T Nguyen  2 Julia Waldman  2 Max Klapholz  9 Isaac Wakiro  10 Ofir Cohen  11 Julian Albers  4 Christopher S Smillie  2 Michael S Cuoco  2 Jingyi Wu  10 Mei-Ju Su  10 Jason Yeung  10 Brinda Vijaykumar  12 Angela M Magnuson  12 Natasha Asinovski  12 Tabea Moll  13 Max N Goder-Reiser  13 Anise S Applebaum  13 Lauren K Brais  14 Laura K DelloStritto  10 Sarah L Denning  14 Susannah T Phillips  13 Emma K Hill  14 Julia K Meehan  14 Dennie T Frederick  13 Tatyana Sharova  13 Abhay Kanodia  10 Ellen Z Todres  4 Judit Jané-Valbuena  2 Moshe Biton  15 Benjamin Izar  16 Conner D Lambden  9 Thomas E Clancy  17 Ronald Bleday  17 Nelya Melnitchouk  17 Jennifer Irani  17 Hiroko Kunitake  18 David L Berger  18 Amitabh Srivastava  19 Jason L Hornick  19 Shuji Ogino  20 Asaf Rotem  10 Sébastien Vigneau  10 Bruce E Johnson  21 Ryan B Corcoran  22 Arlene H Sharpe  23 Vijay K Kuchroo  9 Kimmie Ng  24 Marios Giannakis  25 Linda T Nieman  6 Genevieve M Boland  26 Andrew J Aguirre  25 Ana C Anderson  27 Orit Rozenblatt-Rosen  28 Aviv Regev  29 Nir Hacohen  30
Affiliations

Spatially organized multicellular immune hubs in human colorectal cancer

Karin Pelka et al. Cell. .

Abstract

Immune responses to cancer are highly variable, with mismatch repair-deficient (MMRd) tumors exhibiting more anti-tumor immunity than mismatch repair-proficient (MMRp) tumors. To understand the rules governing these varied responses, we transcriptionally profiled 371,223 cells from colorectal tumors and adjacent normal tissues of 28 MMRp and 34 MMRd individuals. Analysis of 88 cell subsets and their 204 associated gene expression programs revealed extensive transcriptional and spatial remodeling across tumors. To discover hubs of interacting malignant and immune cells, we identified expression programs in different cell types that co-varied across tumors from affected individuals and used spatial profiling to localize coordinated programs. We discovered a myeloid cell-attracting hub at the tumor-luminal interface associated with tissue damage and an MMRd-enriched immune hub within the tumor, with activated T cells together with malignant and myeloid cells expressing T cell-attracting chemokines. By identifying interacting cellular programs, we reveal the logic underlying spatially organized immune-malignant cell networks.

Keywords: MSI; MSS; anti-tumor immunity; cell-cell interactions; colorectal cancer; mismatch repair-deficient; mismatch repair-proficient; scRNA-seq; spatial; tumor atlas.


Conflict of interest statement

Declaration of interests K.P., M.H., J.H.C., V.K.K., A.J.A., O.R.-R., A. Regev., and N.H. are co-inventors on US Patent Application No. 16/995,425 relating to methods for predicting outcomes and treating colorectal cancer as described in the manuscript. A.J.A. is a Consultant for Oncorus, Arrakis Therapeutics, and Merck and receives research funding from Mirati Therapeutics, Deerfield, and Novo Ventures. R.B.C. receives consulting/speaking fees from Abbvie, Amgen, Array Biopharma/Pfizer, Asana Biosciences, Astex Pharmaceuticals, AstraZeneca, Avidity Biosciences, BMS, C4 Therapeutics, Chugai, Elicio, Fog Pharma, Fount Therapeutics/Kinnate Biopharma, Genentech, Guardant Health, Ipsen, LOXO, Merrimack, Mirati Therapeutics, Natera, N-of-one/QIAGEN, Novartis, nRichDx, Revolution Medicines, Roche, Roivant, Shionogi, Shire, Spectrum Pharmaceuticals, Symphogen, Tango Therapeutics, Taiho, Warp Drive Bio, and Zikani Therapeutics; holds equity in Avidity Biosciences, C4 Therapeutics, Fount Therapeutics/Kinnate Biopharma, nRichDx, and Revolution Medicines; and has received research funding from Asana, AstraZeneca, Lilly, and Sanofi. V.K.K. consults for Pfizer, GSK, Tizona Therapeutics, Celsius Therapeutics, Bicara Therapeutics, Compass Therapeutics, Biocon, and Syngene. G.M.B. has sponsored research agreements with Palleon Pharmaceuticals, Olink Proteomics, and Takeda Oncology; served on SABs for Novartis and Nektar Therapeutics; and received honoraria from Novartis. A.C.A. is a paid consultant for iTeos Therapeutics, and is an SAB member for Tizona Therapeutics, Compass Therapeutics, Zumutor Biologics, and ImmuneOncia, which have interests in cancer immunotherapy. A.C.A.’s interests were reviewed and managed by the BWH and Partners Healthcare in accordance with their conflict of interest policies. M.G. receives research funding from BMS, Merck, and Servier. J.W.R., C.A.F., and M.L.H. are employees of and stockholders for NanoString Technologies Inc. D.R.Z. is a former employee of NanoString Technologies Inc. B.I. is a consultant for Merck and Volastra Therapeutic. R.B. is an UptoDate Author. A. Rotem is an equity holder in Celsius Therapeutics and NucleAI. K.N. has research funding from Janssen, Revolution Medicines, Evergrande Group, Pharmavite; advisory board: Seattle Genetics, BiomX; consulting: X-Biotix Therapeutics; research funding: BMS, Merck, and Servier. B.E.J. is on the SAB for Checkpoint Therapeutics. O.R.-R. is a named inventor on patents and patent applications filed by the Broad Institute in single-cell genomics. From October 2020, O.R.-R. is an employee of Genentech. A. Regev. is a founder of and equity holder in Celsius Therapeutics, an equity holder in Immunitas Therapeutics, and was an SAB member for Thermo Fisher Scientific, Syros Pharmaceuticals, and Neogene Therapeutics until August 1, 2020. From August 1, 2020, A. Regev. is an employee of Genentech. A. Regev. is a named inventor on several patents and patent applications filed by the Broad Institute in single-cell and spatial genomics. N.H. holds equity in BioNTech and is an advisor for Related Sciences/Danger Bio.

Figures

Figure 1.
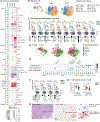
Figure 1.. Patient cohort and atlas of cell subsets and programs in MMRd and MMRp CRC.
(A) MMR status and clinical characteristics of primary untreated CRC patients. (B) tSNEs by major cell partitions (left), tissue type (middle), or patient specimen (right). (C) NMF-based gene programs can be cell type-specific (example 1: pS02-Fibro matrix/stem cell niche) or shared (example 2: pTNI03-proliferation and example 3: pEpi30-ISGs). See also Figure S1 and Table S1.
Figure 2.
Figure 2.. The immune compartment in MMRd and MMRp CRC.
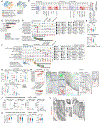
(A) Compositional changes in immune cell clusters in MMRp and MMRd tumors relative to adjacent normal tissue. Kruskal-Wallis FDR<0.05 for MMRp vs. MMRd are marked with *. (B) tSNEs of myeloid cells in all normal and tumor samples. (C) Activities of selected myeloid gene programs with high activities in monocytes and macrophages. Each dot indicates the 75th percentile of the program activity in the myeloid cells of one patient specimen. GLME (generalized linear mixed model) FDR: ****≤0.0001, ***≤0.001, **≤0.01, *≤0.05, ns for >0.05. tSNEs below show program activities within the myeloid compartment. For each program, the top genes are listed below, with circle size indicating the relative weight of each gene within the program. (D) tSNEs of the T/NK/ILC partition colored by major cell subsets. (E) pTNI08, pTNI16, pTNI18, and pTNI06 activities within each of the T/NK/ILC clusters. (F) pTNI08, pTNI16, pTNI18, and pTNI06 activities displayed as in (C). GLME FDR reported as in (C). (G) pTNI16 and pTNI18 gene signature scores in bulk RNAseq from TCGA-CRC (COADREAD) specimens. Mann–Whitney–Wilcoxon test **** for p≤0.0001. (H) Localization of CXCL13+ T cells in tumor center vs. lymphoid structure. Left: H&E, right: CD3E and CXCL13 RNA ISH. Scale bar: 200um. See also Figure S2 and Table S2.
Figure 3.
Figure 3.. Stromal remodeling in MMRd and MMRp CRC.
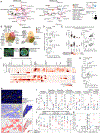
(A) tSNEs of stromal cells in all normal and tumor samples. (B) Compositional changes in endothelial, pericyte, and fibroblast subsets within their respective compartments in MMRp and MMRd tumors relative to adjacent normal tissue. Kruskal-Wallis FDR<0.05 for MMRp vs. MMRd are marked with *. Note: cS30 and cS31 are overwhelmingly from two tumors which grew below non-neoplastic tissue and may not be purely tumor-derived. (C) Fraction of stromal cell subsets per tissue type. Kruskal-Wallis FDR<0.05 for normal vs. tumor are marked with *. (D) Activities of selected programs in each of the endothelial cell clusters. Tumor-enriched clusters are indicated in bold red. Top program genes are listed to the right, with circle size indicating the weight of each gene in the program. Key edges (connectivity) between two normal or one normal and one tumor-associated cluster (weights >0.5, identified by PAGA) are shown below and colors are matched to programs with high activity in the respective clusters. (E) Activity of pS05 (ISG) and pS10 (angiogenesis) in all tumor and normal samples. Each point indicates the 75th percentile of the program activity per patient specimen in the endothelial cells. GLME FDR: **** ≤0.0001, *** ≤0.001, ** ≤0.01, * ≤0.05, ns for >0.05. (F) Selected programs in fibroblast and pericyte subtypes shown as in (D). Shown below are PAGA-based connectivity weights >0.25. (G) Activities of pS03 (ACTA2), pS13 (inflammation), and pS17 (BMP fibro) in fibroblasts and pS03 and pS13 in pericytes, shown as in (E). (H) Dot plot showing geometric mean expression (log(TP10K+1)) and frequency (dot size) of key genes in selected fibroblast subtypes. INHBA distinguishes CAFs from fibroblasts in normal tissue. Tumor-enriched clusters are indicated in bold red. (I) Representative RNA ISH/IF images of tumor show MMP3+ fibroblasts at the luminal surface around dilated vessels, CXCL14+ fibroblasts lining malignant cells, and GREM1+ fibroblasts in stromal bands reaching far into the tumor (left image). In tumors, GREM1+ fibroblasts additionally line epithelial cells (middle), while in normal (right) only CXCL14+ fibroblasts line epithelial cells and GREM1 signal is restricted to in and below the muscularis mucosa. Scale bar: 100um (except where annotated). (J) Quantification of CXCL14+, GREM1+ and MMP3+ CAFs among COL1A1/COL1A2+ fibroblasts based on whole slide scans of 5 MMRd and 4 MMRp CRC specimens from panel (I), Mann-Whitney-Wilcoxon test. Rightmost graph, MMP3+ cells among all COL1A1/COL1A2+ cells outside or inside of the luminal margin (defined as ≤ 360 um from the luminal border of the tumor), Wilcoxon matched-pairs signed rank test. Note that only 8 samples are included at right because one clinical paraffin block did not contain luminal margin. (K) Gene signature scores of top differentially expressed genes from CXCL14+ CAFs, GREM1+ CAFs, MMP3+ CAFs, and all fibroblasts in bulk RNAseq from TCGA-CRC (COADREAD). Mann–Whitney–Wilcoxon test: **** for p≤0.0001, *** ≤0.001, ** ≤0.01, * ≤0.05, ns for >0.05. (L) RNA ISH/IF on consecutive sections to (I) shows RSPO3 signal is restricted to the crypt base in normal (right image and upper inset) but ascends far into the tumor (left image and lower inset). Scale bar: 100um. See also Figure S3 and Table S3.
Figure 4:
Figure 4:. Transcriptional programs in malignant cells differ between MMRd and MMRp CRC.
(A) tSNEs of epithelial cells by tissue type (left), patient (middle), and cell type (right). (B) Heatmap showing the 75th percentile of activities from the 43 malignant programs in malignant cells across CRC patient specimens (rows centered and z-scored), hierarchically clustered using average linkage. Gene program activity in normal epithelial cells is shown for comparison (rightmost column). Significant differences in MMRd vs. MMRp are indicated by * (GLME, patient as random effects, MMR status as fixed effect, FDR<0.05). Significant difference between MLH1 promoter-methylated vs. MLH1-non-methylated MMRd specimens is indicated with +. (C) Inferred cell-type composition of malignant cells in each tumor specimen, classified by supervised learning trained on non-malignant epithelial cells. Epithelial cell composition in normal tissue is shown for comparison (rightmost bar). Morphologically mucinous tumors are indicated with #. Patient order is the same as in panel B (above). (D) Selected immune-related transcriptional programs in epithelial cells with significantly different activity in MMRd vs. MMRp CRC (GLME FDR<0.05). For each program the top genes are shown, circles indicate the relative weight of each gene in the program. tSNEs show program activities across all cell types (global tSNE), location of epithelial cells is indicated on the right in yellow. (E) Signature gene scores for programs in (D) in bulk RNAseq from TCGA-CRC (COADREAD), GSE39582, and GSE13294 specimens. Mann–Whitney–Wilcoxon test: **** for p≤0.0001, *** ≤0.001, ** ≤0.01, * ≤0.05, ns for >0.05. See also Figure S4 and Tables S4 and S6.
Figure 5:
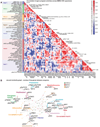
Figure 5:. Discovery of multicellular interaction networks in MMRd CRC.
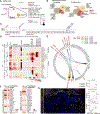
(A) Heatmap showing permutation-adjusted pairwise correlation of gene program activities (‘co-variation score’) across MMRd specimens (STAR Methods) using patient-level activities in T/NK/ILC, myeloid, and malignant compartments. Significance is determined using permutation of patient-ID and indicated with * (FDR<0.1). Densely connected modules (‘hubs’) are identified based on graph clustering of significant correlation edges. (B) Jaccard similarity of gene programs calculated based on the overlap of top weighted genes across T/NK/ILC, stromal, myeloid, and malignant cells. Edge thickness is proportional to program similarity. Edges from selected network neighborhoods are colored and annotated by function. See also Figure S5 and Table S5.
Figure 6:
Figure 6:. An inflammatory hub at the luminal surface of primary MMRd and MMRp tumors.
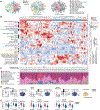
(A) Inflammatory hub 3 in MMRd specimens. Node size is proportional to the log ratio of mean program activities in MMRd vs. normal. Edge thickness is proportional to co-variation. (B) Venn diagrams showing the overlap of top weighted genes (left) and predicted transcription factors (right) for inflammatory gene programs in myeloid, stromal, and malignant compartments. (C) Violin plots showing program activities of pM15, pM20 across myeloid cell clusters and pS13 activity across stromal cell clusters. (D) Expression level of all chemokines and cytokines present in the top genes of the depicted NMF-based programs (indicated with black dot on the left) across the specified clusters and malignant cells with high versus low pEpiTd17 program activity. Genes are normalized across all cell clusters in the data set (not only clusters shown). (E) Interactions between CXCR1/2 and cognate chemokines. Clusters with high activity for the co-varying or similar inflammatory gene programs are marked in red. (F) Primary CRC-derived fibroblasts and SNU-407 MMRd CRC cell line were stimulated with 10 ng/ml IL1A, IL1B, IL6, or TNF for 14h or not treated. Transcriptional signatures were determined by RNAseq. Shown are log fold changes compared to unstimulated cells. Data are representative of 2 independent experiments each. (G) Representative RNA ISH/IF image shows accumulations of neutrophils (CD66b-IF), IL1B and CXCL1 ISH signals at the malignant interface (EPCAM-ISH) with the colonic lumen. Myeloid cells are marked by TYROBP-ISH. Scale bar: 100um. Right, quantification of cell phenotypes in 8 CRC specimens (one clinical paraffin block did not contain luminal margin) shows IL1B, CXCL1, and neutrophil (CD66b) signals enriched in the luminal margin, defined as ≤ 360 um from the luminal border of the tumor. Paired two-tailed t-test. Patient C110 does not show CD66b enrichment at the luminal margin. See also Figure S6 and Tables S5 and S6.
Figure 7:
Figure 7:. A coordinated network of CXCL13+ T cells with myeloid and malignant cells expressing ISGs.
(A) Hub 6 in MMRd specimens (left) and projected onto MMRp specimens (right). Node size is proportional to the log ratio of mean program activities in MMRd or MMRp vs. normal. Edge thickness is proportional to co-variation. Pink lines depict positive, blue lines negative correlations. Non-significant edges are depicted as dotted lines. (B) Overlap of top weighted genes (left) and predicted transcription factors (right) for ISG programs in T/NK/ILC, myeloid, stromal, and malignant compartments. (C) Image shows a portion of the tissue from patient C110 with regions selected for spatially-indexed transcriptomics (GeoMx DSP CTA). ~45 regions of interest (ROIs) per specimen were sampled and each ROI was auto-segmented into PanCK-positive and -negative regions. Scale bar: 500 um. (D) Three CRC specimens with high CXCL13 activity (C110, C132, and C107) were analyzed by spatially-indexed transcriptomics (GeoMx DSP CTA) as described in (C). CXCL13 signal in PanCK-negative regions was correlated to an ISG/MHCII signal score (STAR Methods) in the paired PanCK-pos regions (Spearman correlation). (E) Quantification of NanoString GeoMx DSP CTA assay showing high IDO1 expression in malignant cells of patient C110, and high CD38 expression in malignant cells of C132, consistent with scRNAseq data (heatmap, log2(TP10K+1)). Right: Spearman correlation between IDO1 (top) or CD38 (bottom) expression and ISG scores (as calculated in D) in malignant cells of the respective patients. (F) All chemokines present in the top genes of the depicted NMF-based programs (indicated by black dot at left) as expressed in the depicted clusters and malignant cells with high versus low pEpiTd19 program activity. Genes are normalized across all cell clusters in the data set (not only the clusters shown). (G) GeoMx DSP CTA assay as in (D) showing Spearman correlation of CXCL13 signal in PanCK-negative regions with CXCR3 ligand expression (i.e. sum of CXCL9, CXCL10, CXCL11) in the paired PanCK-positive regions. (H) PanCK-IF, CD3E-ISH, CXCL10/CXCL11-ISH, CXCL13-ISH, and IFNG-ISH was performed on 9 tumor tissue slides from different donors (MMRd n=5: C110, C123, C132, C139, C144; MMRp n=4: C103, C112, C126, C107). Cells were phenotyped using Halo software. An image section from C123 is shown (top), a computational rendering of the same section (middle left) and the full slide (middle right). Cells were characterized by a 100μm neighborhood and clustered by their neighborhood features to identify ‘foci’ and ‘no foci’. Scale bar: 100um. (I) Based on the approach in (H), % of the indicated phenotype (p: positive; n: negative) among either all DAPI+ cells or the DAPI+ cells within the foci were calculated. CXCL10/CXCL11p, CD3Ep, CXCL13p, and IFNGp cells are significantly enriched in foci. (J) Distances were calculated from CXCL10/CXCL11-positive cells to the indicated phenotypes (mean distance across 100um neighborhoods) outside or inside the foci. If a phenotype was not observed in the 100um neighborhood, the distance was set to 150um. (K) % of cells within foci (among all DAPI+ cells) was correlated to scRNAseq-based pTNI18 and pEpiTd19 activities from the respective specimens (Spearman correlation). See also Figure S7 and Tables S5-7.

References

    1. André T, Shiu K-K, Kim TW, Jensen BV, Jensen LH, Punt C, Smith D, Garcia-Carbonero R, Benavides M, Gibbs P, et al. (2020). Pembrolizumab in Microsatellite-Instability-High Advanced Colorectal Cancer. N. Engl. J. Med 383, 2207–2218. - PubMed
    1. Ayers M, Lunceford J, Nebozhyn M, Murphy E, Loboda A, Kaufman DR, Albright A, Cheng JD, Kang SP, Shankaran V, et al. (2017). IFN-γ-related mRNA profile predicts clinical response to PD-1 blockade. J. Clin. Invest 127, 2930–2940. - PMC - PubMed
    1. Benci JL, Xu B, Qiu Y, Wu TJ, Dada H, Twyman-Saint Victor C, Cucolo L, Lee DSM, Pauken KE, Huang AC, et al. (2016). Tumor Interferon Signaling Regulates a Multigenic Resistance Program to Immune Checkpoint Blockade. Cell 167, 1540–1554.e12. - PMC - PubMed
    1. Bielecki P, Riesenfeld SJ, Kowalczyk MS, Amezcua Vesely MC, Kroehling L, Yaghoubi P, Dionne D, Jarret A, Steach HR, McGee HM, et al. (2018). Skin inflammation driven by differentiation of quiescent tissue-resident ILCs into a spectrum of pathogenic effectors.
    1. Boland CR, and Goel A. (2010). Microsatellite instability in colorectal cancer. Gastroenterology 138, 2073–2087.e3. - PMC - PubMed

Publication types

MeSH terms