

Worldwide trends in hypertension prevalence and progress in treatment and control from 1990 to 2019: a pooled analysis of 1201 population-representative studies with 104 million participants
- PMID: 34450083
- PMCID: PMC8446938
- DOI: 10.1016/S0140-6736(21)01330-1
Worldwide trends in hypertension prevalence and progress in treatment and control from 1990 to 2019: a pooled analysis of 1201 population-representative studies with 104 million participants
Erratum in
-
Department of Error.Lancet. 2022 Feb 5;399(10324):520. doi: 10.1016/S0140-6736(22)00061-7. Lancet. 2022. PMID: 35123692 Free PMC article. No abstract available.
Abstract
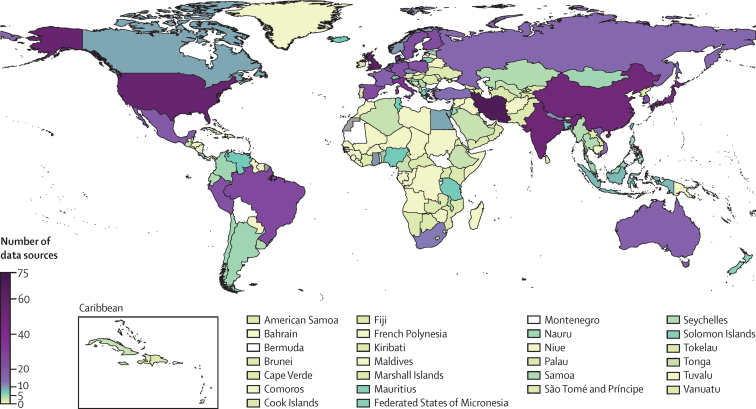
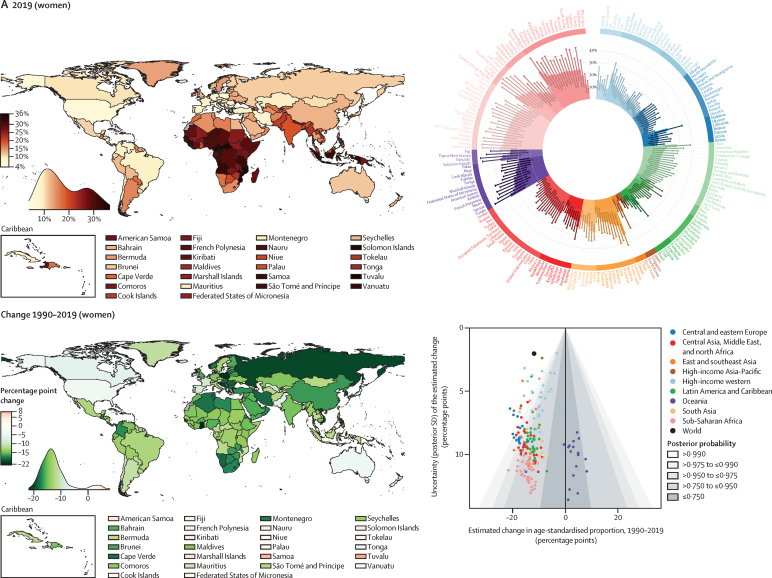
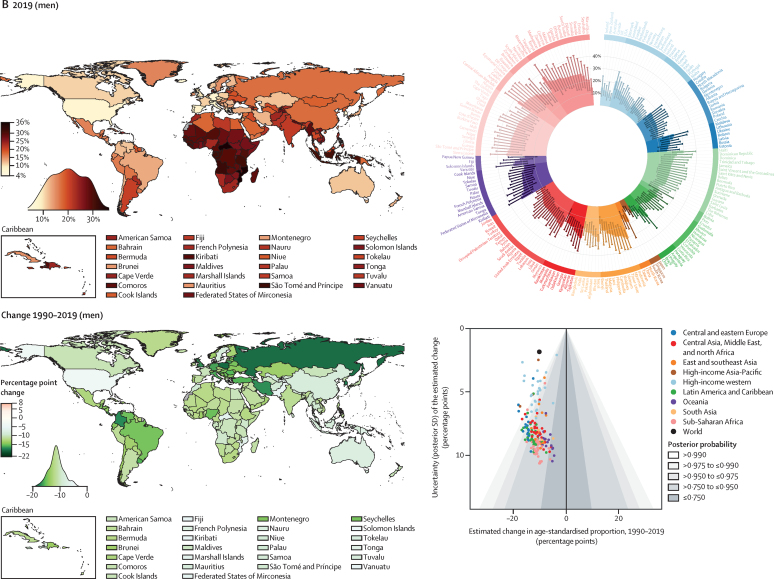
Background: Hypertension can be detected at the primary health-care level and low-cost treatments can effectively control hypertension. We aimed to measure the prevalence of hypertension and progress in its detection, treatment, and control from 1990 to 2019 for 200 countries and territories.
Methods: We used data from 1990 to 2019 on people aged 30-79 years from population-representative studies with measurement of blood pressure and data on blood pressure treatment. We defined hypertension as having systolic blood pressure 140 mm Hg or greater, diastolic blood pressure 90 mm Hg or greater, or taking medication for hypertension. We applied a Bayesian hierarchical model to estimate the prevalence of hypertension and the proportion of people with hypertension who had a previous diagnosis (detection), who were taking medication for hypertension (treatment), and whose hypertension was controlled to below 140/90 mm Hg (control). The model allowed for trends over time to be non-linear and to vary by age.
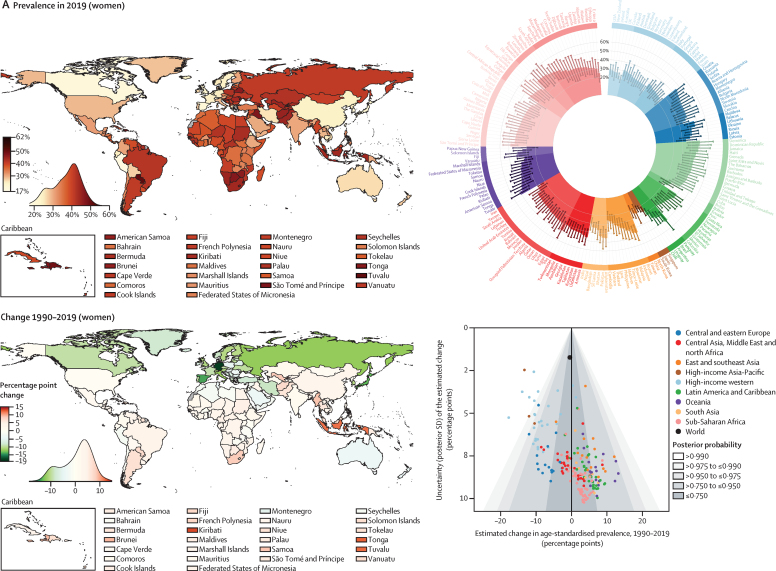
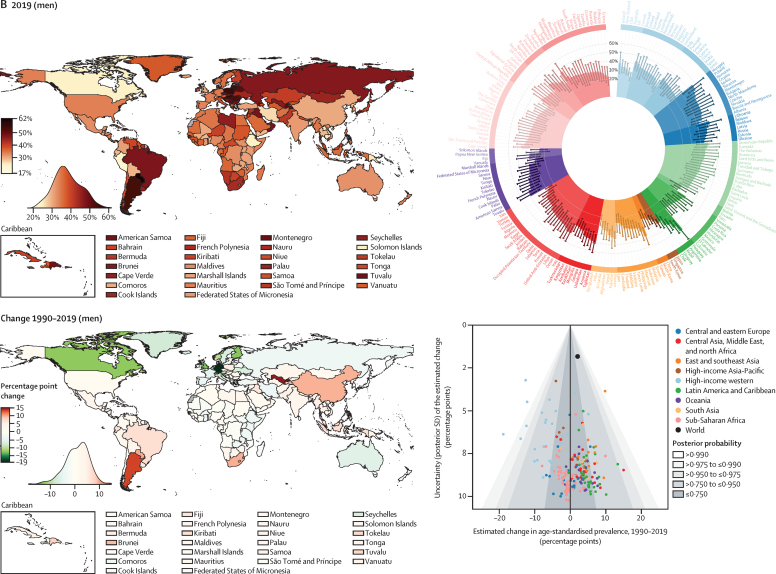
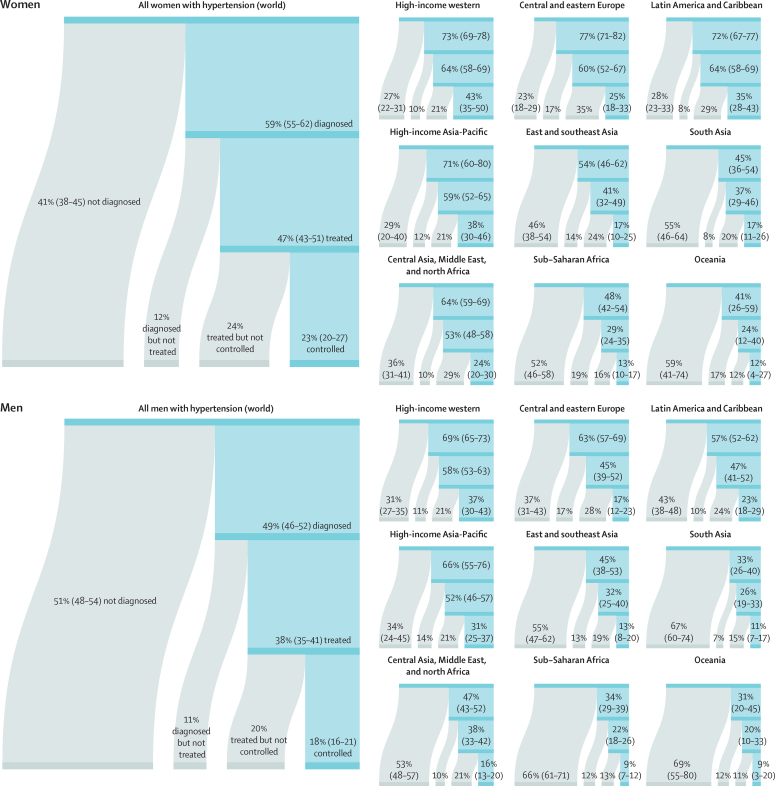
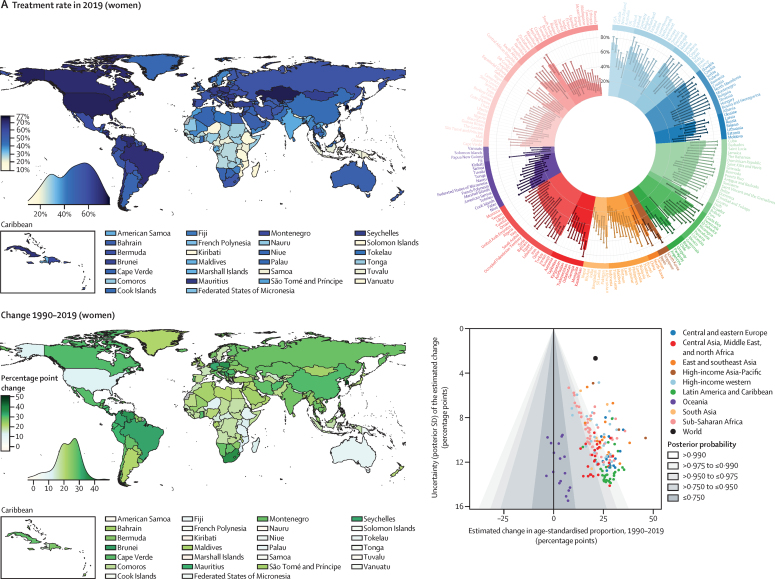
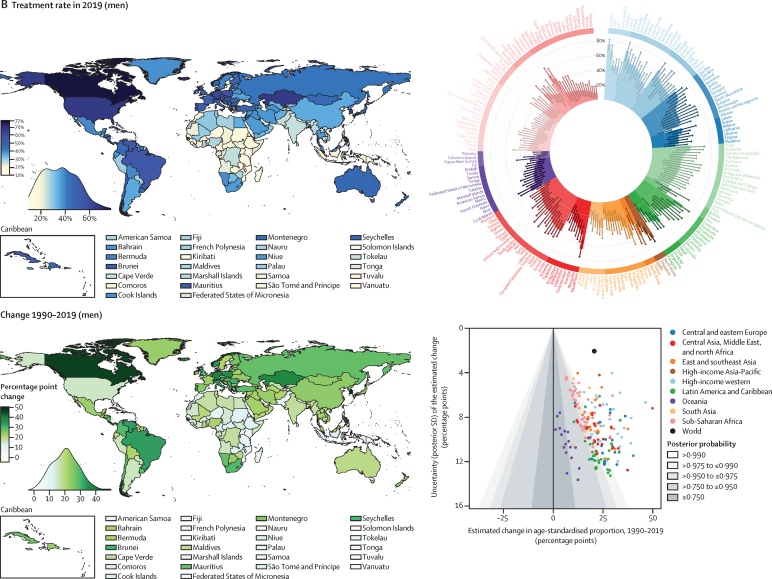
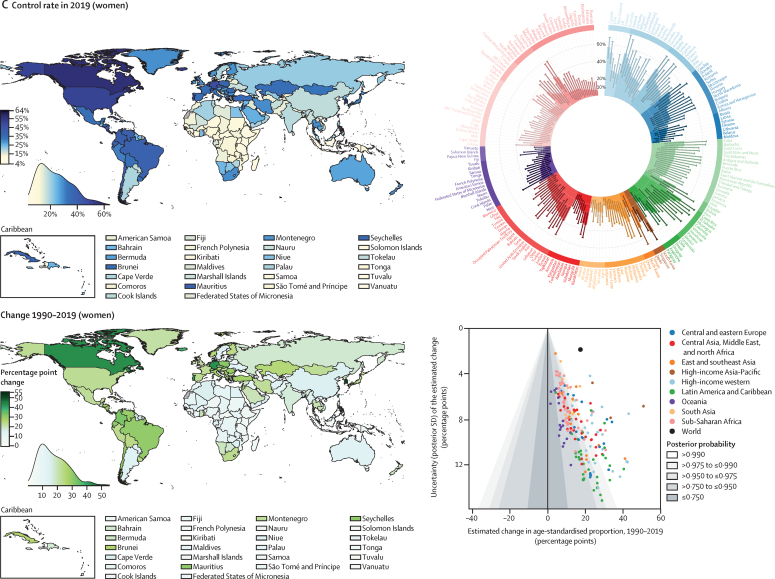
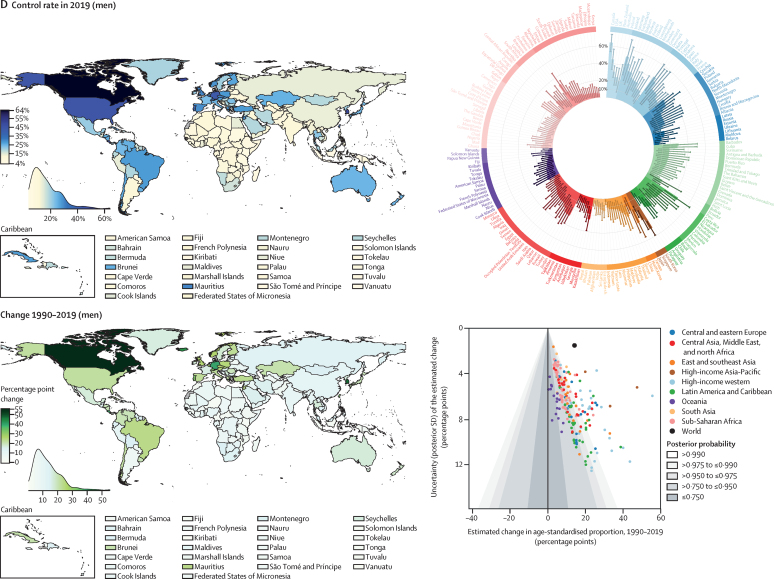
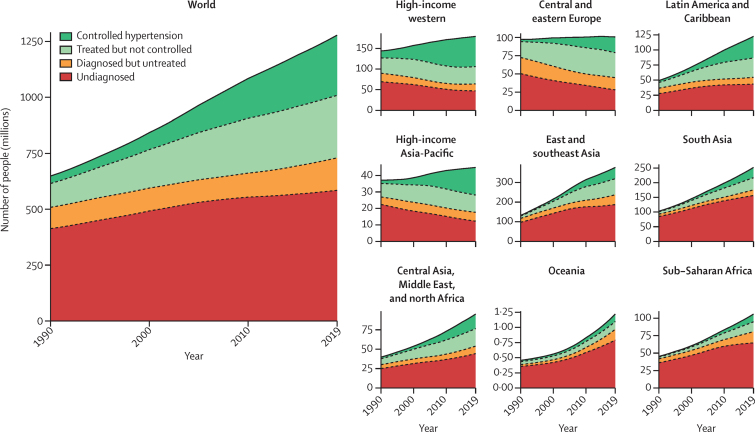
Findings: The number of people aged 30-79 years with hypertension doubled from 1990 to 2019, from 331 (95% credible interval 306-359) million women and 317 (292-344) million men in 1990 to 626 (584-668) million women and 652 (604-698) million men in 2019, despite stable global age-standardised prevalence. In 2019, age-standardised hypertension prevalence was lowest in Canada and Peru for both men and women; in Taiwan, South Korea, Japan, and some countries in western Europe including Switzerland, Spain, and the UK for women; and in several low-income and middle-income countries such as Eritrea, Bangladesh, Ethiopia, and Solomon Islands for men. Hypertension prevalence surpassed 50% for women in two countries and men in nine countries, in central and eastern Europe, central Asia, Oceania, and Latin America. Globally, 59% (55-62) of women and 49% (46-52) of men with hypertension reported a previous diagnosis of hypertension in 2019, and 47% (43-51) of women and 38% (35-41) of men were treated. Control rates among people with hypertension in 2019 were 23% (20-27) for women and 18% (16-21) for men. In 2019, treatment and control rates were highest in South Korea, Canada, and Iceland (treatment >70%; control >50%), followed by the USA, Costa Rica, Germany, Portugal, and Taiwan. Treatment rates were less than 25% for women and less than 20% for men in Nepal, Indonesia, and some countries in sub-Saharan Africa and Oceania. Control rates were below 10% for women and men in these countries and for men in some countries in north Africa, central and south Asia, and eastern Europe. Treatment and control rates have improved in most countries since 1990, but we found little change in most countries in sub-Saharan Africa and Oceania. Improvements were largest in high-income countries, central Europe, and some upper-middle-income and recently high-income countries including Costa Rica, Taiwan, Kazakhstan, South Africa, Brazil, Chile, Turkey, and Iran.
Interpretation: Improvements in the detection, treatment, and control of hypertension have varied substantially across countries, with some middle-income countries now outperforming most high-income nations. The dual approach of reducing hypertension prevalence through primary prevention and enhancing its treatment and control is achievable not only in high-income countries but also in low-income and middle-income settings.
Funding: WHO.
Copyright © 2021 World Health Organization; licensee Elsevier. This is an Open Access article published under the CC BY 3.0 IGO license which permits unrestricted use, distribution, and reproduction in any medium, provided the original work is properly cited. In any use of this article, there should be no suggestion that WHO endorses any specific organisation, products or services. The use of the WHO logo is not permitted. This notice should be preserved along with the article's original URL.
Conflict of interest statement
Declaration of interests RC reports grants from the Ministry of Health of the Czech Republic; and personal fees from Herbacos Recordati, Amegen, and Krka, outside the submitted work. GD reports consulting fees from Vital Strategies; and an honorarium from the American College of Cardiology, outside the submitted work. ME reports a charitable grant from the AstraZeneca Young Health Programme; and personal fees from Prudential, outside the submitted work. CJP reports holding stocks in Pfizer, outside the submitted work. JS reports ownership in companies providing services to Itrim, Amgen, Janssen, Novo Nordisk, Eli Lily, Boehringer Ingelheim, Bayer, Pfizer, and AstraZeneca, outside the submitted work. MW reports personal fees from Amgen, Kyowa Kirin and Freeline, outside the submitted work. All other authors declare no competing interests.
Figures
Comment in
-
Global and national high blood pressure burden and control.Lancet. 2021 Sep 11;398(10304):932-933. doi: 10.1016/S0140-6736(21)01688-3. Epub 2021 Aug 24. Lancet. 2021. PMID: 34450082 No abstract available.
-
A social dimension for brain health: the mounting pressure.Lancet Neurol. 2021 Oct;20(10):773. doi: 10.1016/S1474-4422(21)00295-7. Lancet Neurol. 2021. PMID: 34536394 No abstract available.
References
-
- Olsen MH, Angell SY, Asma S. A call to action and a lifecourse strategy to address the global burden of raised blood pressure on current and future generations: the Lancet Commission on hypertension. Lancet. 2016;388:2665–2712. - PubMed
-
- WHO . World Health Organization; Geneva: 2019. WHO model list of essential medicines (21st list)https://apps.who.int/iris/bitstream/handle/10665/325771/WHO-MVP-EMP-IAU-...
-
- Ettehad D, Emdin CA, Kiran A. Blood pressure lowering for prevention of cardiovascular disease and death: a systematic review and meta-analysis. Lancet. 2016;387:957–967. - PubMed
Publication types
MeSH terms
Substances
Grants and funding
- K43 TW010698/TW/FIC NIH HHS/United States
- MC_PC_21000/MRC_/Medical Research Council/United Kingdom
- BHF_/British Heart Foundation/United Kingdom
- MC_PC_21001/MRC_/Medical Research Council/United Kingdom
- MC_UP_A620_1014/MRC_/Medical Research Council/United Kingdom
- MC_UU_12011/3/MRC_/Medical Research Council/United Kingdom
- MC_UU_00017/1/MRC_/Medical Research Council/United Kingdom
- T32 HL098048/HL/NHLBI NIH HHS/United States
- G0400519/MRC_/Medical Research Council/United Kingdom
- MC_UU_00006/1/MRC_/Medical Research Council/United Kingdom
- MC_UP_A620_1016/MRC_/Medical Research Council/United Kingdom
LinkOut - more resources
Full Text Sources
Other Literature Sources
Medical
