. 2021 Oct 10:338:505-526.
doi: 10.1016/j.jconrel.2021.08.038. Epub 2021 Aug 24.

Microvesicles transfer mitochondria and increase mitochondrial function in brain endothelial cells

Affiliations

Microvesicles transfer mitochondria and increase mitochondrial function in brain endothelial cells

Anisha D'Souza et al. J Control Release. .

Abstract

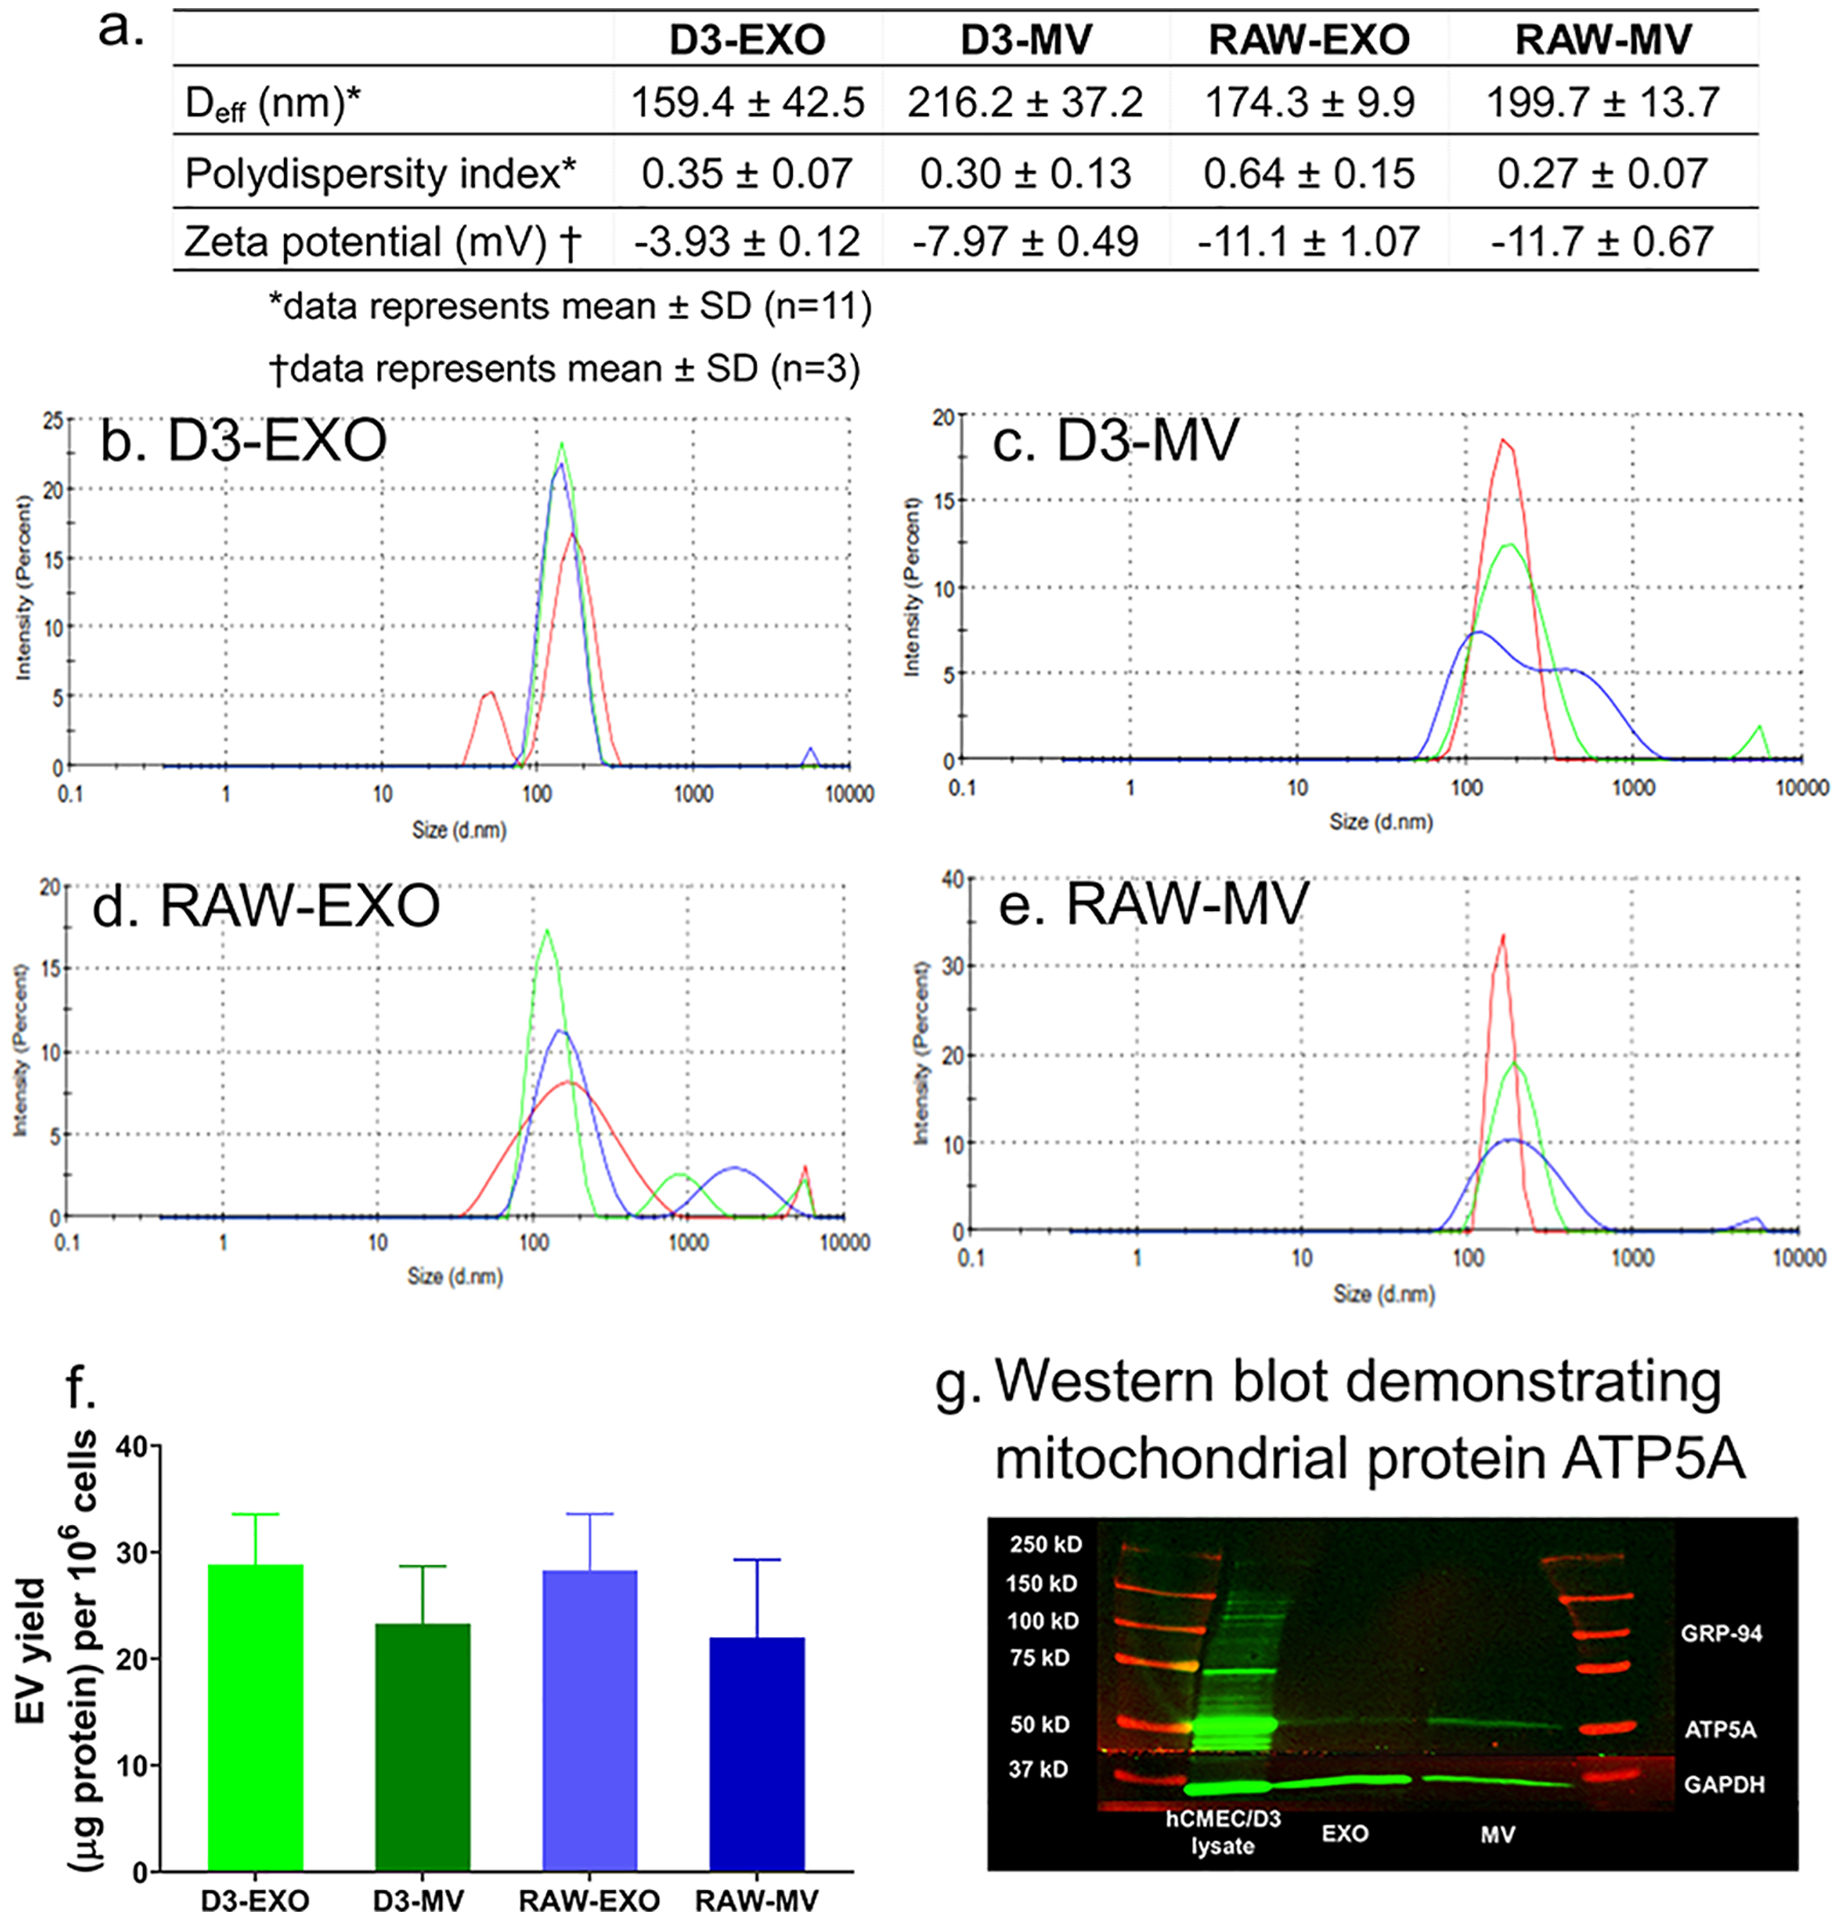
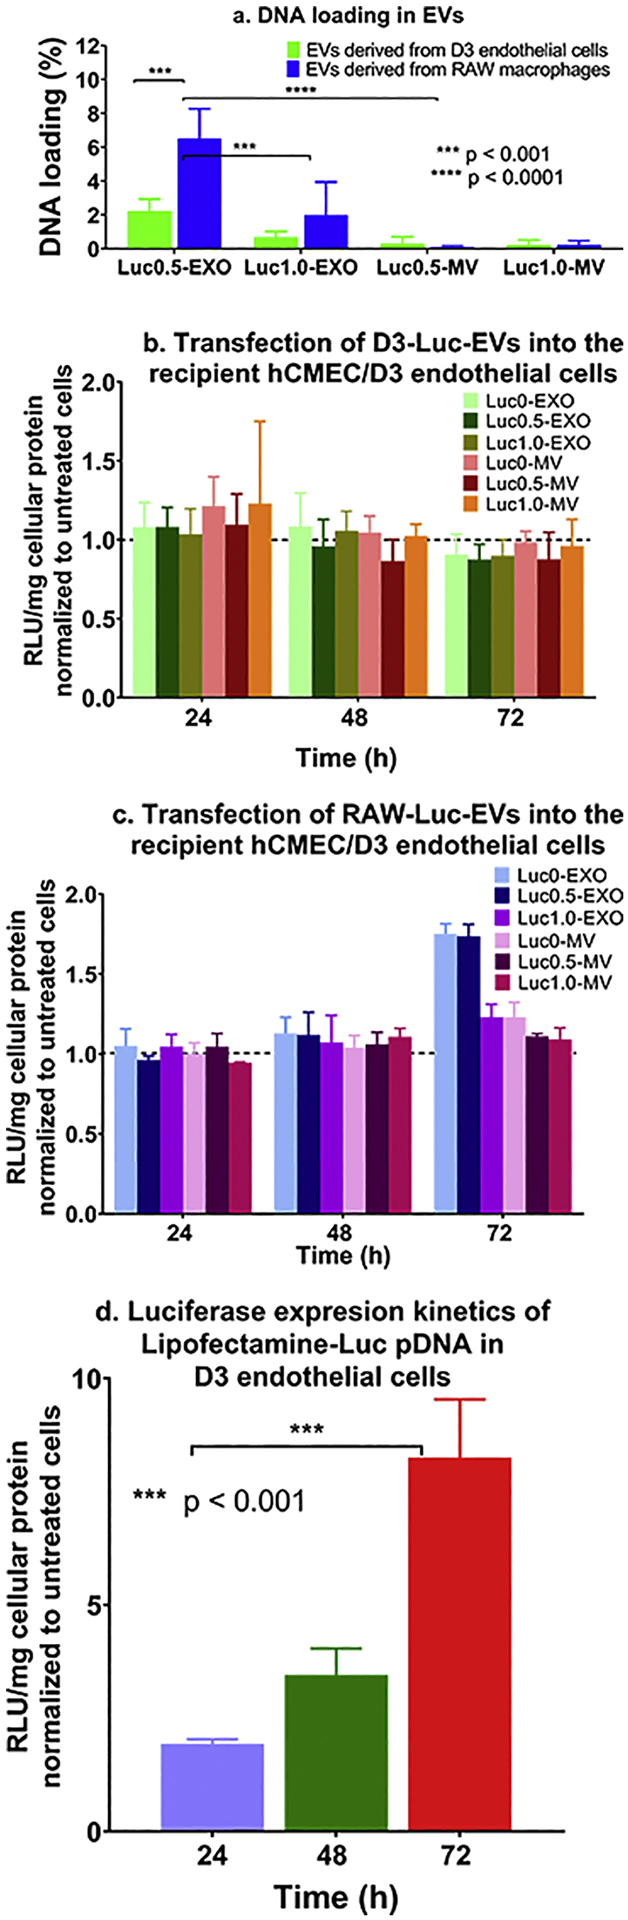
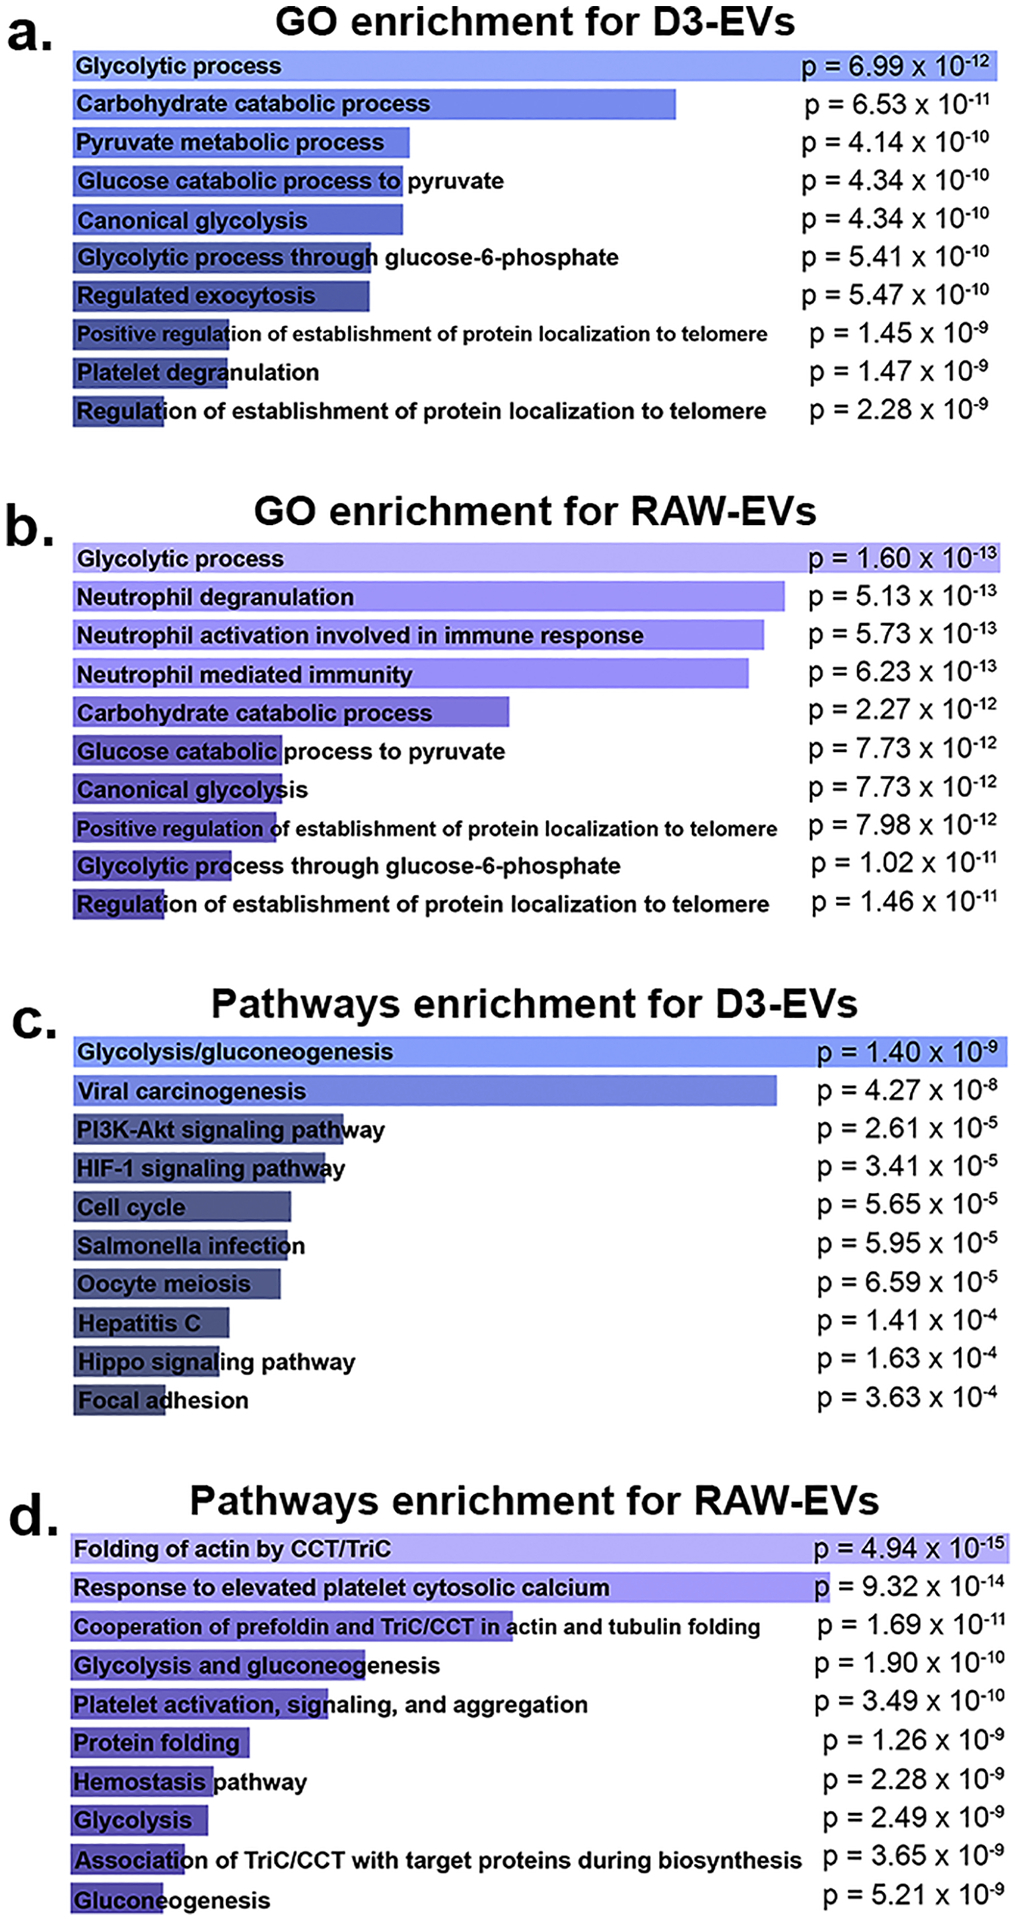
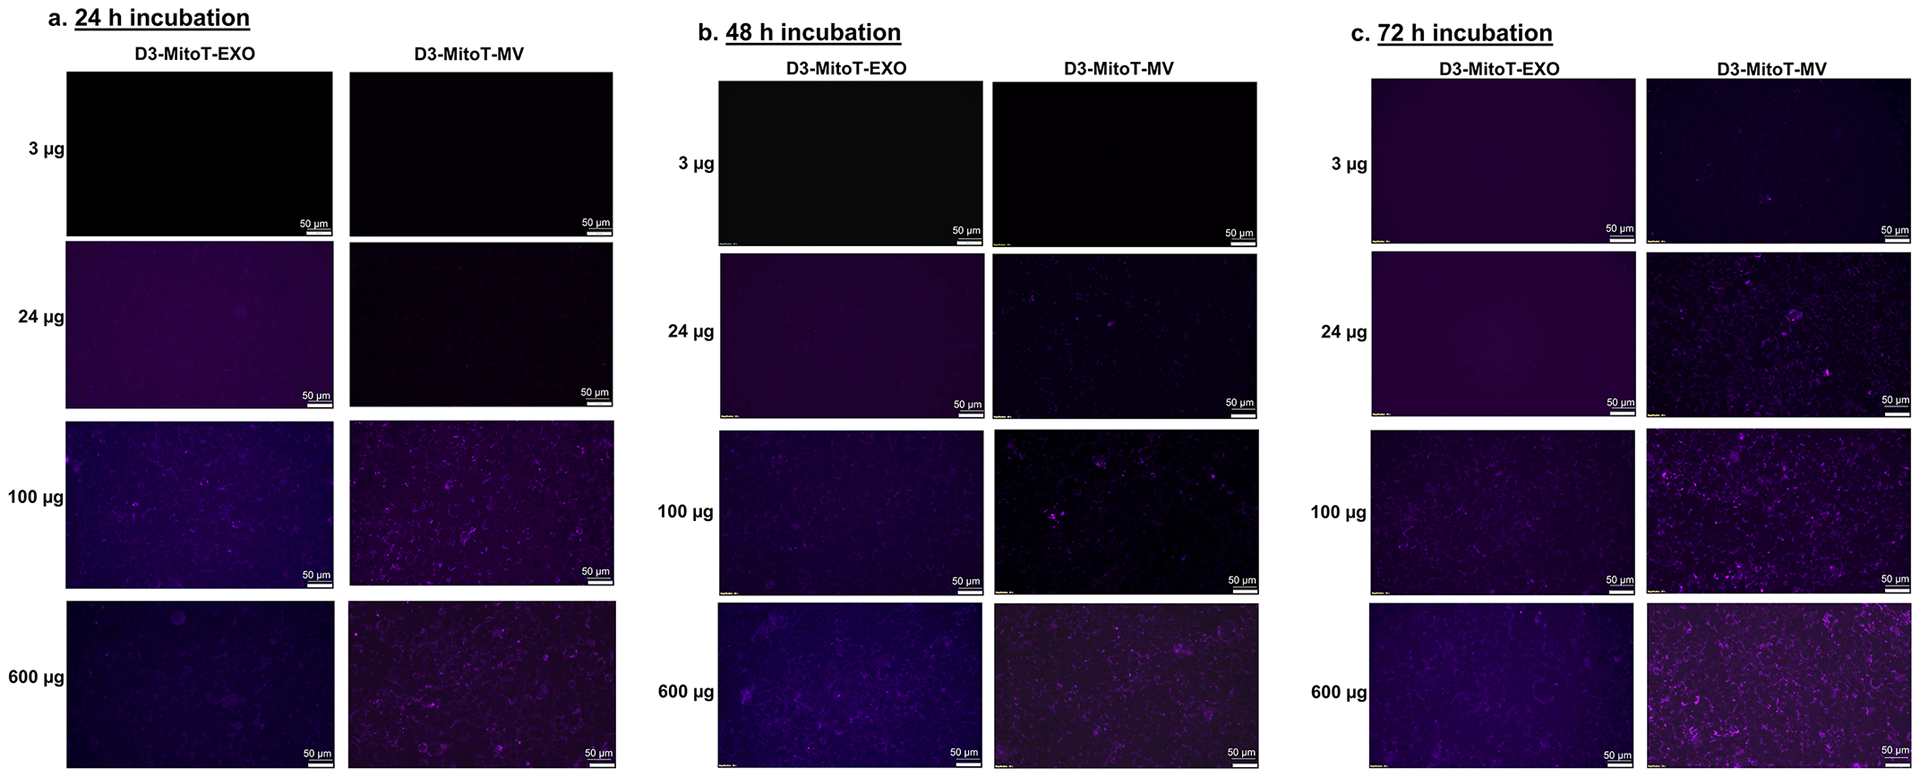
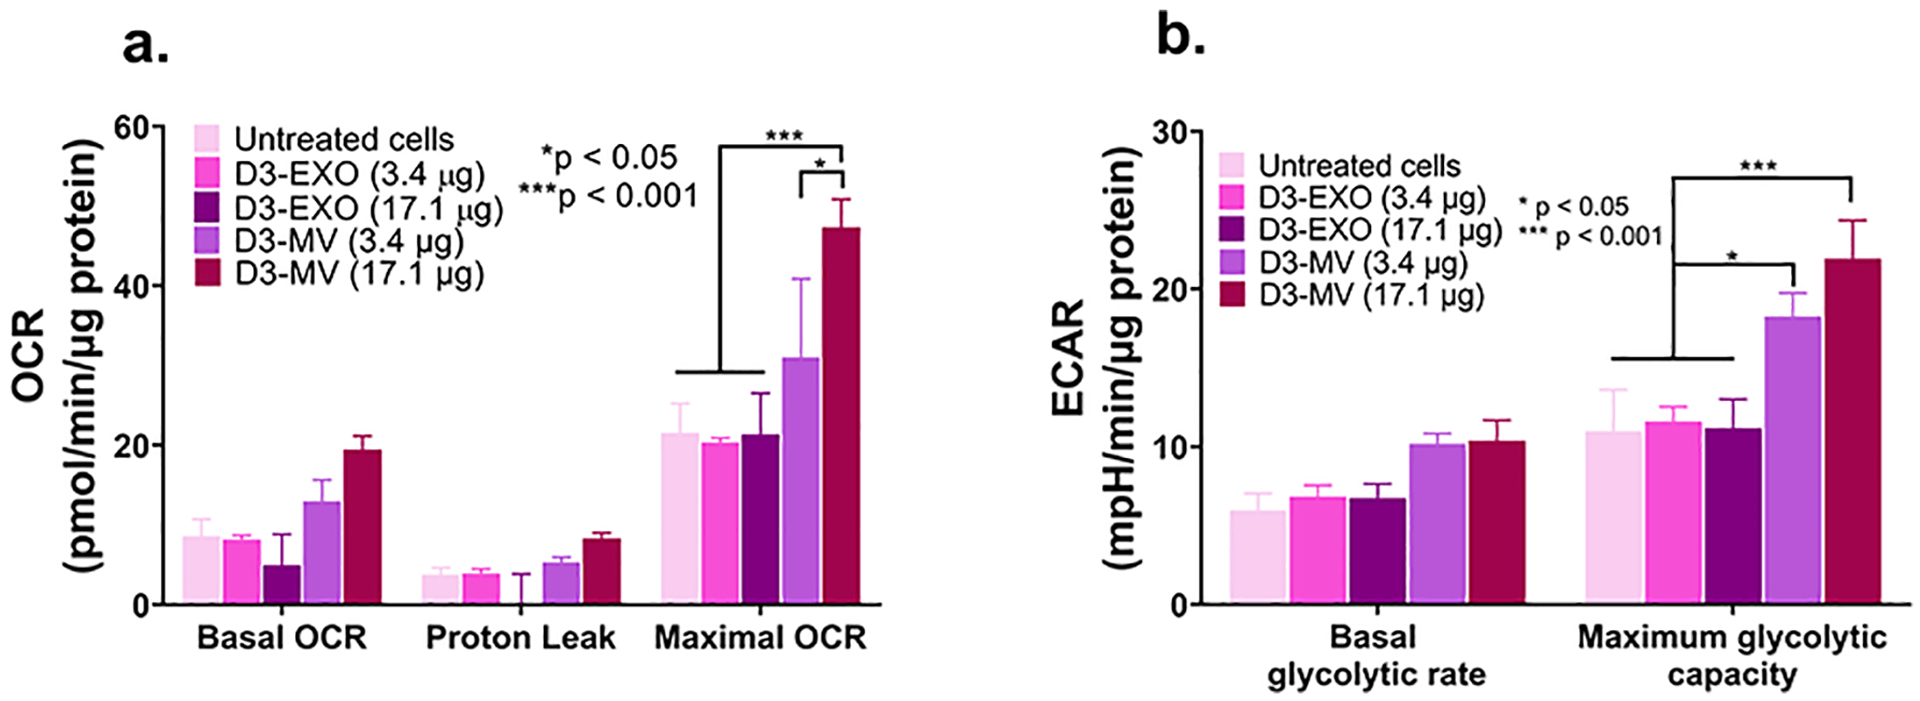
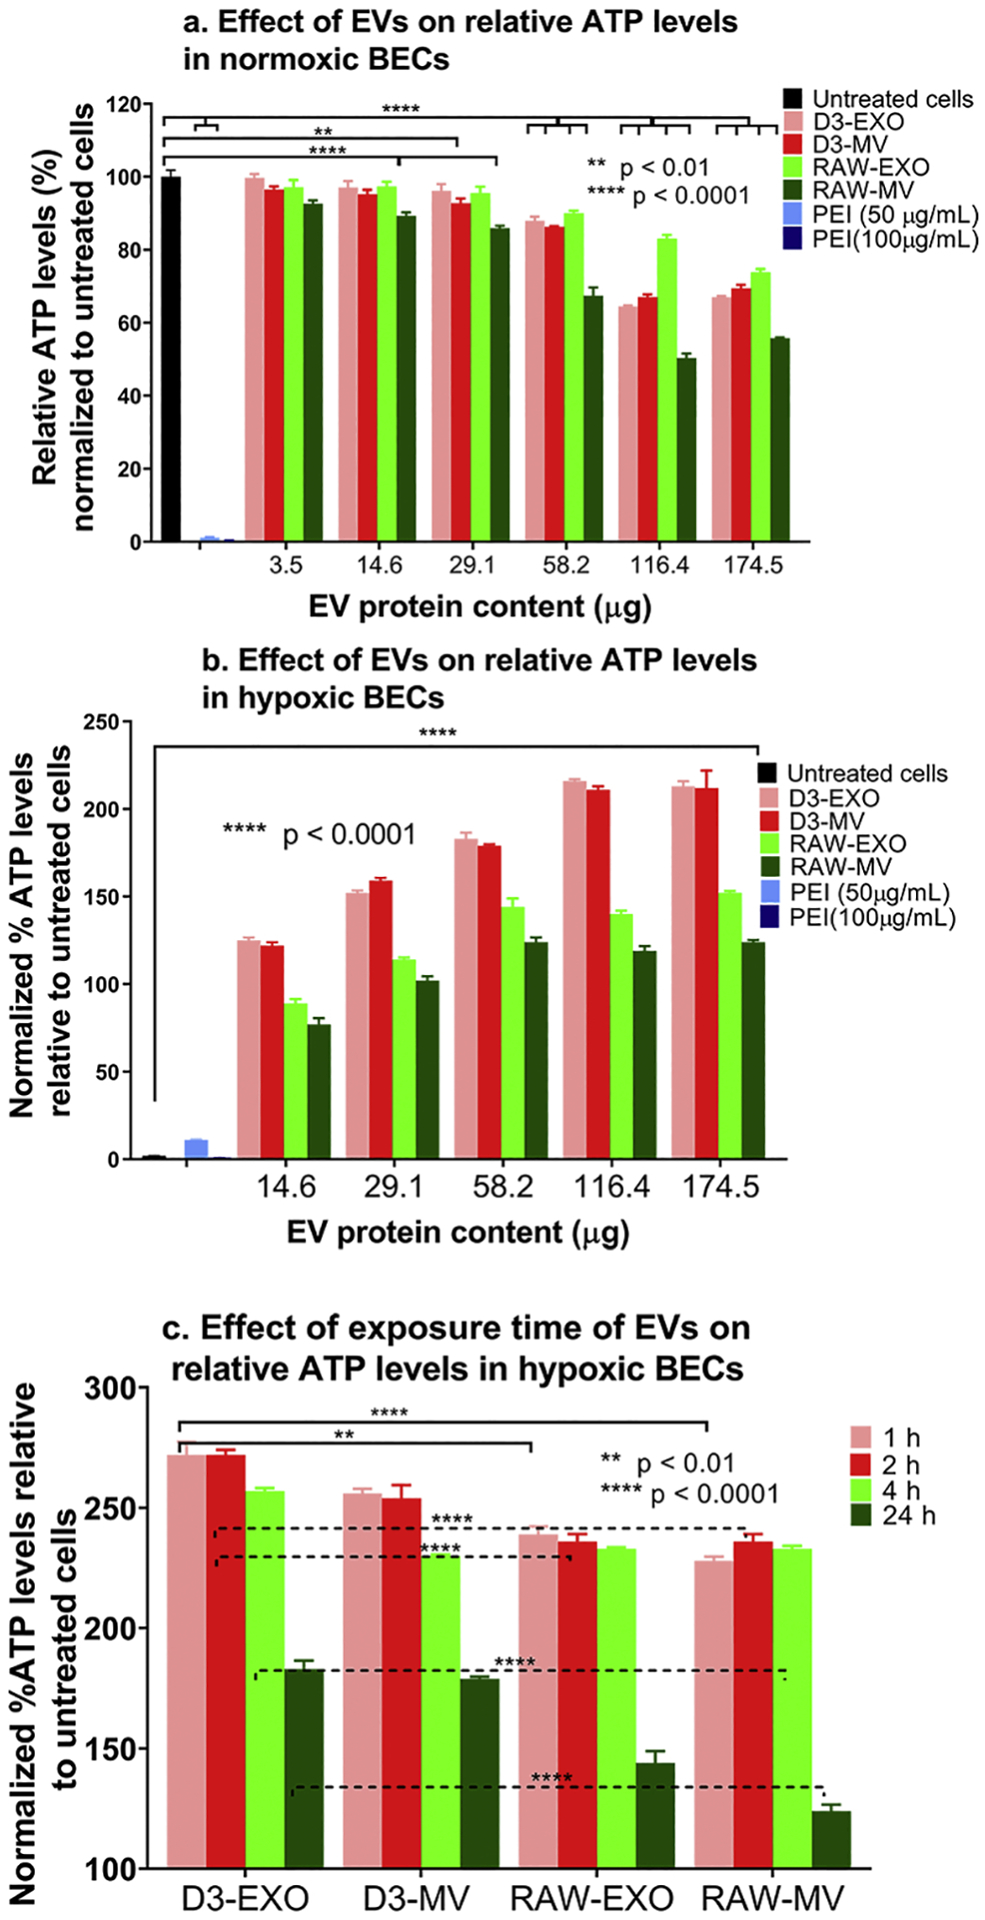
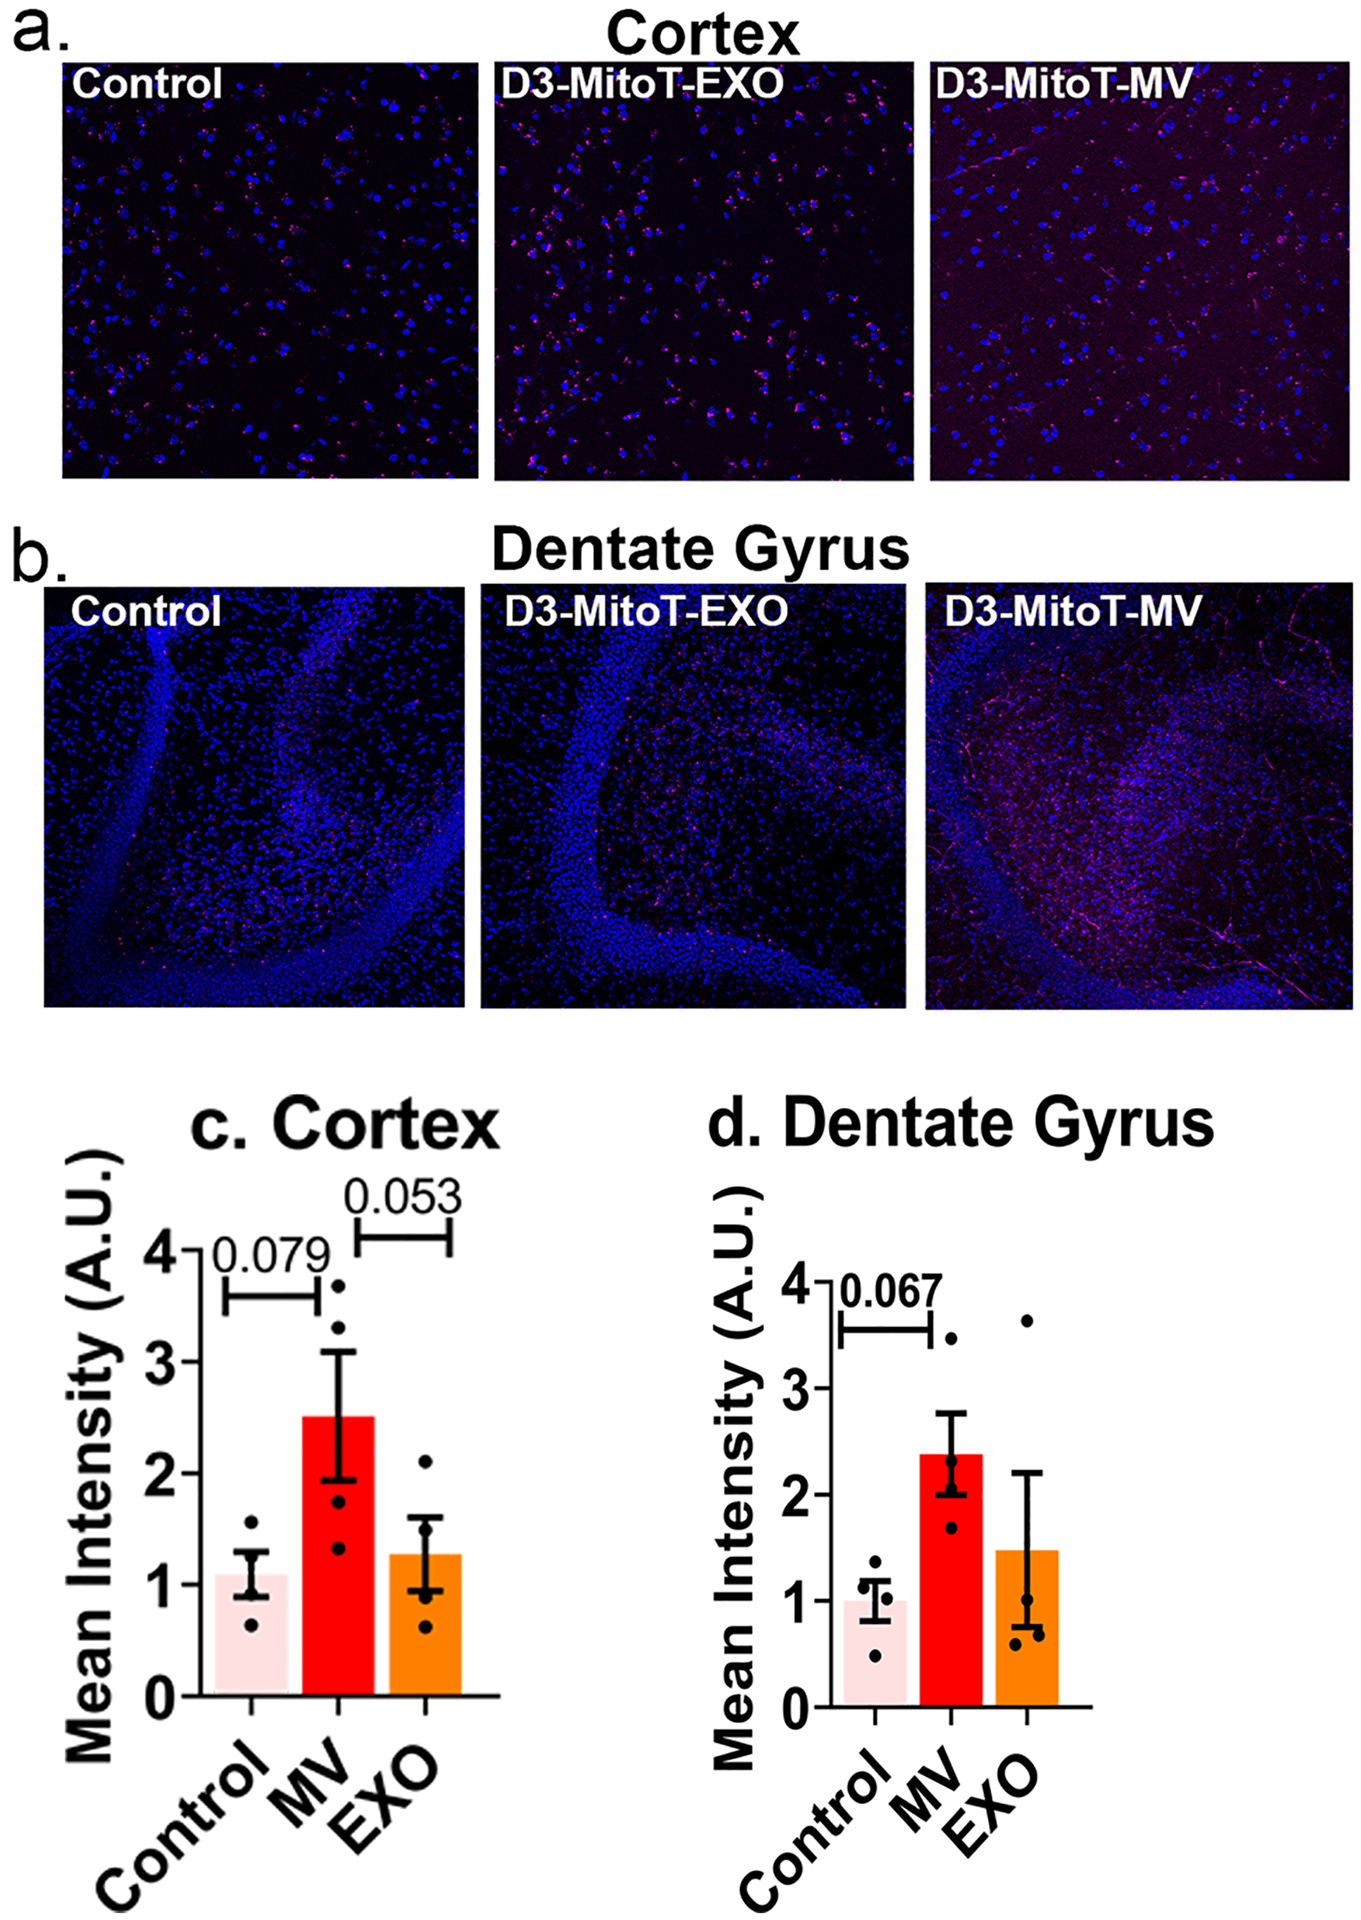
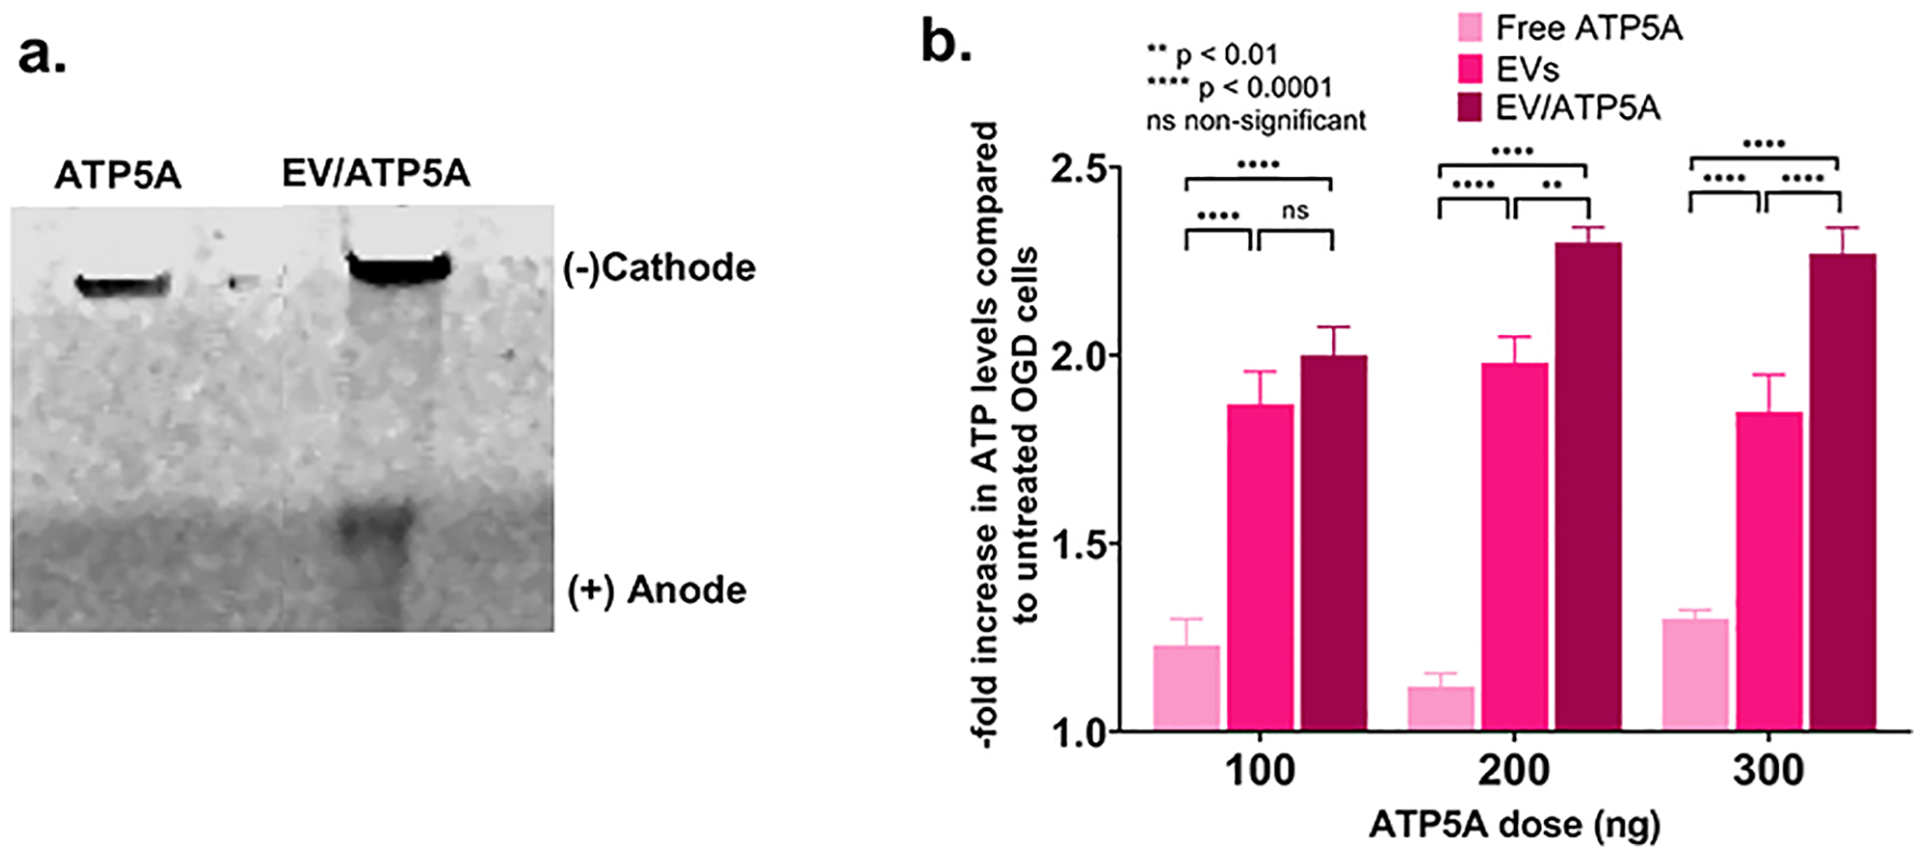
We have demonstrated, for the first time that microvesicles, a sub-type of extracellular vesicles (EVs) derived from hCMEC/D3: a human brain endothelial cell (BEC) line transfer polarized mitochondria to recipient BECs in culture and to neurons in mice acute brain cortical and hippocampal slices. This mitochondrial transfer increased ATP levels by 100 to 200-fold (relative to untreated cells) in the recipient BECs exposed to oxygen-glucose deprivation, an in vitro model of cerebral ischemia. We have also demonstrated that transfer of microvesicles, the larger EV fraction, but not exosomes resulted in increased mitochondrial function in hypoxic endothelial cultures. Gene ontology and pathway enrichment analysis of EVs revealed a very high association to glycolysis-related processes. In comparison to heterotypic macrophage-derived EVs, BEC-derived EVs demonstrated a greater selectivity to transfer mitochondria and increase endothelial cell survival under ischemic conditions.

Keywords: BBB protection; Exosomes; Extracellular vesicles; Ischemic stroke; Microvesicles; Mitochondrial function; Mitochondrial transfer.


Conflict of interest statement

Conflicts of interest

There are no conflicts of interest to declare.

Figures

Figure 1.
Figure 1.
Characterization of EVs derived from hCMEC/D3 (D3-EXO and D3-MV) and RAW 264.7 cells (RAW-EXO and RAW-MV). (a) Physicochemical characteristics of EVs: Effective particle diameter (Deff), polydispersity index, and zeta potential were measured using dynamic light scattering (DLS). The samples at a protein concentration of 0.2 – 0.5 mg/mL were resuspended in 1x PBS and 10 mM HEPES buffer, pH 7.4 for Deff and zeta potential measurements, respectively. Representative DLS intensity plots of (b) D3-EXO (c) D3-MV (d) RAW-EXO and (e) RAW-MV obtained from measurements on a Malvern Nano Zetasizer. The different traces indicate three measurements of the same sample. (f) EV yield normalized to per million cells of hCMEC/D3 or RAW 264.7 (g) Western blotting to confirm mitochondria-specific EV markers. 25 μg total protein was loaded in a 4–10% SDS gel and electrophoresed at 120 V. The separated proteins were transferred on nitrocellulose membrane and stained with ATP5A and GAPDH antibodies. The blots were imaged on Odyssey imager (LI COR Inc., Lincoln, NE) at 800 nm near-infrared channel and processed using ImageStudio 5.2 software.
Figure 2.
Figure 2.
Measurement of DNA content in Luc pDNA-loaded EVs derived from hCMEC/D3 endothelial cells and RAW 264.7 macrophages and their transfection activity in the recipient hCMEC/D3 endothelial cells. hCMEC/D3 endothelial and RAW 264.7 macrophages were transfected with Lipofectamine-Luc pDNA at a pDNA dose of 0.5 μg/ or 1.0 μg/well in a 24–well-plate (n = 3). (a) The percent Luc-DNA loading in the isolated EVs was measured by Quant-iT Picogreen dsDNA assay using Equation 1 (b) Transfection of D3-derived Luc EVs, (c) RAW-derived Luc-EVs and (d) Lipofectamine/Luc pDNA complexes into the recipient hCMEC/D3 endothelial cells at a DNA dose of 10 ng of DNA/well (n = 4). Luciferase gene expression was expressed as Relative light units (RLU) normalized to total cellular protein content and further normalized to values from the control, untreated cells. Data are presented as mean ± SD (n = 4), *p < 0.05, **p < 0.01, ***p < 0.001, ****p < 0.0001 by two-way ANOVA of the indicated groups and Bonferroni’s multiple comparisons test.
Figure 3.
Figure 3.
GO and pathway enrichment analyses revealed RAW- and D3-EVs overexpress glycolytic processes. The Enrichr web service was used to analyze enriched pathways and GO terms within the two gene sets for RAW- and D3-EVs. Gene ontology analysis using the 34-gene set for D3-EVs and 42-gene set for RAW-EVs showed that GO terms surrounding glycolytic process are greatly overexpressed in the D3 cells (p = 6.99 × 10⁻¹²) (a), while in addition to glycolytic terms, there were a significant amount of neutrophil-related GO terms (p = 5.13 × 10⁻¹³) in RAW-EVs (b). Pathway analysis results indicated that glycolysis pathways were overexpressed in both D3- and RAW-EVs (p = 1.4 × 10⁻⁹ and 1.9 × 10⁻¹⁰). p-values were calculated using Fisher’s exact test.
Figure 4.
Figure 4.
Transfer of Mitotracker-labelled mitochondria from hCMEC/D3-derived EVs to the recipient hCMEC/D3 endothelial cells. The donor/source hCMEC/D3 endothelial cells were stained with MitoTracker Deep-Red (MitoT) (250 nM for 30 min) to specifically label polarized mitochondria following which the MitoT-EVs were isolated from conditioned media. The recipient hCMEC/D3 endothelial cells were treated with D3-MitoT-EXO and D3-MitoT-MV at the indicated protein doses and observed under an Olympus IX 73 epifluorescent inverted microscope (Olympus, Pittsburgh, PA) under the Cy5 channel settings at 24 h, 48 h and 72 h post-treatment. The presented data are representative images from three independent experiments (n=4 per experiment). Scale bar = 50 μm.
Figure 5.
Figure 5.
MVs increased mitochondrial function in hypoxic brain endothelial cultures. (a) Oxygen consumption and extracellular acidification rates (OCR and ECAR) were measured by treating hypoxic hCMEC/D3 cells with the indicated samples in OGD medium. We used a standard Mitochondrial Stress Test protocol to measure basal OCR followed by the addition of 2.5 μmol/L oligomycin A to measure proton leak and 0.7 μmol/L FCCP to measure maximal OCR. Basal glycolytic rate was calculated by determining the ECAR that is sensitive to 2-DG (100 mmol/L). The assay was performed in non-buffered Dulbecco’s modified Eagle medium supplemented with 25 mmol/L glucose, 1 mM pyruvate, and 2 mmol/L glutamine. All rates were normalized to cellular protein content measured using MicroBCA assay. Data are mean ± SEM, n = 3, *p < 0.05 and ***p < 0.001 as determined using one-way ANOVA Tukey’s multiple comparisons test.
Figure 6.
Figure 6.
Effects of EV exposure on the ATP levels of hCMEC/D3 endothelial cells under normoxic and hypoxic (OGD) conditions. (a) Normoxic hCMEC/D3 endothelial cells were treated with the indicated EV protein content for 72 h. (b) hCMEC/D3 endothelial cells were subjected to 4 h of OGD by exposing the cells in a sealed hypoxia chamber (90% N2, 5% H2, 5% CO2) and glucose-free media at 37 °C in a humidified incubator. OGD exposed hCMEC/D3 endothelial cells were treated with the indicated amounts of naïve D3-EVs and RAW-EVs for 24 h under 21% O2 in a humidified incubator (normoxic conditions). Untreated OGD cells were cultured in glucose-free media under normoxic conditions. (c) Effect of exposure time on the resulting ATP levels in hypoxic hCMEC/D3 endothelial cells. Hypoxic monolayers were treated with the indicated amounts of EVs for the indicated periods. Untreated OGD cells were cultured in glucose-free media 4 h post-OGD under normoxic conditions. Unless indicated otherwise, normoxic cells treated with polyethyleneimine (PEI) for 4 h were considered as a positive control. In all cases, the effects of treatment were determined using an ATP assay. Data are represented as mean ± SD (n = 4). Statistical comparisons to the normoxic/hypoxic groups were made using one-way ANOVA Bonferroni’s multiple comparisons test.
Figure 7.
Figure 7.
Uptake of MitoT-EVs by acute brain slices. Acute cortical and hippocampal slices from mice subjected to sham middle cerebral artery occlusion procedure were left either untreated (control) or incubated in 50 μg/mL of D3-MitoT-EXO or D3-MitoT-MV for 2 h at 37 °C. Slices were fixed, counterstained with Hoechst 33258 (blue), and visualized on a confocal microscope. Intracellular punctate staining within neurons (magenta) and vascular staining were evident in slices from the cortex (a) and dentate gyrus region of the hippocampus (b) in the D3-MitoT-MV treated condition. The control and D3-MitoT-EXO conditions exhibited similar levels of nonspecific staining in both regions (a and b). Mean intensity values were normalized to control slices and statistical analysis was done using GraphPad Prism 9.1.2 software (c and d)
Figure 8.
Figure 8.
Formation of EV/ATP5A complexes confirmed using native gel electrophoresis. (a) Native PAGE analysis of the EV/ATP5A complexes. 0.5 μg of the indicated samples were electrophoresed in a 4–10% of native PAGE gel and the bands were visualized using Bio-safe Coomassie dye. (b) Confluent hCMEC/D3 cells (16,000/well) in 96-well plates were exposed to OGD conditions for 4 h following which the media was replaced with 100 μL of the indicated samples. Cells were incubated for 24 h and washed once in 1x PBS prior to measuring cellular ATP levels using a Cell Glo luminescence assay. Data represent average ± SD (n=4).

References

    1. O’Brien K, Breyne K, Ughetto S, Laurent LC, Breakefield XO, RNA delivery by extracellular vesicles in mammalian cells and its applications, Nature Reviews Molecular Cell Biology 21(10) (2020) 585–606. - PMC - PubMed
    1. Wu P, Zhang B, Ocansey DKW, Xu W, Qian H, Extracellular vesicles: A bright star of nanomedicine, Biomaterials 269 (2021) 120467. - PubMed
    1. de Jong OG, Kooijmans SAA, Murphy DE, Jiang L, Evers MJW, Sluijter JPG, Vader P, Schiffelers RM, Drug Delivery with Extracellular Vesicles: From Imagination to Innovation, Accounts of Chemical Research 52(7) (2019) 1761–1770. - PMC - PubMed
    1. Elsharkasy OM, Nordin JZ, Hagey DW, de Jong OG, Schiffelers RM, Andaloussi SEL, Vader P, Extracellular vesicles as drug delivery systems: Why and how?, Advanced Drug Delivery Reviews 159 (2020) 332–343. - PubMed
    1. Wang J, Chen D, Ho EA, Challenges in the development and establishment of exosome-based drug delivery systems, Journal of Controlled Release 329 (2021) 894–906. - PubMed

Publication types