. 2022 Jan 5;30(1):327-340.
doi: 10.1016/j.ymthe.2021.08.028. Epub 2021 Aug 25.

Ginseng-derived nanoparticles potentiate immune checkpoint antibody efficacy by reprogramming the cold tumor microenvironment

Affiliations

Ginseng-derived nanoparticles potentiate immune checkpoint antibody efficacy by reprogramming the cold tumor microenvironment

Xuan Han et al. Mol Ther. .

Abstract

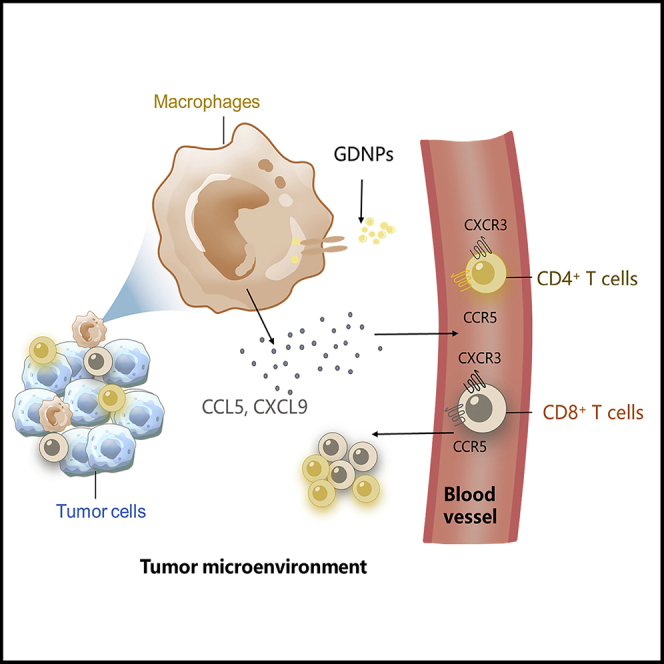
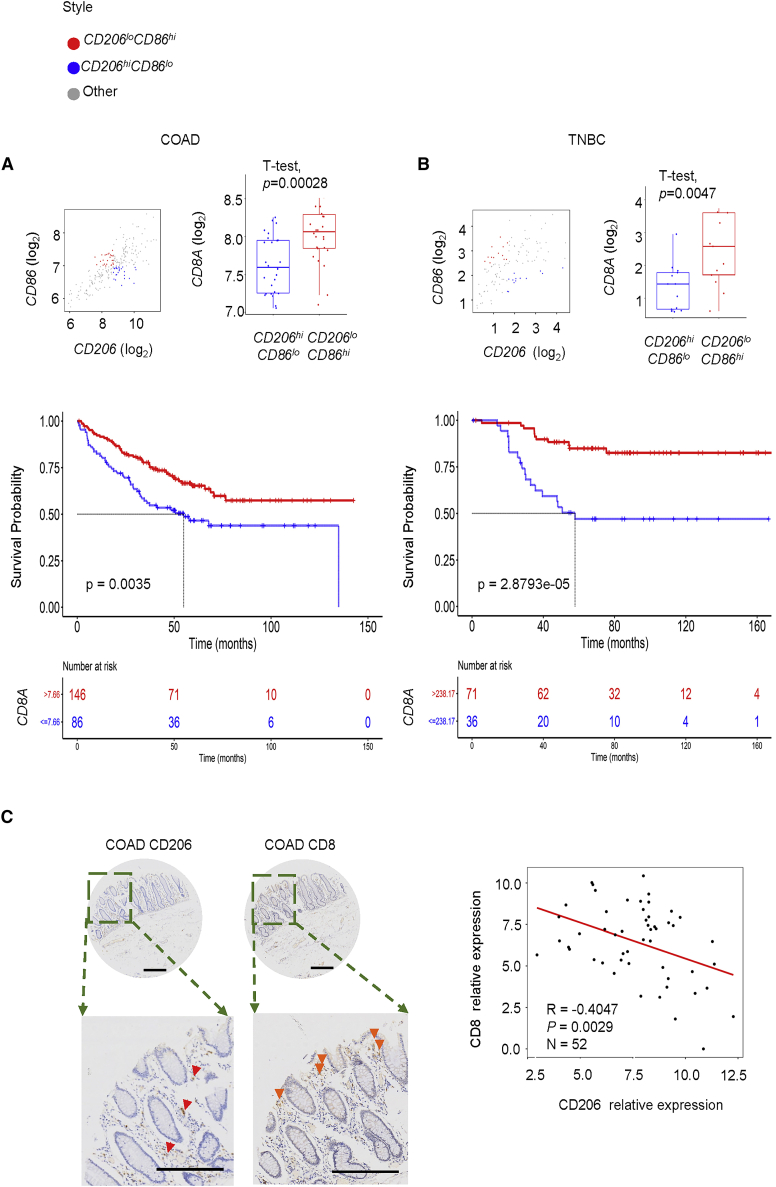
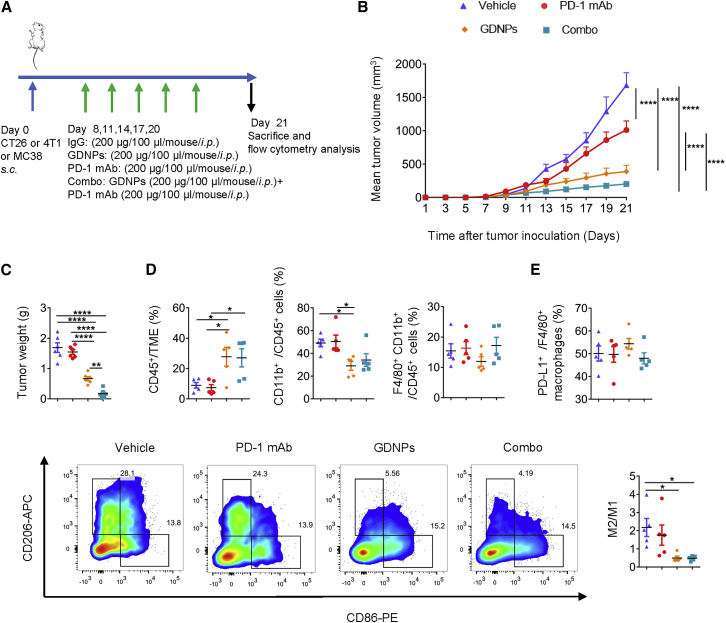
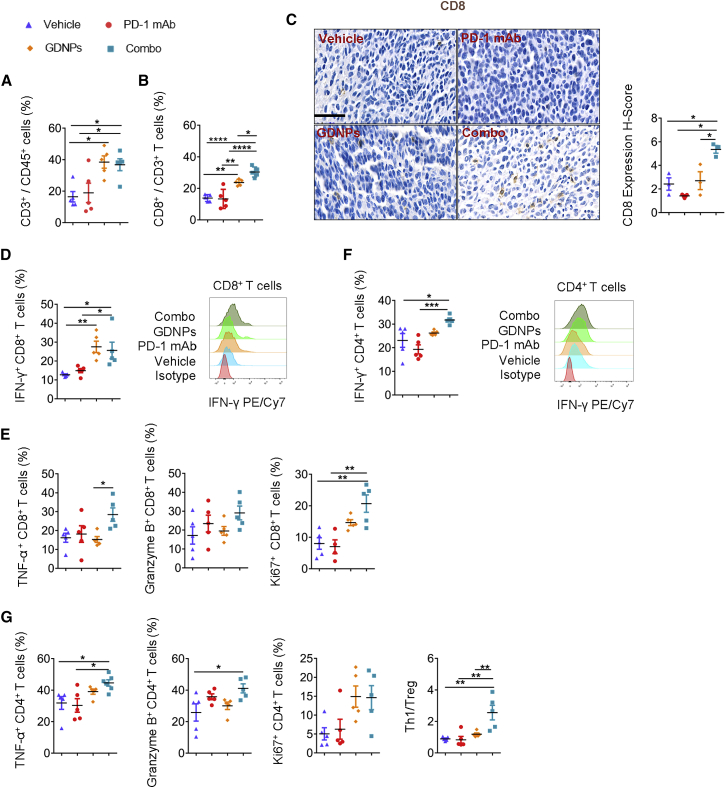
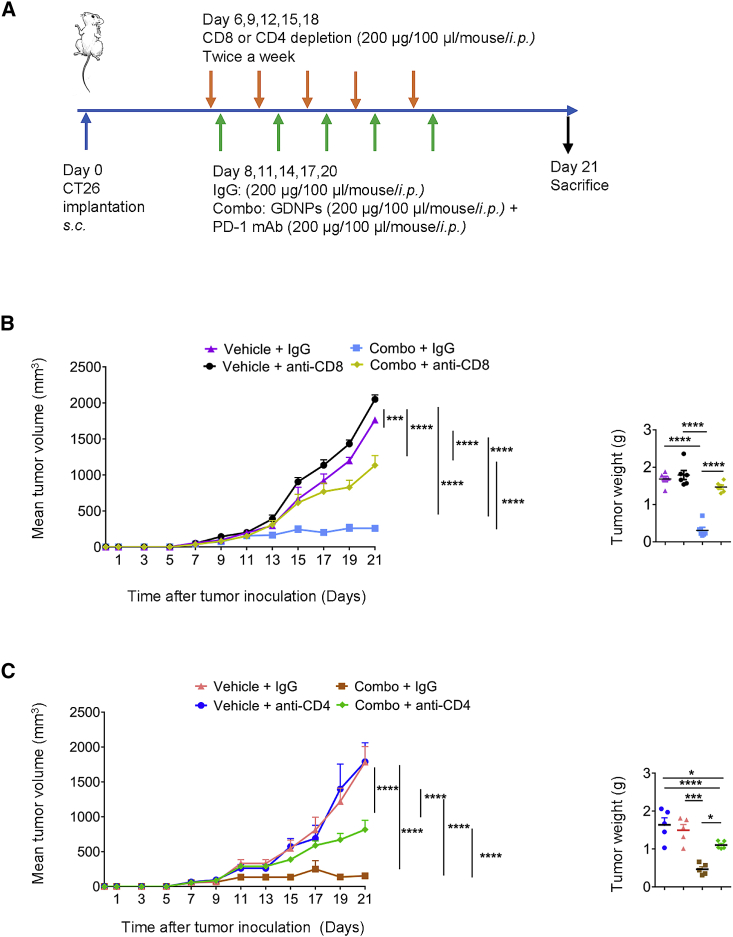
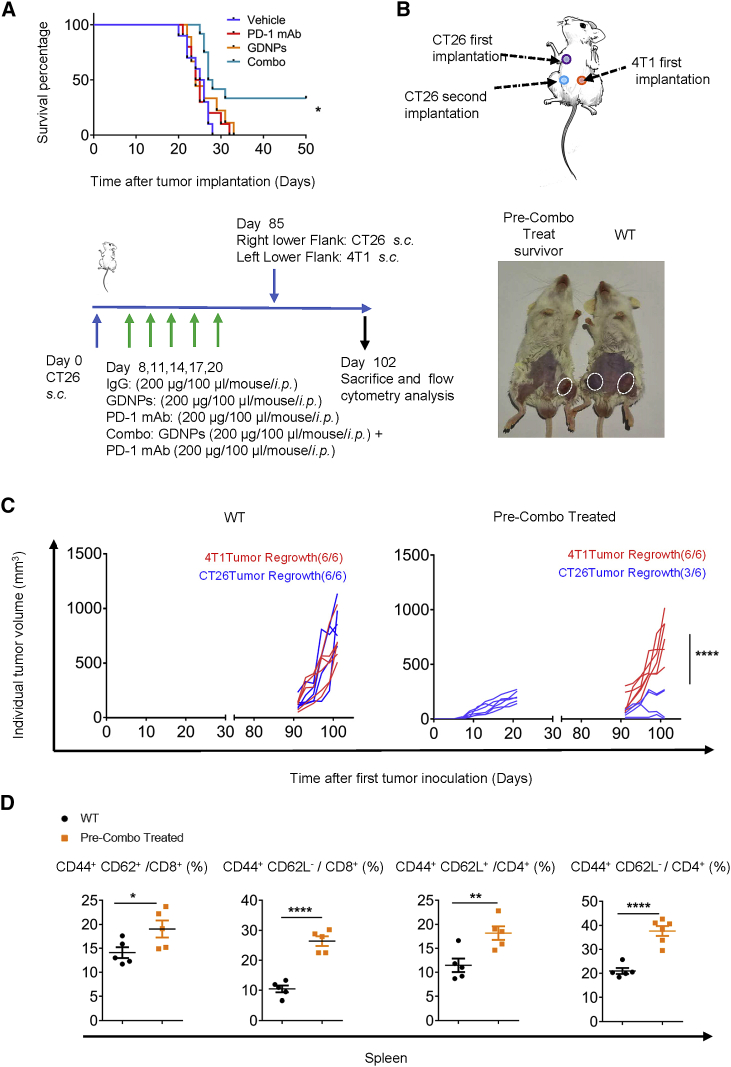
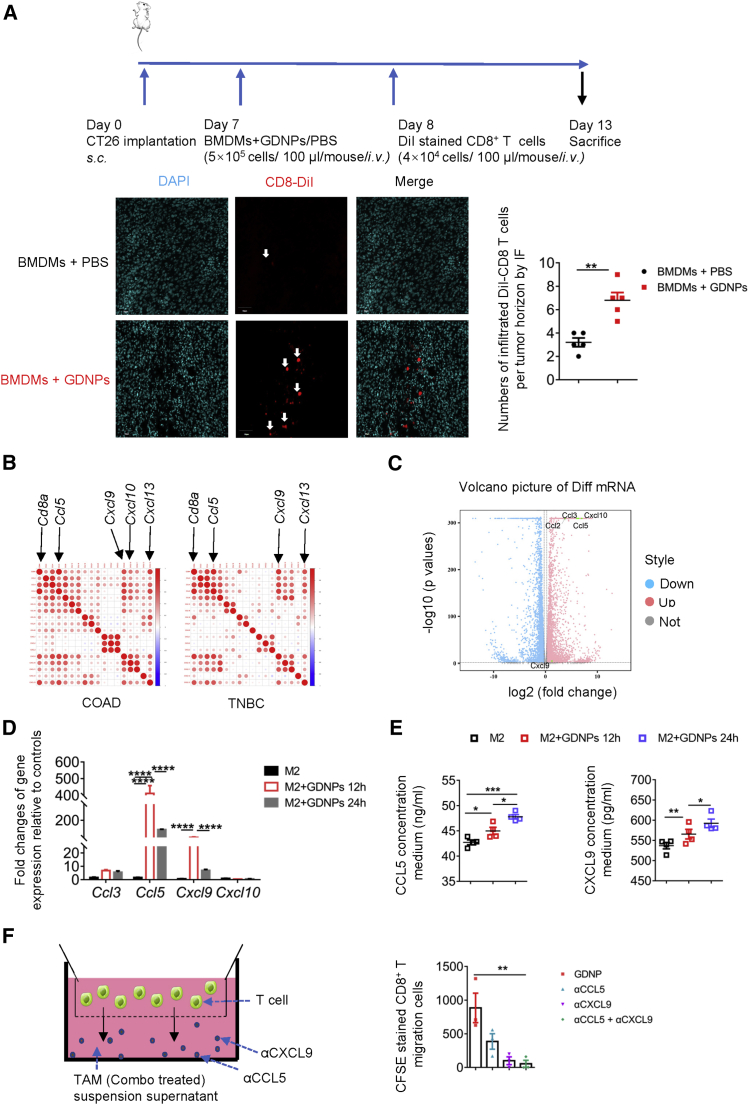
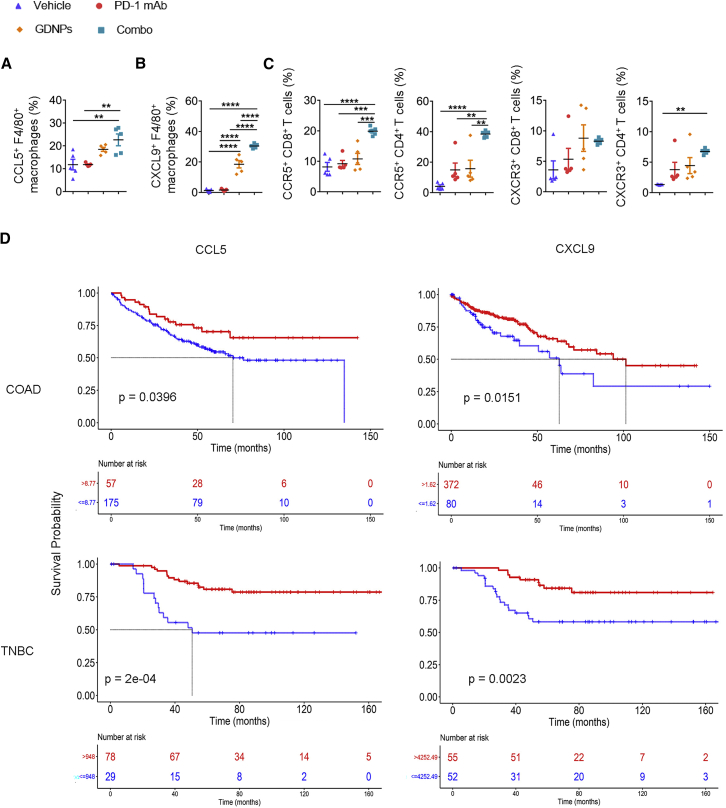
Cold tumor microenvironment (TME) marked with low effector T cell infiltration leads to weak response to immune checkpoint inhibitor (ICI) treatment. Thus, switching cold to hot TME is critical to improve potent ICI therapy. Previously, we reported extracellular vesicle (EV)-like ginseng-derived nanoparticles (GDNPs) that were isolated from Panax ginseng C.A. Mey and can alter M2 polarization to delay the hot tumor B16F10 progression. However, the cold tumor is more common and challenging in the real world. Here, we explored a combinatorial strategy with both GDNPs and PD-1 (programmed cell death protein-1) monoclonal antibody (mAb), which exhibited the ability to alter cold TME and subsequently induce a durable systemic anti-tumor immunity in multiple murine tumor models. GDNPs enhanced PD-1 mAb anti-tumor efficacy in activating tumor-infiltrated T lymphocytes. Our results demonstrated that GDNPs could reprogram tumor-associated macrophages (TAMs) to increase CCL5 and CXCL9 secretion for recruiting CD8+ T cells into the tumor bed, which have the synergism to PD-1 mAb therapy with no detected systemic toxicity. In situ activation of TAMs by GDNPs may broadly serve as a facile platform to modulate the suppressive cold TME and optimize the PD-1 mAb immunotherapy in future clinical application.

Keywords: GDNPs; PD-1 mAb; chemokines; cold tumor; ginseng-derived nanoparticles; immune checkpoint inhibitor; macrophages.


Conflict of interest statement

Declaration of interests The authors declare no competing interests.

Figures

None
Graphical abstract
Figure 1
Figure 1
CD8A and tumor-associated macrophages (TAMs) marker expression in clinical specimens from the Gene Expression Omnibus (GEO) cancer dataset and multiple tumor models Samples across (A) colon adenocarcinoma (COAD) or (B) triple-negative breast cancer (TNBC) were divided into CD206hiCD86lo and CD206loCD86hi using the median of all specimens (analyzed by t test, p = 0.00028 for COAD and p = 0.0047 for TNBC). Kaplan-Meier analyses of patients stratified by CD8hi versus CD8lo in (A) COAD or (B) TNBC (p = 0.0035 for COAD and p = 2.8793e-05 for TNBC). (C) Immunohistochemical staining of CD206 and CD8 in COAD samples (scale bars, 200 μm). Correlation analyses CD8 expression and CD206 expression in n = 52, p = 0.0029.
Figure 2
Figure 2
Combinatorial (Combo) therapy using GDNPs and PD-1 mAb elicits rejections of the CT26 murine colon tumor by polarizing M2-like macrophages to M1-like phenotype (A) Time schedule for tumor implantation and drug treatment. (B) Tumor volume and (C) tumor weight for different treatment types, such as Vehicle, PD-1 mAb, GDNPs, or Combo treatment in CT26 murine colon tumor model (n = 6 for each group, one-way ANOVA or two-way ANOVA, ∗∗p < 0.01, ∗∗∗∗p < 0.0001). (D) Ratio of CD45+ in tumor microenvironment (TME), CD11b+CD45+ in immune cells, F4/80+CD11b+ in immune cells in the CT26 murine colon TME (n = 5 for each group, one-way ANOVA, ∗p < 0.05). (E) Representative fluorescence-activated cell sorting (FACS) plots and quantification of M2/M1. Percentage of PD-L1+/F4/80+ in TAMs. Representative flow cytometry picture for M2-TAM and M1-TAM (n = 5 for each group, one-way ANOVA, ∗p < 0.05).
Figure 3
Figure 3
Combo treatment can activate tumor-infiltrated T lymphocytes Ratio of different T cell phenotypes and T cell-related functional analyses in CT26 murine colon TME by FACS. (A) Ratio of CD3+ in CD45+ cells (n = 5 for each group, one-way ANOVA, ∗p < 0.05). (B) Ratio of CD8+ in CD3+ T cells (n = 5 for each group, ∗p < 0.05. ∗∗p < 0.01, ∗∗∗∗p < 0.0001). (C) Representative pictures of CD8 IHC staining in TME and the quantification of the H-score of IHC staining for CD8 in CT26 murine colon tumor samples (scale bar, 50 μm; n = 3 for each group, ∗p < 0.05). (D) Quantification of IFN-γ+ CD8+ T cells and representative FACS histograms (n = 5 for each group, ∗p < 0.05, ∗∗p < 0.01). (E) Quantification of TNF-α+ CD4+ T cells, granzyme B+ CD8+ T cells, and Ki67+ CD4+ T cells (n = 5 for each group, ∗p < 0.05, ∗∗p < 0.01). (F) Quantification of IFN-γ+ CD4+ T cells and representative FACS histograms (n = 5 for each group, ∗p < 0.05, ∗∗p < 0.01). (G) Ratio of TNF-α+ CD4+ T cell, granzyme B+ CD4+ T cell, Ki67+ CD4+ T cell, and Th1/Treg (n = 5 for each group, ∗p < 0.05, ∗∗p < 0.01). Data are presented as mean ± SEM and analyzed by one-way ANOVA.
Figure 4
Figure 4
CD4+ T and CD8 + T lymphocytes play important roles in Combo treatment (A) Paradigm of tumor implantation, CD4+ or CD8+ depletion, and drug treatment time schedule in CT26 murine colon cancer model. (B) Tumor volume and weight of Vehicle + IgG, Combo + IgG, Vehicle + anti-CD8, and Combo + anti-CD8 four groups (n = 6 for each group, ∗∗∗p < 0.001, ∗∗∗∗p < 0.0001). (C) Tumor volume and weight of Vehicle + IgG, Combo + IgG, Vehicle + anti-CD4, and Combo + anti-CD4 four groups (n = 5 for each group, ∗p < 0.05, ∗∗∗p < 0.001, ∗∗∗∗p < 0.0001). Data are presented as mean ± SEM and analyzed using one-way ANOVA or two-way ANOVA.
Figure 5
Figure 5
GDNPs combined with PD-1 mAb therapy enhance long-term antigen-specific anti-tumor memory (A) Survival curves for Vehicle, PD-1 mAb, GDNPs, and Combo groups in the CT26 murine colon tumor model (n = 10 for each group, p = 0.0132). (B) Paradigm of tumor rechallenge assay and time schedule. (C) Quantification of tumor volumes for tumor rechallenge assay. Representative pictures for tumor-bearing mice (n = 6 for each group, ∗∗∗∗p < 0.0001). (D) Quantification of CD44+ CD62L+ and CD44+ CD62L for CD4+ or CD8+ T cells in the spleen of wild-type (WT) or Combo pre-treated mice (n = 5 for each group, ∗p < 0.05, ∗∗p < 0.01, ∗∗∗∗p < 0.0001). Data are presented as mean ± SEM and analyzed using two-way ANOVA, Student’s t test, or log rank (Mantel-Cox) test.
Figure 6
Figure 6
GDNPs may elicit macrophages to secrete chemokines for T cell chemotaxis (A) CD8+ T trafficking and biodistribution of DiI-labeled CD8+ T lymphocytes in CT26 murine colon tumor with BMDMs + PBS or BMDMs + GDNPs treatment administered intravenously (scale bar, 50 μm; n = 5 for each group, ∗∗p < 0.01). (B) Bubble plots showing correlations between Cd8a and chemotactic gene-related transcripts in COAD and TNBC from TCGA cancer datasets. (C) Volcano plot showing upregulated chemotactic gene expression from results of RNA sequencing for M2-BMDMs + GDNPs or M2-BMDMs + PBS (p < 0.05, fold change (FC) > 1.2, three samples each group). (D) Relative gene expressions of Ccl3, Ccl5, Cxcl9, and Cxcl10 in M2 like-BMDMs or GDNPs-stimulated M2-BMDMs for 12 h/24 h by real-time PCR (n = 3−4 for each group, ∗∗∗∗p < 0.0001). (E) CCL5 and CXCL9 concentration in the culture media of M2-BMDMs, GDNPs + M2-BMDMs for 12 h, and GDNPs + M2-BMDMs for 24 h by ELISA (n = 4 for each group, ∗p < 0.05, ∗∗∗p < 0.001). (F) Schematic diagram and quantification of chemotactic assay. CFSE-stained CD8+ T cells migrated toward the supernatant from TAM culture media of the Combo group in the presence of anti-CCL5 and anti-CXCL9 neutralization by flow cytometry (n = 3 for each group, ∗∗p < 0.01). For all panels, data are presented as mean ± SEM and analyzed using one-way ANOVA or Student’s t test.
Figure 7
Figure 7
GDNPs combined with PD-1 mAb elicit TAM-secreting chemokines to change the TME (A) Ratio of CCL5+/F4/80+ and (B) CXCL9+/F4/80+ in CT26 colon tumor model TME under Vehicle, PD-1 mAb, GDNPs, or Combo treatment (n = 5 for each group, ∗∗p < 0.01, ∗∗∗∗p < 0.0001). (C) Ratio of CCR5+/CD8+, CXCR3+/CD8+, CCR5+/CD4+, and CXCR3+/CD4+ in tumors with Vehicle, PD-1 mAb, GDNPs, or Combo treatment in CT26 murine colon tumor models (n = 5 for each group, ∗∗p < 0.01, ∗∗∗p < 0.001, ∗∗∗∗p < 0.0001). Kaplan-Meier analyses for (D) COAD or TNBC datasets from GEO and TCGA were divided into two groups independently, stratified by CCL9 or CXCL5 median of all specimens (p = 0.04 for CCL5 in COAD, p = 0.015 for CXCL9 in COAD, p = 0.00018 for CCL5 in TNBC, p = 0.0023 for CXCL9 in TNBC). Data are presented as mean ± SEM and analyzed using one-way ANOVA or Kaplan-Meier analyses.

References

    1. Gong J., Chehrazi-Raffle A., Reddi S., Salgia R. Development of PD-1 and PD-L1 inhibitors as a form of cancer immunotherapy: a comprehensive review of registration trials and future considerations. J. Immunother. Cancer. 2018;6:8. - PMC - PubMed
    1. Zhu X., Lang J. Soluble PD-1 and PD-L1: predictive and prognostic significance in cancer. Oncotarget. 2017;8:97671–97682. - PMC - PubMed
    1. Balar A.V., Weber J.S. PD-1 and PD-L1 antibodies in cancer: current status and future directions. Cancer Immunol. Immunother. 2017;66:551–564. - PMC - PubMed
    1. Duan X., Chan C., Han W., Guo N., Weichselbaum R.R., Lin W. Immunostimulatory nanomedicines synergize with checkpoint blockade immunotherapy to eradicate colorectal tumors. Nat. Commun. 2019;10:1899. - PMC - PubMed
    1. Oliveira A.F., Bretes L., Furtado I. Review of PD-1/PD-L1 Inhibitors in Metastatic dMMR/MSI-H Colorectal Cancer. Front. Oncol. 2019;9:396. - PMC - PubMed

Publication types