

Classification of Ataxic Gait
- PMID: 34451018
- PMCID: PMC8402252
- DOI: 10.3390/s21165576
Classification of Ataxic Gait
Abstract
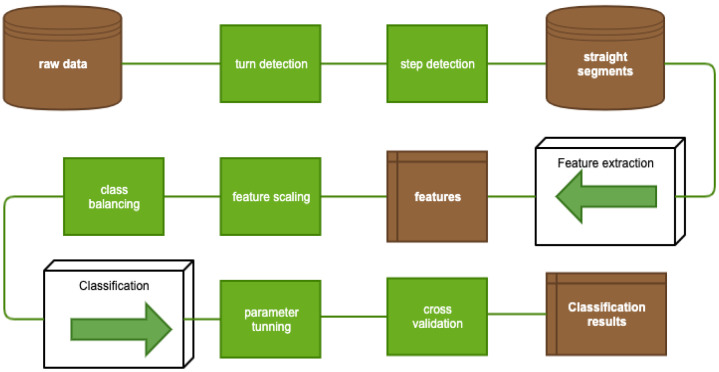
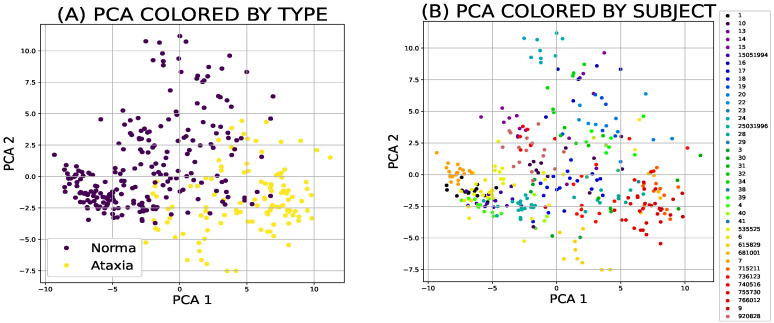
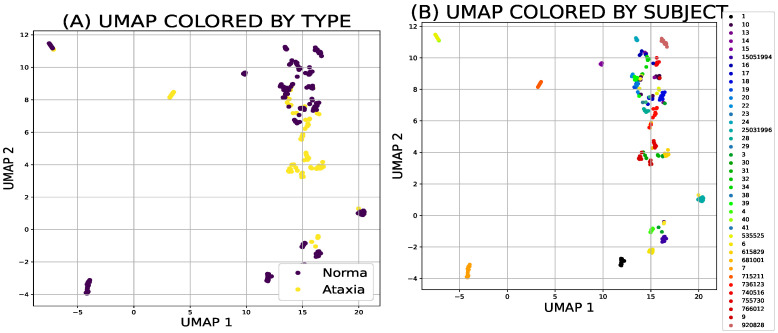
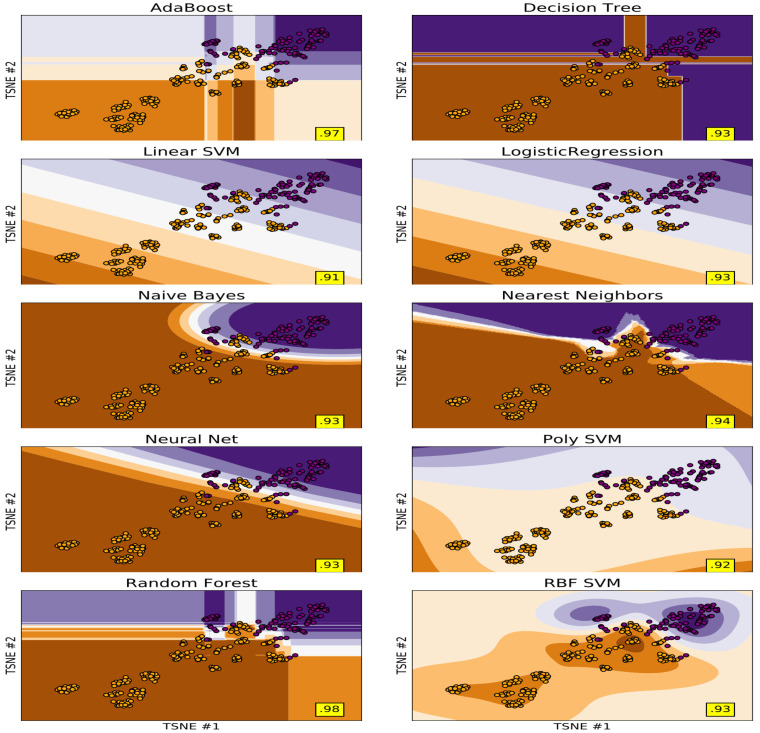
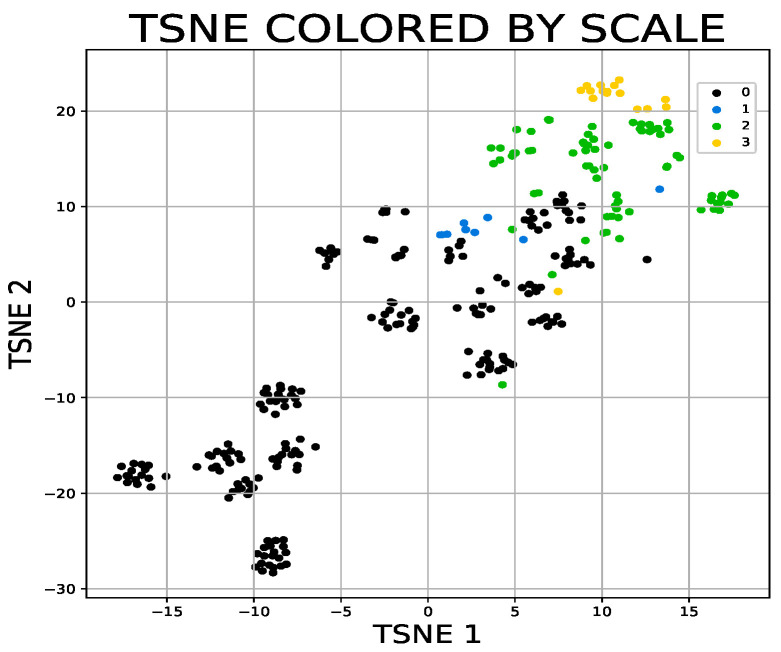
Gait disorders accompany a number of neurological and musculoskeletal disorders that significantly reduce the quality of life. Motion sensors enable high-quality modelling of gait stereotypes. However, they produce large volumes of data, the evaluation of which is a challenge. In this publication, we compare different data reduction methods and classification of reduced data for use in clinical practice. The best accuracy achieved between a group of healthy individuals and patients with ataxic gait extracted from the records of 43 participants (23 ataxic, 20 healthy), forming 418 segments of straight gait pattern, is 98% by random forest classifier preprocessed by t-distributed stochastic neighbour embedding.
Keywords: SARA; ataxia; classification; gait; machine learning.
Conflict of interest statement
The authors declare no conflict of interest.
Figures
References
-
- Möhwald K., Pradhan C., Wuehr M., Dieterich M., Brandt T., Jahn K., Schniepp R. EP 52. PREGAIT study–Pattern recognition and differential diagnosis of neurological gait disorders in instrumental and clinical gait analysis. Clin. Neurophysiol. 2016;127:e260. doi: 10.1016/j.clinph.2016.05.106. - DOI
-
- Buckley C., Alcock L., McArdle R., Rehman R.Z.U., Del Din S., Mazzà C., Yarnall A.J., Rochester L. The role of movement analysis in diagnosing and monitoring neurodegenerative conditions: Insights from gait and postural control. Brain Sci. 2019;9:34. doi: 10.3390/brainsci9020034. - DOI - PMC - PubMed
-
- Lim C.H., Vats E., Chan C.S. Fuzzy human motion analysis: A review. Pattern Recognit. 2015;48:1773–1796. doi: 10.1016/j.patcog.2014.11.016. - DOI
-
- Terayama K., Sakakibara R., Ogawa A. Wearable gait sensors to measure ataxia due to spinocerebellar degeneration. Neurol. Clin. Neurosci. 2018;6:9–12. doi: 10.1111/ncn3.12174. - DOI
MeSH terms
Grants and funding
LinkOut - more resources
Full Text Sources
Medical
