. 2021 Aug 23;21(16):5663.
doi: 10.3390/s21165663.

Removal of ECG Artifacts Affects Respiratory Muscle Fatigue Detection-A Simulation Study

Affiliations

Removal of ECG Artifacts Affects Respiratory Muscle Fatigue Detection-A Simulation Study

Lorenz Kahl et al. Sensors (Basel). .

Abstract

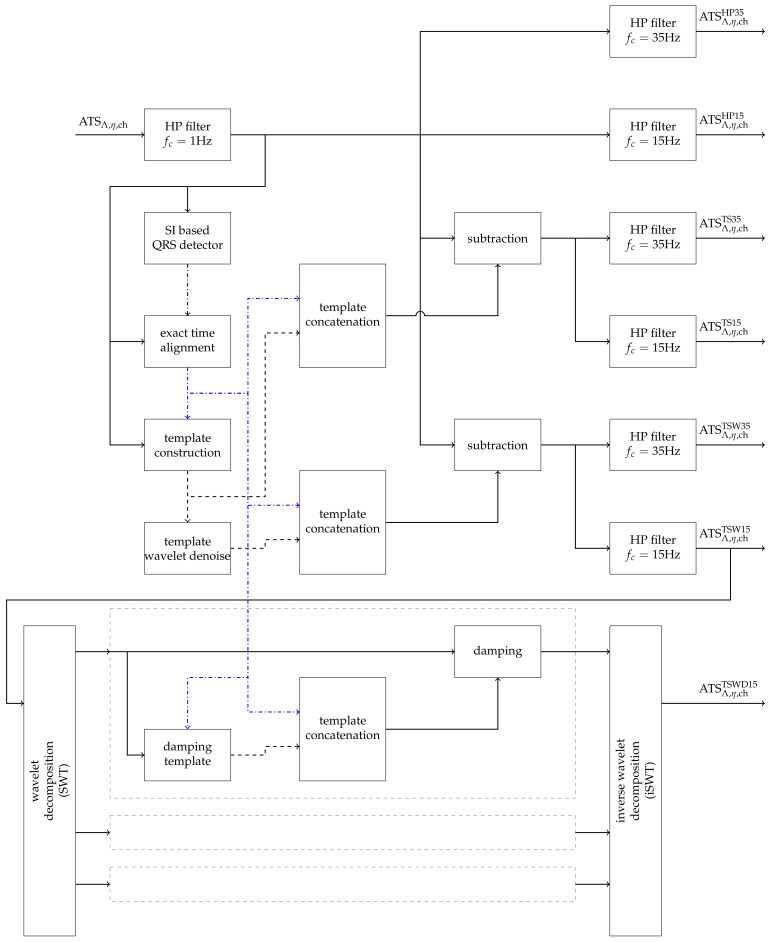
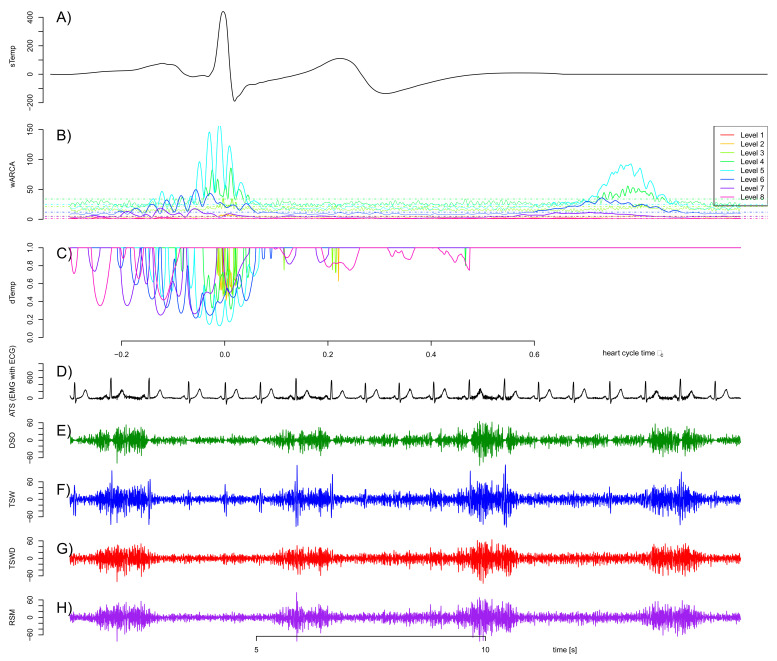
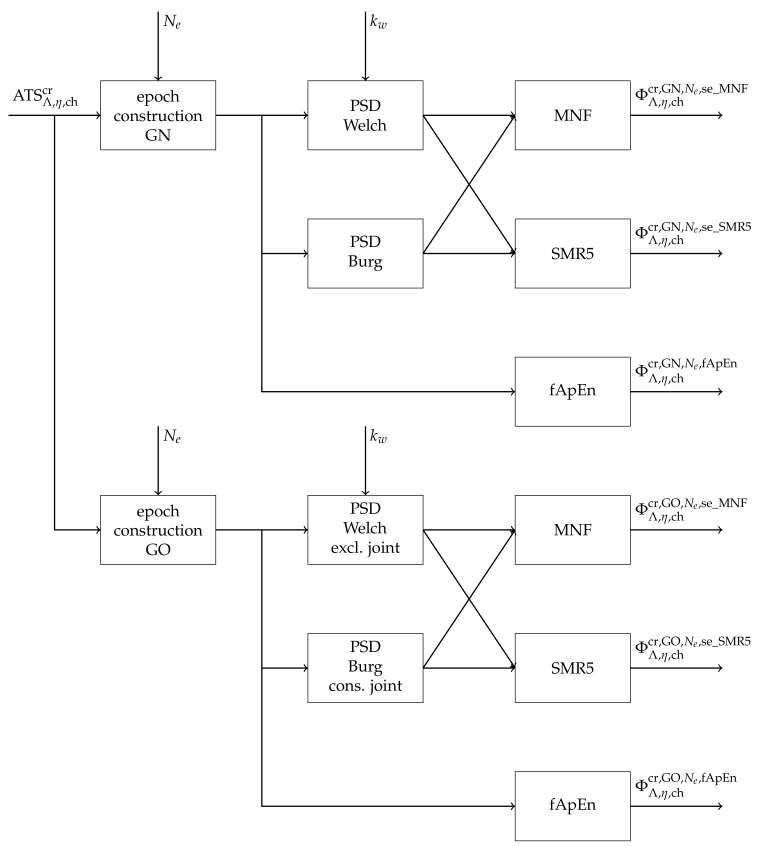
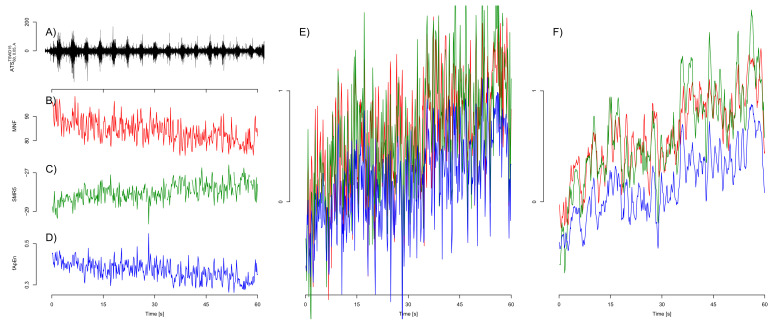
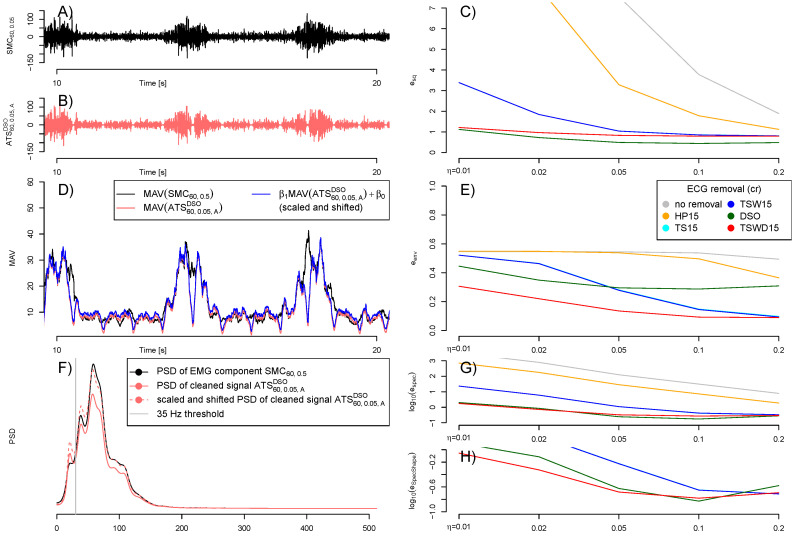
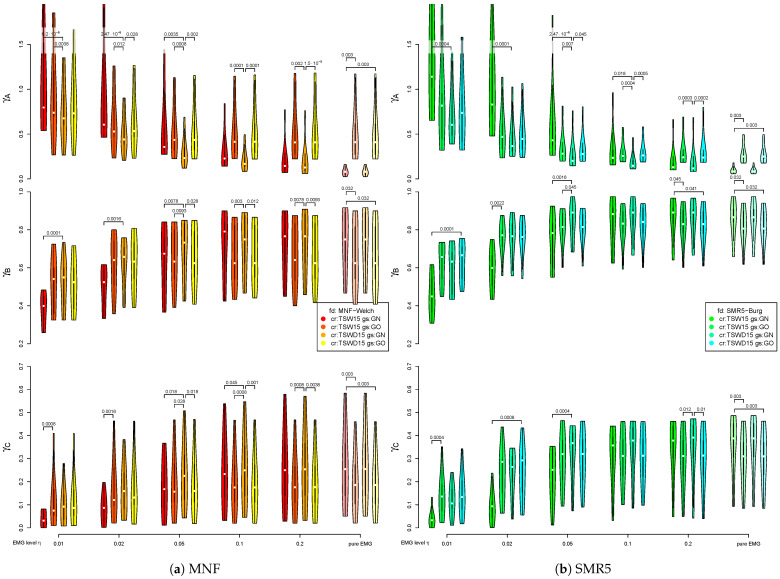
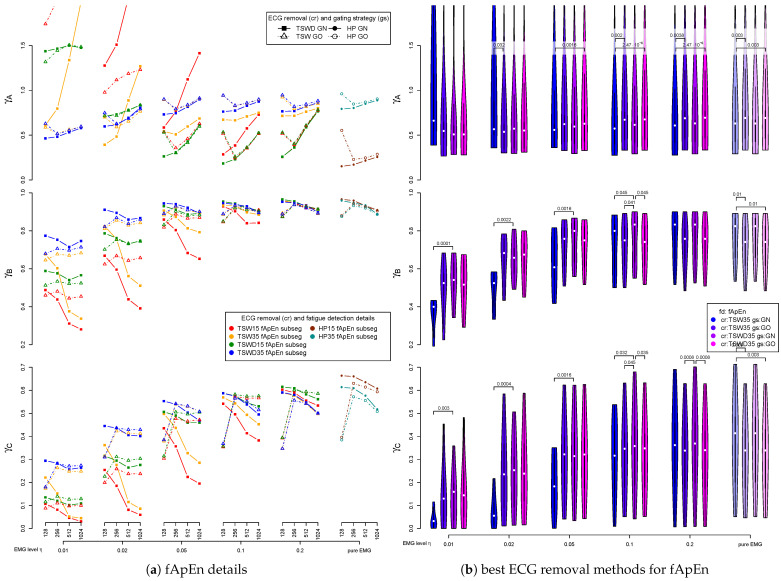
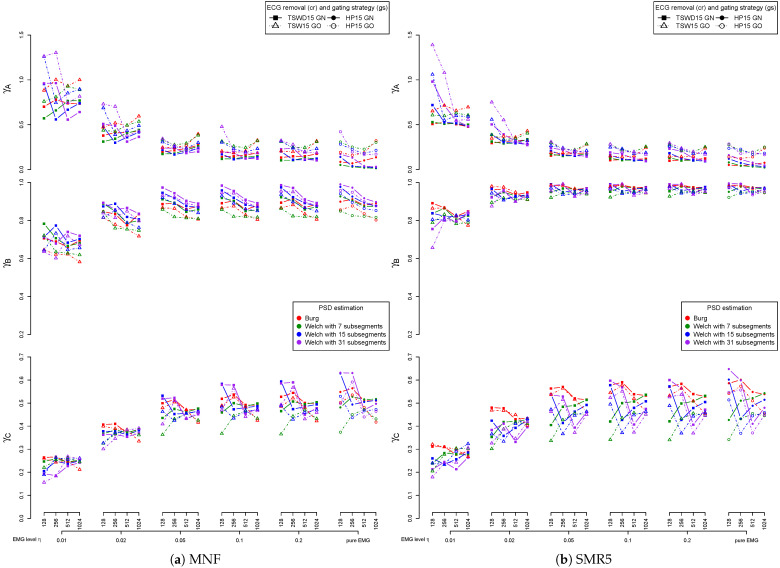
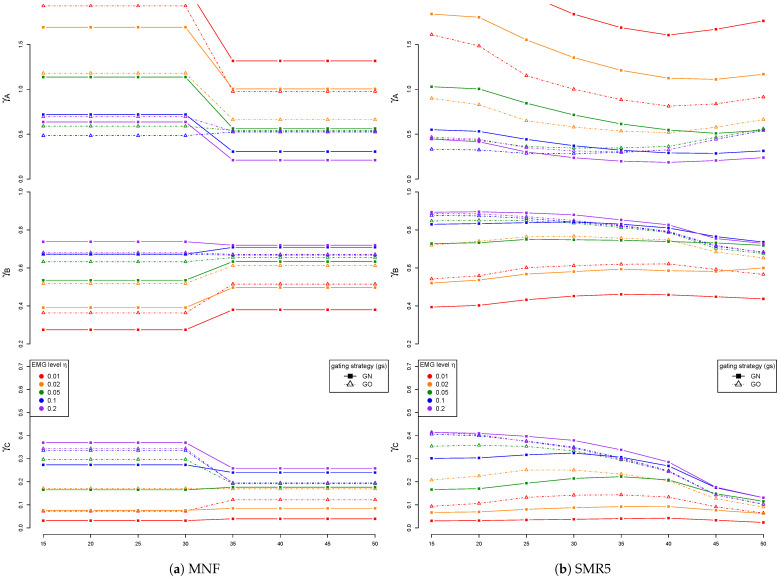
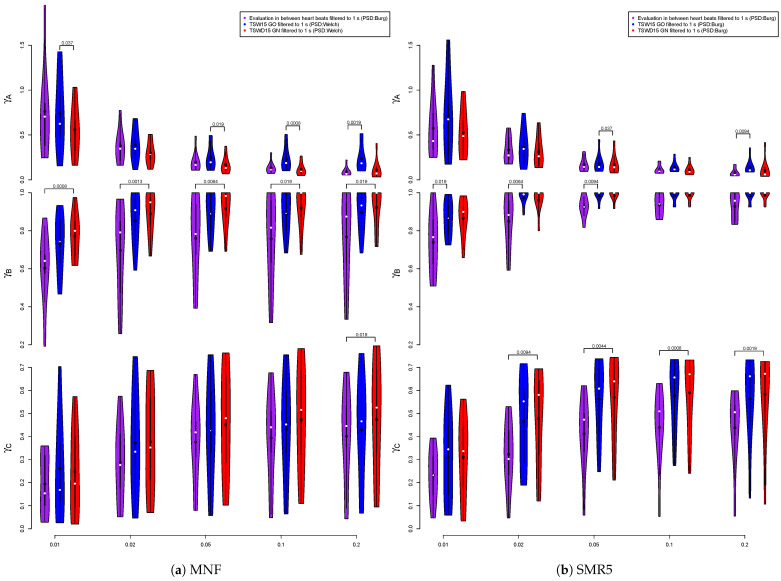
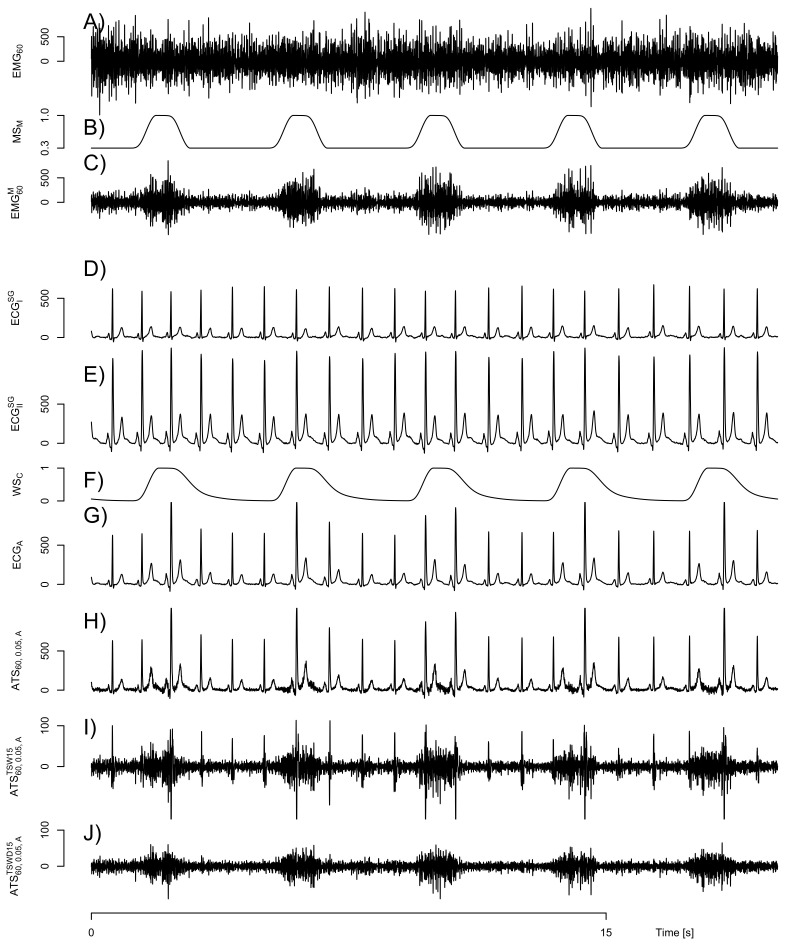
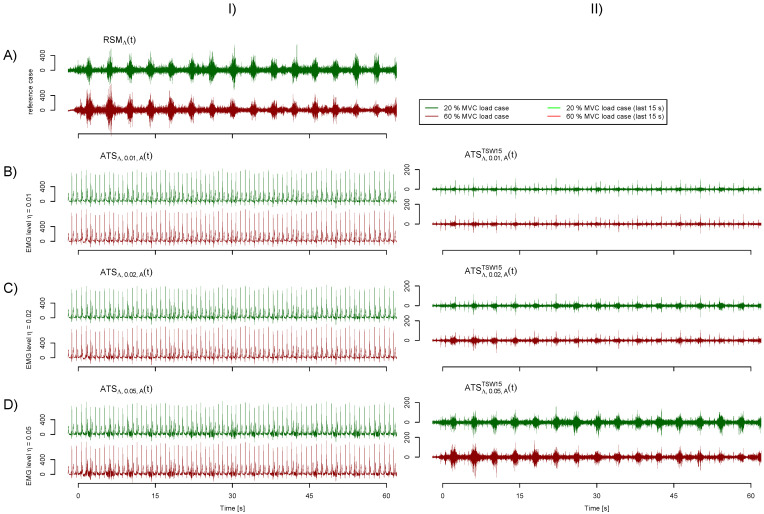
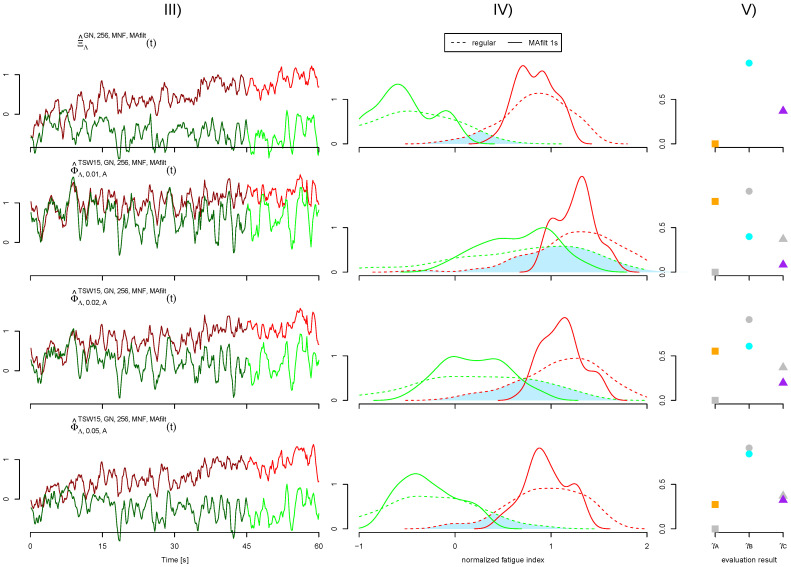
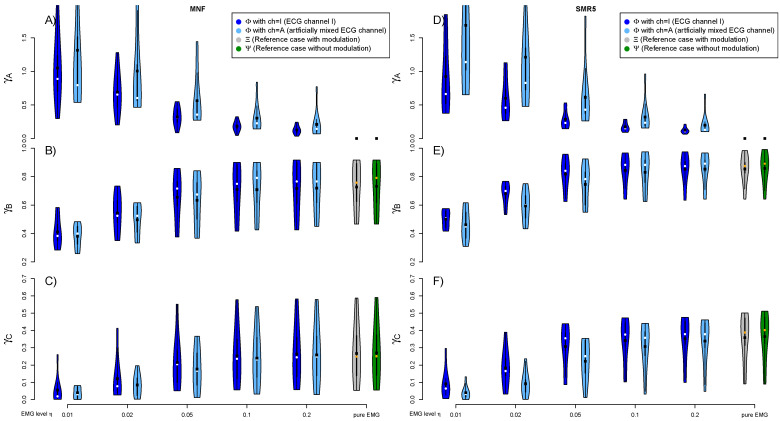
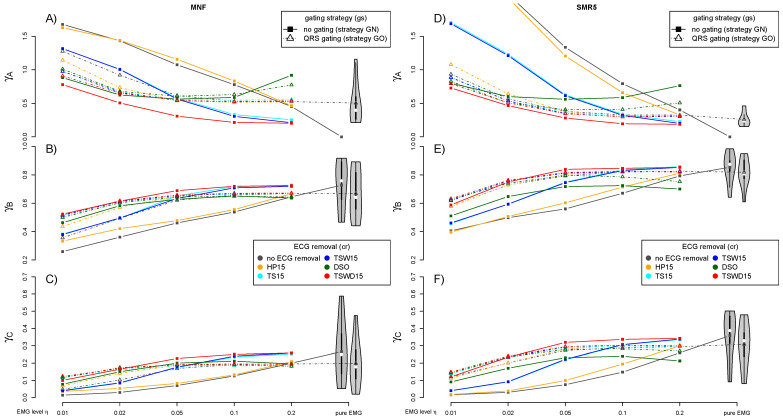
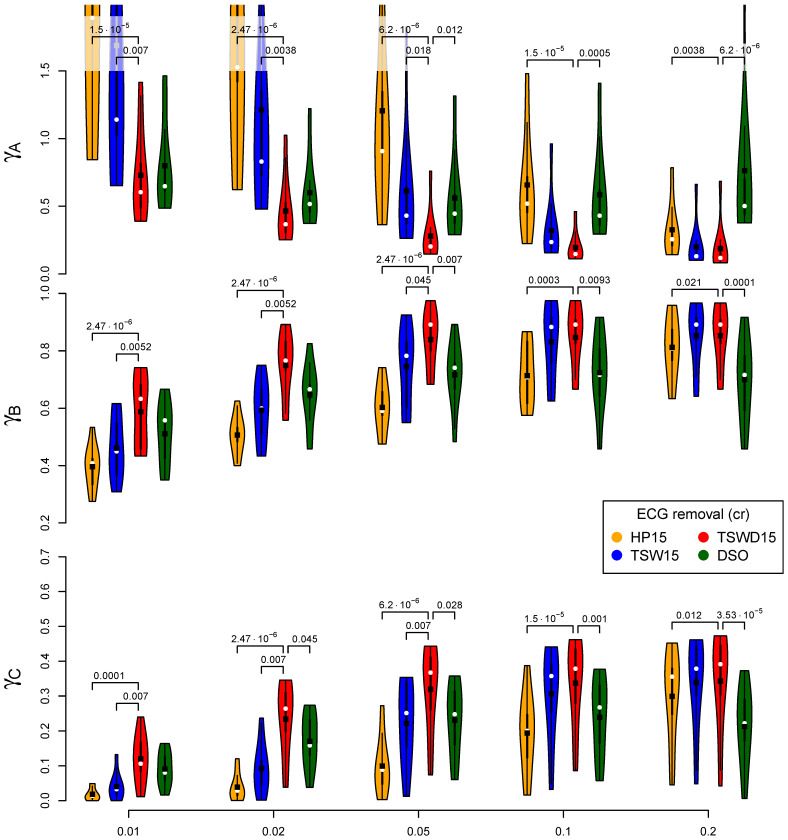
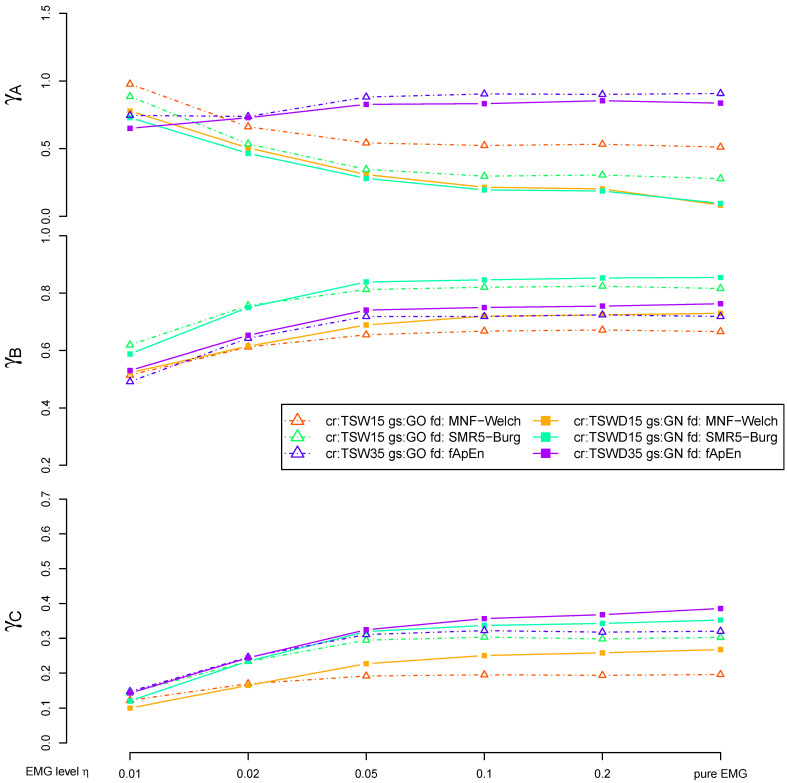
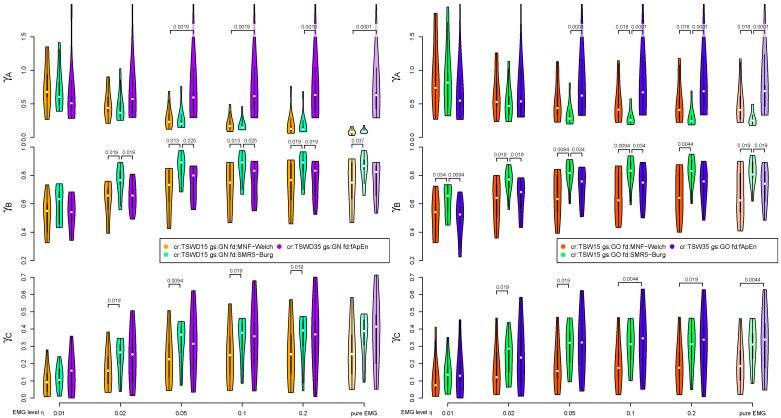
This work investigates elimination methods for cardiogenic artifacts in respiratory surface electromyographic (sEMG) signals and compares their performance with respect to subsequent fatigue detection with different fatigue algorithms. The analysis is based on artificially constructed test signals featuring a clearly defined expected fatigue level. Test signals are additively constructed with different proportions from sEMG and electrocardiographic (ECG) signals. Cardiogenic artifacts are eliminated by high-pass filtering (HP), template subtraction (TS), a newly introduced two-step approach (TSWD) consisting of template subtraction and a wavelet-based damping step and a pure wavelet-based damping (DSO). Each method is additionally combined with the exclusion of QRS segments (gating). Fatigue is subsequently quantified with mean frequency (MNF), spectral moments ratio of order five (SMR5) and fuzzy approximate entropy (fApEn). Different combinations of artifact elimination methods and fatigue detection algorithms are tested with respect to their ability to deliver invariant results despite increasing ECG contamination. Both DSO and TSWD artifact elimination methods displayed promising results regarding the intermediate, "cleaned" EMG signal. However, only the TSWD method enabled superior results in the subsequent fatigue detection across different levels of artifact contamination and evaluation criteria. SMR5 could be determined as the best fatigue detection algorithm. This study proposes a signal processing chain to determine neuromuscular fatigue despite the presence of cardiogenic artifacts. The results furthermore underline the importance of selecting a combination of algorithms that play well together to remove cardiogenic artifacts and to detect fatigue. This investigation provides guidance for clinical studies to select optimal signal processing to detect fatigue from respiratory sEMG signals.

Keywords: ECG; EMG; MNF; SMR; biomedical signal processing; cardiogenic artifacts; fApEn; fatigue detection; muscle fatigue; neuromuscular fatigue; respiration; respiratory EMG; sEMG.


Conflict of interest statement

The authors declare no conflict of interest.

Figures

Figure A1
Figure A1
ECG preprocessing and epoch construction. (A) displays a single QRS complex of baseline-filtered ECGIBLFt and ECGISGt pre-processed by the application of a Savitzky–Golay filter. (B) shows the 60% MVC sEMG signal taken from a previous study [16]. (C) shows the artificial test signal ATS60,0.05,At. The detected and time-refined position of the QRS is indicated by the orange diamond. Ranges of the signal close to the QRS complex designated to be excluded from the following fatigue analysis are drawn in purple. (D,E) display the epoch construction based on ATS60,0.05,ATSW15t obtained by template subtraction. A fatigue value is calculated every 125 ms (symbolized by dots), yielding a fatigue signal with 8 Hz sample rate. The epoch that forms the basis of each fatigue value is indicated by the timeline to the left of the dot at the same height. As an example, the fatigue value assigned to time t=35.2 s (as indicated by the red dot) is based on the epoch drawn in blue. This example uses an epoch size of a 0.25 s (256 samples). Subsegments as used in the Welch PSD estimation, with kw=7 subsegments shown in green for the exemplary epoch (shown in blue). (D) visualizes the gating strategy GN, which does not exclude former QRS segments. The fatigue evaluated segment is composed of the last 256 samples regardless of remnants of a QRS complex. The gating strategy GO displayed in (E) skips the QRS remnants.
Figure A2
Figure A2
An evaluation of heartbeat irregularity. (A) visualizes three characteristic properties evaluated for each heart cycle. The evaluation is performed for both ECGIt and ECGAt. The resulting distributions of these characteristic properties for both ECG channels I and A are shown in (B) for each subject. ECG channel A is artificially mixed and features increased heartbeat irregularity. The violin plot visualizes the variation of the characteristic property within the same channel of one subject. The subject number is stated on the horizontal axis. An alternative way to evaluate the heartbeat irregularity is based on the amount of cardiogenic artifacts that could not be eliminated by the artifact removal step and is still present in ATSΛ,η,chcrt. The analysis is preferably used in combination with template subtraction TSW15 as the artifact removal method. A rectified segment of ATSΛ,η,chcrt is extracted for each heart cycle, as shown in (C). These segments are superimposed by the same QRS times used for template subtraction. A raw version of an average remaining cardiogenic artifact signal rARCAΛ,η,chcrτc is constructed by averaging all segments at the same relative heart cycle time τc. The average remaining cardiogenic artifact signal ARCAΛ,η,chcrτc is yielded by the application of a 25 tap Blackman smoothing filter to the raw version rARCAΛ,η,chcrτc. Subfigures (D,E) visualize the average remaining cardiogenic artifact signals ARCA60,0.02,chcrτc for different artifact removal methods and ECG channels. The subfigures differ only in the range of the vertical axis. The peak value for each ARCAΛ,η,chcrτc is denoted as pARCAΛ,η,chcr. The ratio of the peak average of remaining cardiogenic artifacts to the peak average of cardiogenic artifacts (based on signal ATSΛ,η,cht) is used to quantify the heartbeat irregularity. The pARCA ratio is calculated as pARCAΛ,η,chcrpARCAΛ,η,chNR. The artifact removal method NR denotes no treatment of cardiogenic artifacts. pARCA ratios for both ECG channels I and A are shown in (F) for each subject. These ratios are based on template subtraction TSW15 as the artifact removal method and MVC load level Λ=60. Each violin plot contains pARCA ratios from EMG levels η=0.01,0.02,0.05and0.1. For all but one subject, the pARCA ratio indicates a distinctively elevated heartbeat irregularity for EMG channel A.
Figure A3
Figure A3
A block diagram visualizing the test signal generation. See Section 2.1 for the corresponding description.
Figure A4
Figure A4
Table stating the utilized combinations of EMG recordings (differential signals originating from electrodes 1 and 3—subject numbers from [16]) and ECG recordings (identifiers from [20]). Further indicated is the number of heartbeats (# HB) within the analyzed segment of pure ECG. False positive (FP) and false negative (FN) detected QRS complexes from signals ATSΛ,η,At are stated for different EMG levels η and MVC loads Λ.
Figure A5
Figure A5
Block diagram displaying different methods to reduce cardiogenic artifacts. See Section 2.2 for a detailed description. For clarity reasons, the TSWD algorithm is only depicted for a single wavelet scale and suggested for two other instead of the utilized 8 scales. Not depicted are the methods TSWD35 and DSO. Both are variants to TSWD15 and differ in the signal that is fed into the stationary wavelet transform (SWT). TSWD35 uses the signal ATSΛ,η,chTSW35 as input. In the case of DSO, the unpreprocessed signal ATSΛ,η,ch is used as input. The ECG removal methods featuring a high pass with fc=35 Hz are only relevant for fApEn fatigue detection. PSD-based fatigue detection relies solely on the 15 Hz version as the PSD lower bound bl is applied.
Figure A6
Figure A6
(A) displays the template that is subtracted QRS synchronously in the first step. To limit its influence on the current cardiac cycle, values outside the average cardiac cycle length are set to zero, being the additive identity. (B) visualizes the average remaining cardiogenic artifact signal wARCAΛ,η,chTSW15_SWT,iτc for different, color-coded wavelet levels i. It is constructed by averaging all rectified heart cycle segments of the signal ATSΛ,η,chTSW15_SWT,it at the same relative heart cycle time τc. The signal ATSΛ,η,chTSW15_SWT,it is obtained by the application of the stationary wavelet transform with eight different levels to the result of the template subtraction from the first step. Dash-dotted lines indicate the threshold θi. Damping is carried out only at heart cycle times τc where the average remaining cardiogenic artifact signal wARCAΛ,η,chTSW15_SWT,iτc is above the threshold θi. (C) shows the resulting damping templates dTempτc,i for different, color-coded wavelet levels i. Again, values outside the average cardiac cycle length are set to identity, in this case, 1 due to the multiplication. The remaining subpanels compare the results of different template subtraction methods. (D) displays a segment of ATS60,0.05,A. (EG) display the corresponding ECG-reduced segments obtained with artifact removal methods DSO, TSW15 and TSWD15, respectively. (H) displays the pure EMG component RSMΛ used in the construction of the artificial test signal ATS60,0.05,A. This signal can be considered as a target value for artifact removal. The example signals illustrate that TSWD can best remove the artifacts. While the pure application of the damping step (DSO) removes too much of the EMG signal in the QRS range, the ordinary template subtraction (TSW) is not able to remove the ECG component completely, and artifacts remain in the QRS range.
Figure A7
Figure A7
Block diagram of applied fatigue detection methods. See Section 2.3 for a detailed description. Fatigue detection is performed based on signals ATSΛ,η,chcr. These signals feature reduced cardiogenic artifacts produced with the cardiogenic artifact elimination method cr. The resulting fatigue index signals are denoted ΦΛ,η,chcr,gs,Ne,fd, where gs denotes the gating strategy, Ne the epoch size and fd the fatigue detection method. The prefix se_ in front of MNF and SMR5 fatigue detection methods denotes the applied spectral estimation method (Welch or Burg method).
Figure A8
Figure A8
Detailed description of fatigue detection algorithms and exemplary fatigue detection signals. The mean frequency and spectral moments ratio depend on an estimation of the power spectral density (PSD) of the underlying epoch. The PSD was calculated in a nonparametric way by the Welch method [37]. Epochs are subdivided into subsegments with a quarter, an eighth or a sixteenth of the epoch size. Subsegments had a 50% overlap and were tapered by a Hamming window function. This led to kw=7,15or31 subsegments for each epoch. In the case of the gating strategy GO, all subsegments affected by gating are excluded from the averaging in the Welch method. Alternatively, a parametric estimate was calculated by the Burg algorithm [37]. The Burg algorithm is performed individually for all fragments separated by gating in the case of the gating strategy GO. A final PSD estimation is obtained as the weighted average of PSDs from all fragments. The weight is chosen according to the length of the fragment in relation to the total length of all fragments. Fragments shorter than a quarter of the intended epoch size are excluded. In practice, the presented cardiogenic artifact removal will only suppress a part of the cardiogenic artifacts. Furthermore, the ECG power spectrum tends to have a larger share in the low-frequency range than the EMG power spectrum. To reflect these two issues, we introduced a PSD lower bound bl. Both PSD-based fatigue detection algorithms only considered PSD bins in between the lower bound bl and upper bound bu. Fatigue detection was performed with the lower bound bl at 15, 20, 25, 30, 35, 40, 45 and 50 Hz. In contrast, bu was fixed at 500 Hz close to the Nyquist frequency. To facilitate the introduction of bl, all PSD-based fatigue calculations rely on 15 Hz high-pass filtered signals. The mean frequency (MNF) fatigue identifier [34] is calculated as: MNF=blbuf·PSDfdfblbuPSDfdf. The spectral moments ratio (SMR) suggested by Dimitrov et al. [35] tries to better incorporate fatigue-related PSD changes at higher frequencies. This is accomplished by multiplying the PSD with a weighting function that amplifies higher PSD bins. The spectral moment M of order p also follows the PSD bounds bl and bu and is calculated as Mp=blbufp·PSDfdf. The spectral moments ratio fatigue index of order p is defined as SMRp=lnM1Mp. We used an order of p=5 and therefore choose the abbreviation SMR5 in this study. The natural logarithm is utilized to prevent a range over several orders of magnitude and ensures comparable values for the following assessment [17]. Fuzzy approximate entropy (fApEn) was introduced by Xie et al. [36]. As an entropy method, it compares one short sequence from the epoch to all other short sequences from the same epoch. The entropy is based on the number of similar sequences of length m compared to the amount of similar sequences with length m+1. In contrast to other entropy methods, fApEn altered the decision of whether two sequences are considered similar. The former binary decision was exchanged for a fuzzy similarity u(d,r)=exp(d2r). d denotes the maximum metric of the difference of both sequences. The method also considers two sequences to be similar if they have an arbitrary constant offset. We used a threshold of r=0.6 and a vector length m=2. All fragments separated by gating were concatenated in the case of the gating strategy GO for fApEn. In this case, the fApEn method is slightly adapted to take into account the concatenation of fragments. This concerns, on the one hand, the zero-mean: The mean is calculated and compensated separately within each fragment. Furthermore, those short sequences excluded from calculation that are extending over more than one fragment. These short sequences contain the fracture at the concatenation and might disturb the entropy calculation. Subfigure (A) visualizes the signal ATS60,0.05,ATSWD15t. Derived are the fatigue index signals with MNF, SMR5 and fApEn fatigue detection methods shown in (BD), respectively. All fatigue index signals are based on epoch size Ne=256. The PSD for MNF was estimated with the Welch method with kw=15, while the Burg method was used for SMR5. SMR5 and fApEn utilized gating and no gating was applied for MNF. All three variants used a PSD lower bound bl=35 Hz (in the case of fApEn, a corresponding high-pass is applied). (E) displays the corresponding normalized fatigue signals Φ^60,0.05,ATSWD,gs,256,fdt that are converted to a zero to one range. (F) shows the corresponding fatigue signals that are normalized and filtered to incorporate information from a 1 s segment of the EMG signal at each fatigue index value. They are denoted Φ^60,0.05,ATSWD,gs,256,fd,MAfiltt.
Figure A9
Figure A9
Temporal and spectral evaluation of ECG “cleaned” signals. The evaluation is based on the different error variants quantifying the deviation of the ECG “cleaned” signal ATSΛ,η,cht compared to the scaled EMG component SMCΛ,ηt. The properly scaled, pure ECG component is defined as SMCΛ,ηt=ATSΛ,η,chtECGcht=η0.2·RSMΛt. The squared error of the ECG attenuated signal with removal method “cr” is defined as: esqη,ch,cr=SMC60,ηtATS60,η,chcrt2SMC60,ηt2|0 s<t<60 s. This corresponds to the definition of the error for synthetic signals by Petersen et al. [15]. Subpanels (A,B) show the pure EMG component SMC60,0.05t and the ECG “cleaned” signal ATS60,0.05,ATSWDt, respectively. The mean removal esqη,A,cr error across all nine subjects is displayed in (C) for different ECG removal logarithms and EMG levels η. The influence of ECG removal variants on a subsequently calculated envelope signal is quantified by an error eenv, as known from Petersen et al. [15]. The mean average value MAV with a centralized sliding window (size 128) is calculated for both the pure EMG component and the cleaned signal. Exemplary envelope signals are shown in (D). The envelope error is defined as: eenvη,ch,cr=MAVSMC60,ηtβ1*MAVATS60,η,chcrtβ0*2MAVSMC60,ηt2|0 s<t<60 s. With β1* and β0*, a linear factor and an offset are applied to scale and shift the envelope of the cleaned signal to minimize the error. Both values are obtained by a linear regression: β1*β0*=argminβ0,β1MAVSMC60,ηtβ1MAVATS60,η,chcrtβ02|0 s<t<60 s The resulting mean error eenvη,A,cr across all nine subjects is displayed in (E). Spectral properties of the ECG “cleaned” signal are evaluated based on the power spectral density (PSD) (F). The PSD was calculated by the Burg method with a 60 s long segment. Again, a quadratic error was calculated to quantify the deviation of the spectrum: especη,ch,cr=PSDSMC60,ηt,fPSDATS60,η,chcrt,f2PSDSMC60,ηt,f2|0 s<t<60 s,35 Hz<f<512 Hz. To exclude effects of the high-pass filter, only frequencies above 35 Hz are considered. To account for fatigue algorithms that mainly look for spectral changes instead of absolute values of the PSD, an alternative error eSpecShape is calculated, which allows for a vertical shift and scaling of the PSD of the ECG “cleaned” signal in a similar manner as with eenv. It is defined as: eSpecShapeη,ch,cr=PSDSMC60,ηt,fβ3*PSDATS60,η,chcrt,fβ2*2PSDSMC60,ηt,f2|0 s<t<60 s,35 Hz<f<512 Hz. Both values are again obtained by a linear regression: β3*β2*=argminβ2,β3PSDSMC60,ηt,fβ3PSDATS60,η,chcrt,fβ22|0 s<t<60 s,35 Hz<f<512 Hz. The resulting errors especη,A,cr and eSpecShapeη,A,cr are shown in (G,H), respectively. especη,A,cr for HP15 and no ECG removal at all are so large, that they are not displayed in (H).
Figure A10
Figure A10
A comparison of the best-working ECG removal methods for PSD-based fatigue detection algorithms. Depicted are template subtraction without (TSW15) and with (TSWD15) subsequent wavelet-based damping step. Both methods are shown as variants without (GN) and with gating (GO). The utilized fatigue detection algorithms include MNF with Welch PSD estimation (kw=15) on the left side and SMR5 in combination with Burg spectral estimation on the right side. Both fatigue detection methods are based on an epoch size of Ne=256 and incorporate a PSD lower bound bl of 35 Hz. The white dots indicate the median value.
Figure A11
Figure A11
The left side displays the influence of the epoch size and gating strategy in case of entropy-based fatigue detection with fApEn. The main blocks on the horizontal axis denote different EMG levels η again. For each of these main blocks, different epoch sizes are shown on the horizontal axis. To assure a balanced comparison of epoch sizes, results from smaller epochs are filtered the same way as described in Figure A12. The applied gating strategy is denoted by the marker and line style. The three applied evaluation criteria (A, B, C) are again covered by the rows of subfigures. Each data point is obtained by averaging over all subjects. The right side compares the best working ECG removal methods for fApEn fatigue detection. Depicted are template subtraction without (TSW35) and with (TSWD35) subsequent wavelet-based damping step. Both methods are shown as variants without (GN) and with gating (GO). The results are based on an epoch size of Ne=256. In contrast to the left side, no filtering of the fatigue index to incorporate one second of EMG was utilized. Because there was no filter, each fatigue index value incorporates only a quarter second of EMG, and the results are therefore not directly comparable to the left side. The white dots indicate the median value.
Figure A12
Figure A12
The influence of epoch size Ne in the case of PSD-based fatigue detection for different combinations of ECG removal method, gating strategy and PSD estimation method. The main blocks on the horizontal axis denote different EMG levels η. Connected data points denote the same EMG level. For each of these main blocks, different epoch sizes are shown on the horizontal axis. To assure a balanced comparison of epoch sizes, the results from smaller epochs underlying fatigue detection signals Φt are filtered. The length of the moving average filter is chosen in a way that each filtered fatigue index data point incorporates EMG from a 1s long window. The results displayed are based on TSWD15 in combination without gating (GN) as well as TSW15 in combination with the gating strategy GO. In the case of pure EMG, a sole high-pass filter (HP15) is applied instead of template subtraction. The applied PSD estimation is color-coded. The Burg method is drawn in red, while Welch methods with kw= 7, 15 and 31 subsegments are shown in green, blue and purple, respectively. The number of values in each Welch subsegment depends on the epoch size. The three applied evaluation criteria (A, B, C) are again covered by the rows of subfigure, while MNF and SMR5 represent the columns. Each data point is obtained by averaging over all subjects.
Figure A13
Figure A13
The influence of PSD lower bound bl. The applied PSD lower bound bl is plotted on the horizontal axis. Only PSD bins corresponding to frequencies above bl are considered in the subsequent calculations. Different EMG levels η are color-coded. The results obtained with QRS segments excluded (gating strategy GO) are shown by dashed lines. The three applied evaluation criteria (A, B, C) are again covered by the rows of subfigure, while MNF and SMR5 represent the columns. The PSD for MNF is again estimated by the Welch method with 15 subsegments, while SMR5 relies on the Burg method. The epoch size is 256 values. Each data point is obtained by averaging over all subjects. Due to the limited frequency resolution of the Welch method with 15 subsegments, only two different results are obtained for each EMG level. At higher EMG levels η, a higher PSD lower bound bl has a negative effect in terms of the introduced disturbances measured by R2 (criterion C). However, it has hardly any effect in respect to the deviation from the reference fatigue index signal (criterion A) and the separability of load cases (criterion B). Regarding lower EMG levels η, the deviation to the reference fatigue index signal and the separability intensely improved towards higher bl. In the case of disturbances (criterion C), the results displayed an optimal choice at values around 30 Hz.
Figure A14
Figure A14
A comparison with intra-heartbeat fatigue detection, as suggested by Sinderby et al. [10]. In the case of the intra-heartbeat approach, only a segment extending between 50% and 75% of the RR interval is utilized. Instead of fixed length epochs, this results in a variable epoch size dependent on the heart rate. Prior to fatigue detection, the resulting segment is furthermore detrended. To ensure a fair comparison, the different epoch sizes must be considered. Suitable to the applied epoch size of Ne=256, a moving average of the last 7 fatigue index values was applied. This assures that EMG segments of one second are incorporated. This corresponds to the procedure that was used when comparing the length of epochs (Figure A12). The intra-heartbeat approach generates one fatigue value per heart cycle. This value is assigned to the end time of the intra-heartbeat EMG segment. With the help of linear interpolation, these values are mapped to the fixed 8 Hz fatigue sampling times. Again, the preceding 7 values are moving average filtered to obtain a filtered fatigue index signal for comparison. Due to the interpolation preceding the filtered intra-heartbeat fatigue signal, sometimes it includes EMG from beyond a strict one second interval. Despite the fact that the filtered intra-heartbeat fatigue signal sometimes include EMG from beyond a strict one second interval, its results (purple colored) are generally not better. In most combinations of EMG levels and evaluation criteria, the intra-heartbeat results scored worse compared to our TSW15 with the gating strategy GO and TSWD15 without gating approaches. This applied for both MNF (left column) as well as SMR5 (right column) fatigue detection algorithms. The black dots indicate the mean value, while the white dots symbolize the median.
Figure 1
Figure 1
Artificial signal construction based on electrocardiographic (ECG) and surface electromyographic (sEMG) signals. (A) shows an sEMG signal from a 60% MVC load case (EMG60t) taken from [16]. Modulation with the weighting signal MSMt (displayed in (B)) to mimic a breathing-like activity pattern yields EMG60Mt displayed in (C). (D,E) display ECG signals ECGISGt and ECGIISGt from channel I and II, respectively. (F) shows the weighting signal WSCt roughly corresponding to the lung volume utilized to mix both ECG channels. Its application yields ECGAt with an increased irregularity displayed in (G). The artificial test signal ATS60,0.05,At based on ECGAt and EMG60Mt is drawn in (H). Note the small amplitude of sEMG components. (I) shows a “cleaned” signal ATS60,0.05,ATSW15t with cardiogenic artifacts removed by template subtraction. Note the change in scale as compared to (H). Some cardiogenic artifacts are still clearly visible in the signal due to the intended ECG irregularity of the artificial signal. (J) shows a signal ATS60,0.05,ATSWD15t with further reduced residual cardiogenic artifacts. All physiological signals are displayed in μV.
Figure 2
Figure 2
Different EMG levels mixed with ECG. The first main row (A) depicts the reference case, including the sEMG modulation but no ECG contamination. The following main rows (BD) depict the cases with η=0.01,0.02and0.05, respectively. For each situation, the 20% and 60% maximum voluntary contraction (MVC) load cases are shown in the first and second sub row. Column (I) shows the reference signal RSMΛt in the case of row (A) and artificial test signals ATSΛ,η,At otherwise. The signals with cardiogenic artifacts removed by template subtraction ATSΛ,η,ATSW15t are shown in the column (II). Corresponding fatigue index signals and their evaluation is visualized in Figure 3.
Figure 3
Figure 3
Exemplary fatigue index signals and their evaluation corresponding to exemplary test signals depicted in Figure 2. The first row represents the reference case, while the following rows visualize cases with η=0.01,0.02and0.05, respectively. Column (III) shows the resulting filtered fatigue index signals for the 20% and 60% MVC load cases in green and red, respectively. Note that each filtered fatigue index data point incorporates sEMG from a 1s long window. The mean frequency (MNF) is used as fatigue algorithm with an epoch size of Ne=256, power spectral density (PSD) estimation with the Welch method (kw=15) and a lower bound bl=35 Hz. Column (IV) shows the distribution of values Φ¯ arising from the last 15 s of both load cases. The difference to one of the overlapping area of both distributions (light blue) corresponds to the Kolmugorov–Smirnov distance used to quantify the separability of fatiguing and non-fatigued situations by γB. The resulting performance evaluation values γA, γB and γC for deviation to the reference fatigue index (■), separability of load cases (●) and disturbances measured by R2 (▲), respectively, are shown in column (V). Values arising from the reference case are drawn in light gray for all other EMG levels.
Figure 4
Figure 4
Fatigue detection results depend on the magnitude and characteristics of the cardiogenic artifacts. This figure juxtaposes the results originating from ECG channel I (ΦΛ,η,ITSW15,GN,256,fdt) and the artificially mixed ECG channel A (ΦΛ,η,ATSW15,GN,256,fdt). Each subfigure includes different EMG levels η plotted on the horizontal axis. Additionally, two cases without ECG contamination are included for reference. The first uncontaminated case contains breathing phase modulation ΞΛGN,256,fdt (based on RSMΛt), while the later ΨΛGN,256,fdt (based on RSΛt) does not. Each row resembles one of the applied evaluation criteria. The discrepancy of fatigue indexes originating from the contaminated signals in relation to the reference fatigue index with modulated EMG only (quantified by γA) is shown in the first row (A,D). The smaller the deviation, the better the fatigue algorithm’s performance. The second row (B,E) visualizes the separability of the 20% and 60% MVC load cases (quantified by γB, the higher the better). The level of disturbances measured by the coefficient of determination R2 (quantified by γC) is depicted in the last row (C,F). The higher R2, the better the fatigue detection method. The template subtraction method TSW15 was applied to compensate cardiogenic artifacts. The subfigures on the left are based on MNF with Welch PSD estimation (kw=15). The subfigures to the right are based on spectral moments ratio of order five (SMR5) with Burg PSD estimation. Both fatigue detection methods are based on an epoch size Ne=256 and utilized a PSD lower bound bl=15 Hz. The black dots indicate the mean value, while the white/orange dots symbolize the median.
Figure 5
Figure 5
The effect of cardiogenic artifact removal on the subsequent fatigue detection. Different methods to reduce the cardiogenic artifacts are compared next to omitting any artifact treatment (gray). Included is the sole application of a high-pass filter (HP15 with fc=15 Hz) and two different variants of template subtraction (TS15 and TSW15). The latter template subtraction utilizes the additional wavelet denoising of the template. Additionally shown is heartbeat synchronous damping in different wavelet scales applied solely (DSO) and subsequent to template subtraction (TSWD15). The results considering gating are shown for each method separately (dashed line-gating strategy GO). In addition to the different EMG levels η, each figure also includes two cases without any ECG contamination. The first case (gray filled) evaluates ΞΛGN,256,fdt, while the second one evaluates ΞΛGO,256,fdt. The second case (gray shaded) introduces a gating based on time information taken over from pure ECG signal. It shows the impact of causeless gating (despite cardiogenic artifacts lacking). This allows an assessment of how much the fatigue detection quality drops by the sole interruptions due to gating. The three applied evaluation criteria are again covered by the rows of subfigures ((A,D), (B,E) and (C,F), respectively), while MNF and SMR5 represent the columns. The Welch method (kw=15) is utilized for MNF, while SMR5 relies on the Burg method. Ne=256 and bl=35 Hz are applied for both methods. Each data point is obtained by averaging over all subjects. A more detailed comparison for a selection of ECG removal algorithms in combination with SMR5 and no gating (corresponding to the solid lines of the right column) can be found in Figure 6. Further comparisons for the algorithms TSW15 and TSWD15 can be found in the Appendix A Figure A10 and Figure A11).
Figure 6
Figure 6
A detailed comparison of selected cardiogenic artifact removal methods regarding their impact on the subsequent fatigue detection by SMR5 method and no gating. The shown violin plots correspond to solid lines in the same color from the right column of Figure 5. The best performing ECG removal method was determined for each group of four violin plots sharing the same EMG level and evaluation category. The existence of significant differences to the other three algorithms were evaluated for each group. If significant differences exist, the corresponding p-values are stated. SMR5 is calculated with Ne=256 and bl=35 Hz and utilized the Burg method for spectral estimation.
Figure 7
Figure 7
A comparison of fatigue detection algorithms. The results of MNF, SMR5 and fuzzy approximate entropy (fApEn) methods are shown in combination with ECG removal by TSWD and no gating (solid lines) as well as TSW and gating (dashed dotted lines). MNF is utilized with Welch (kw=15) and SMR5 with Burg PSD. Both PSD-based algorithms include a PSD lower bound bl of 35 Hz, while fApEn includes a 35 Hz high-pass filter within the ECG removal step. All fatigue detection methods are based on epoch size Ne=256. The results are shown as the mean value obtained by averaging over all subjects. Note that the distributions underlying the shown mean values are visualized in Figure 8.
Figure 8
Figure 8
A detailed comparison of fatigue detection algorithms. The left column displays the results based on TSWD artifact removal method (including the wavelet-based damping step) without QRS gating (corresponding to solid lines in Figure 7). The right visualizes the results based on template subtraction TSW15 with QRS gating (GO), corresponding to dashed dotted lines in Figure 7. Fatigue algorithms include MNF, SMR5 and fApEn with the same parameters as in Figure 7. The best-performing fatigue detection method was determined for each group of three violin plots sharing the same EMG level and evaluation category. The existence of significant differences to the other two methods were evaluated for each group. If significant differences were found, the corresponding p-values are stated. The white dots symbolize the median value. The horizontal axis denotes EMG levels η. The three applied evaluation criteria (A, B, C) are covered by the rows.

Similar articles

Cited by

  • Analysis and applications of respiratory surface EMG: report of a round table meeting.
    Jonkman AH, Warnaar RSP, Baccinelli W, Carbon NM, D'Cruz RF, Doorduin J, van Doorn JLM, Elshof J, Estrada-Petrocelli L, Graßhoff J, Heunks LMA, Koopman AA, Langer D, Moore CM, Nunez Silveira JM, Petersen E, Poddighe D, Ramsay M, Rodrigues A, Roesthuis LH, Rossel A, Torres A, Duiverman ML, Oppersma E. Jonkman AH, et al. Crit Care. 2024 Jan 2;28(1):2. doi: 10.1186/s13054-023-04779-x. Crit Care. 2024. PMID: 38166968 Free PMC article. Review.

References

    1. Piper H.E. Über die Ermüdung bei willkürlichen Muskelkontraktionen. Arch. Anat. Physiol. 1909;4:491–498.
    1. Lindström L., Kadefors R., Petersen I. An electromyographic index for localized muscle fatigue. J. Appl. Physiol. 1977;43:750–754. doi: 10.1152/jappl.1977.43.4.750. - DOI - PubMed
    1. Stulen F.B., De Luca C.J. Muscle fatigue monitor: A non-invasive device for observing localized muscular fatigue. IEEE Trans. Biomed. Eng. 1982;29:760–768. doi: 10.1109/TBME.1982.324871. - DOI - PubMed
    1. Roussos C., Macklem P. Diaphragmatic fatigue in man. J. Appl. Physiol. 1977;43:189–197. doi: 10.1152/jappl.1977.43.2.189. - DOI - PubMed
    1. Sieck G.C., Mazar A., Belman M.J. Changes in diaphragmatic EMG spectra during hyperpneic loads. Respir. Physiol. 1985;61:137–152. doi: 10.1016/0034-5687(85)90121-5. - DOI - PubMed