

HPV DeepSeq: An Ultra-Fast Method of NGS Data Analysis and Visualization Using Automated Workflows and a Customized Papillomavirus Database in CLC Genomics Workbench
- PMID: 34451490
- PMCID: PMC8398645
- DOI: 10.3390/pathogens10081026
HPV DeepSeq: An Ultra-Fast Method of NGS Data Analysis and Visualization Using Automated Workflows and a Customized Papillomavirus Database in CLC Genomics Workbench
Abstract
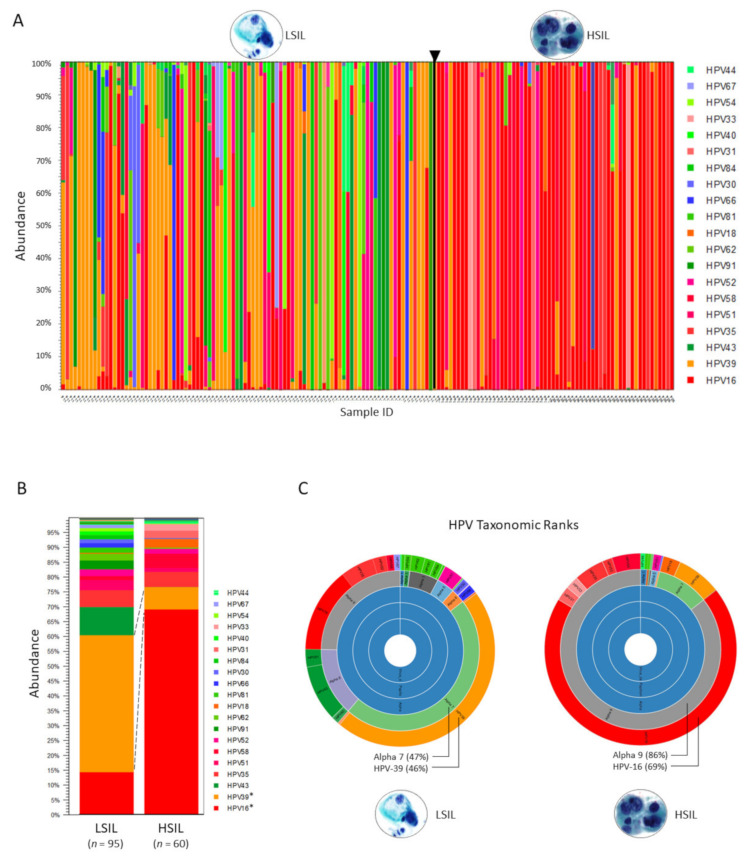
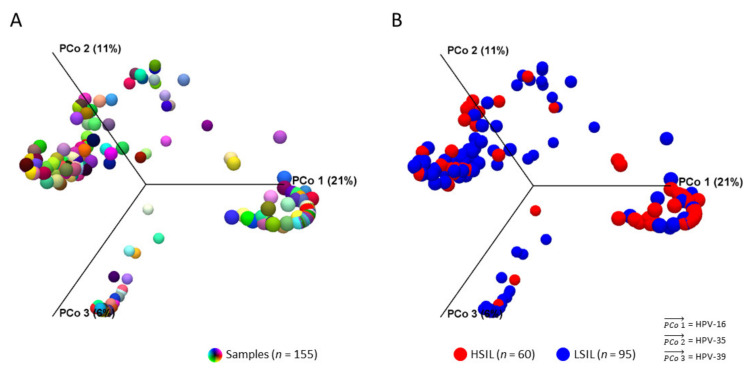
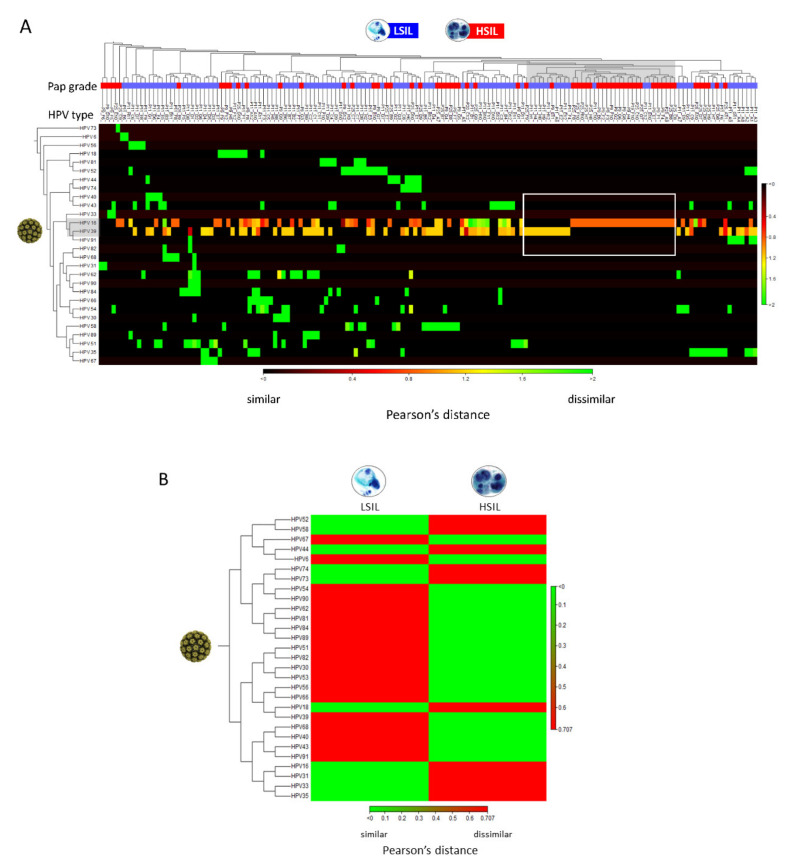
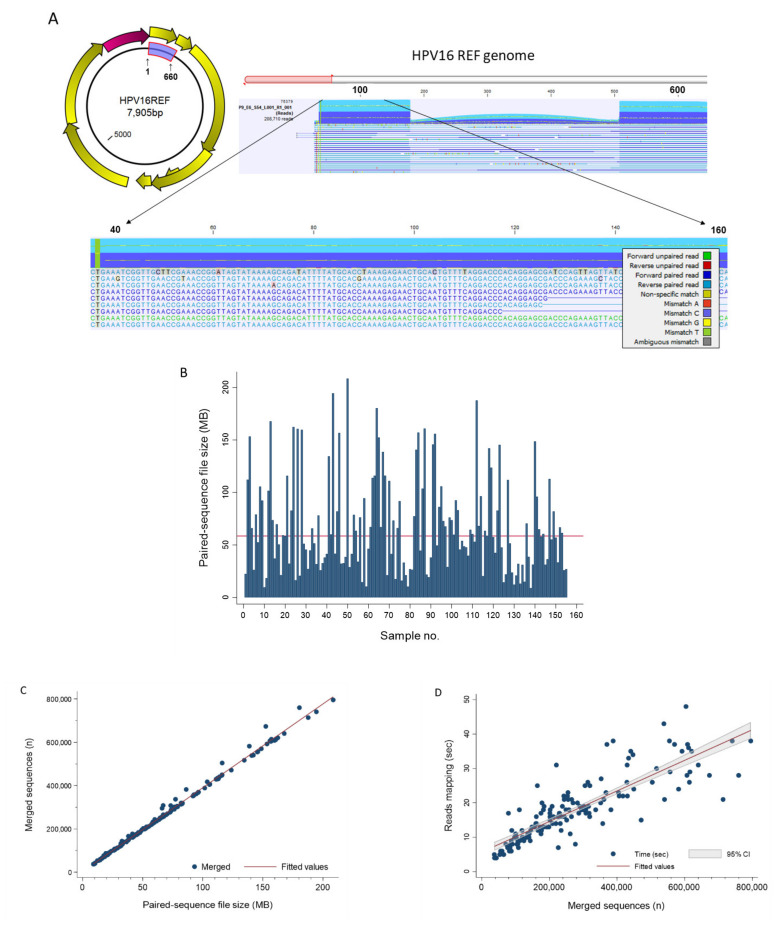
Next-generation sequencing (NGS) has actualized the human papillomavirus (HPV) virome profiling for in-depth investigation of viral evolution and pathogenesis. However, viral computational analysis remains a bottleneck due to semantic discrepancies between computational tools and curated reference genomes. To address this, we developed and tested automated workflows for HPV taxonomic profiling and visualization using a customized papillomavirus database in the CLC Microbial Genomics Module. HPV genomes from Papilloma Virus Episteme were customized and incorporated into CLC "ready-to-use" workflows for stepwise data processing to include: (1) Taxonomic Analysis, (2) Estimate Alpha/Beta Diversities, and (3) Map Reads to Reference. Low-grade (n = 95) and high-grade (n = 60) Pap smears were tested with ensuing collective runtimes: Taxonomic Analysis (36 min); Alpha/Beta Diversities (5 s); Map Reads (45 min). Tabular output conversion to visualizations entailed 1-2 keystrokes. Biodiversity analysis between low- (LSIL) and high-grade squamous intraepithelial lesions (HSIL) revealed loss of species richness and gain of dominance by HPV-16 in HSIL. Integrating clinically relevant, taxonomized HPV reference genomes within automated workflows proved to be an ultra-fast method of virome profiling. The entire process named "HPV DeepSeq" provides a simple, accurate and practical means of NGS data analysis for a broad range of applications in viral research.
Keywords: HPV genotyping; bioinformatics; cervical cancer; deep sequencing; human papillomavirus; metagenome; next generation sequencing; taxonomic classification; virome.
Conflict of interest statement
The Defense Health Agency (DHA) of the U.S. Department of Defense has licensed the customized HPV database described herein to QIAGEN Digital Insights. The inventor of the customized taxonomy is J.S.-G. No potential conflicts of interest were disclosed by the other authors. The funders had no role in the design of the study; in the collection, analyses, or interpretation of data; in the writing of the manuscript, or in the decision to publish the results.
Figures
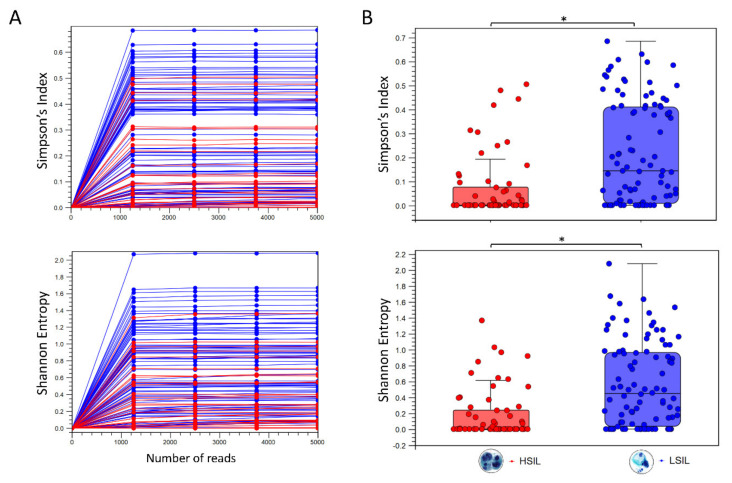
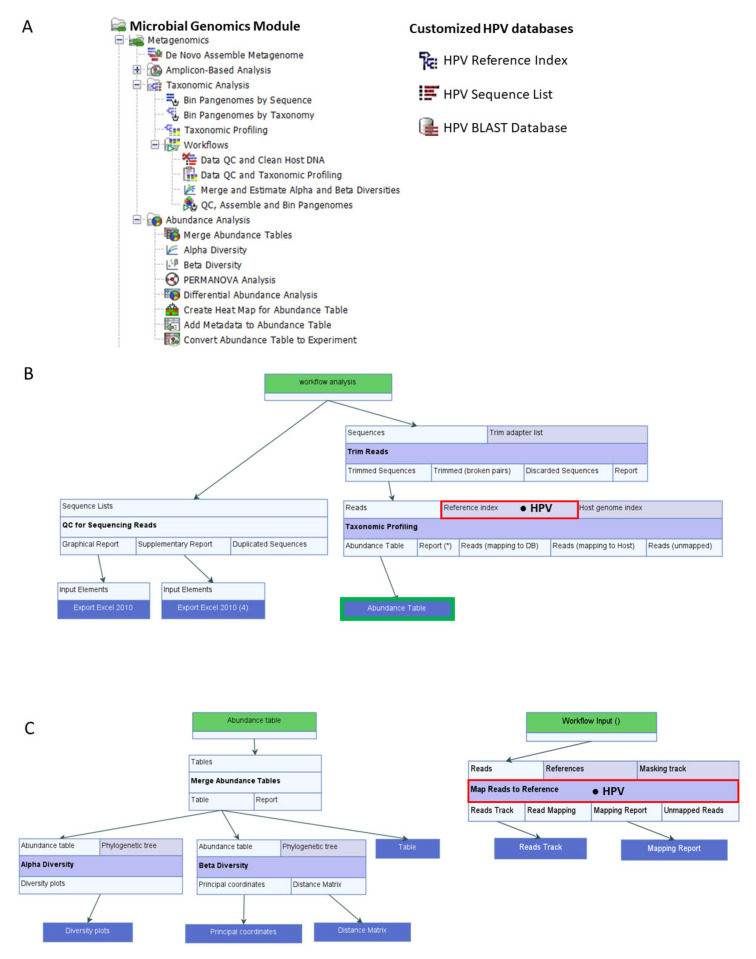
 ) is utilized as the input file for downstream diversity analysis shown in (C). (C) Merge and Estimate Alpha and Beta Diversities workflow generates diversity plots and statistical results (left). Map Reads to Reference workflow incorporating the HPV Sequence List (● HPV) generates an alignment map of the reads on the reference HPV genomes (right).
Similar articles
-
HPV Integration Site Mapping: A Rapid Method of Viral Integration Site (VIS) Analysis and Visualization Using Automated Workflows in CLC Microbial Genomics.Int J Mol Sci. 2022 Jul 23;23(15):8132. doi: 10.3390/ijms23158132. Int J Mol Sci. 2022. PMID: 35897706 Free PMC article.
-
Abundance of HPV L1 Intra-Genotype Variants With Capsid Epitopic Modifications Found Within Low- and High-Grade Pap Smears With Potential Implications for Vaccinology.Front Genet. 2019 May 24;10:489. doi: 10.3389/fgene.2019.00489. eCollection 2019. Front Genet. 2019. PMID: 31231420 Free PMC article.
-
A Customized Monkeypox Virus Genomic Database (MPXV DB v1.0) for Rapid Sequence Analysis and Phylogenomic Discoveries in CLC Microbial Genomics.Viruses. 2022 Dec 22;15(1):40. doi: 10.3390/v15010040. Viruses. 2022. PMID: 36680080 Free PMC article.
-
Next generation sequencing for human papillomavirus genotyping.J Clin Virol. 2013 Oct;58(2):437-42. doi: 10.1016/j.jcv.2013.07.013. Epub 2013 Aug 8. J Clin Virol. 2013. PMID: 23932809
-
Targeted next generation sequencing panel for HPV genotyping in cervical cancer.Exp Mol Pathol. 2021 Feb;118:104568. doi: 10.1016/j.yexmp.2020.104568. Epub 2020 Nov 7. Exp Mol Pathol. 2021. PMID: 33171155
Cited by
-
HPV Integration Site Mapping: A Rapid Method of Viral Integration Site (VIS) Analysis and Visualization Using Automated Workflows in CLC Microbial Genomics.Int J Mol Sci. 2022 Jul 23;23(15):8132. doi: 10.3390/ijms23158132. Int J Mol Sci. 2022. PMID: 35897706 Free PMC article.
-
Epigenetic and Transcriptomic Regulation Landscape in HPV+ Cancers: Biological and Clinical Implications.Front Genet. 2022 Jun 14;13:886613. doi: 10.3389/fgene.2022.886613. eCollection 2022. Front Genet. 2022. PMID: 35774512 Free PMC article. Review.
-
HPV, HBV, and HIV-1 Viral Integration Site Mapping: A Streamlined Workflow from NGS to Genomic Insights of Carcinogenesis.Viruses. 2024 Jun 18;16(6):975. doi: 10.3390/v16060975. Viruses. 2024. PMID: 38932267 Free PMC article.
-
Correlation between the gut microbiome and neurodegenerative diseases: a review of metagenomics evidence.Neural Regen Res. 2024 Apr;19(4):833-845. doi: 10.4103/1673-5374.382223. Neural Regen Res. 2024. PMID: 37843219 Free PMC article. Review.
References
-
- Mammas I.N., Spandidos D.A. Four historic legends in human papillomaviruses research. J. BUON. 2015;20:658–661. - PubMed
-
- International Agency for Research on Cancer . Monographs on the Evaluation of Carcinogenic Risks to Humans-Human Papillomaviruses. World Health Organization; Geneva, Switzerland: 2012. pp. 255–313.
Grants and funding
LinkOut - more resources
Full Text Sources
Research Materials
