. 2021 Aug 5;10(8):1611.
doi: 10.3390/plants10081611.

Patterns of Genetic Variation in a Soybean Germplasm Collection as Characterized with Genotyping-by-Sequencing

Affiliations

Patterns of Genetic Variation in a Soybean Germplasm Collection as Characterized with Genotyping-by-Sequencing

Yong-Bi Fu et al. Plants (Basel). .

Abstract

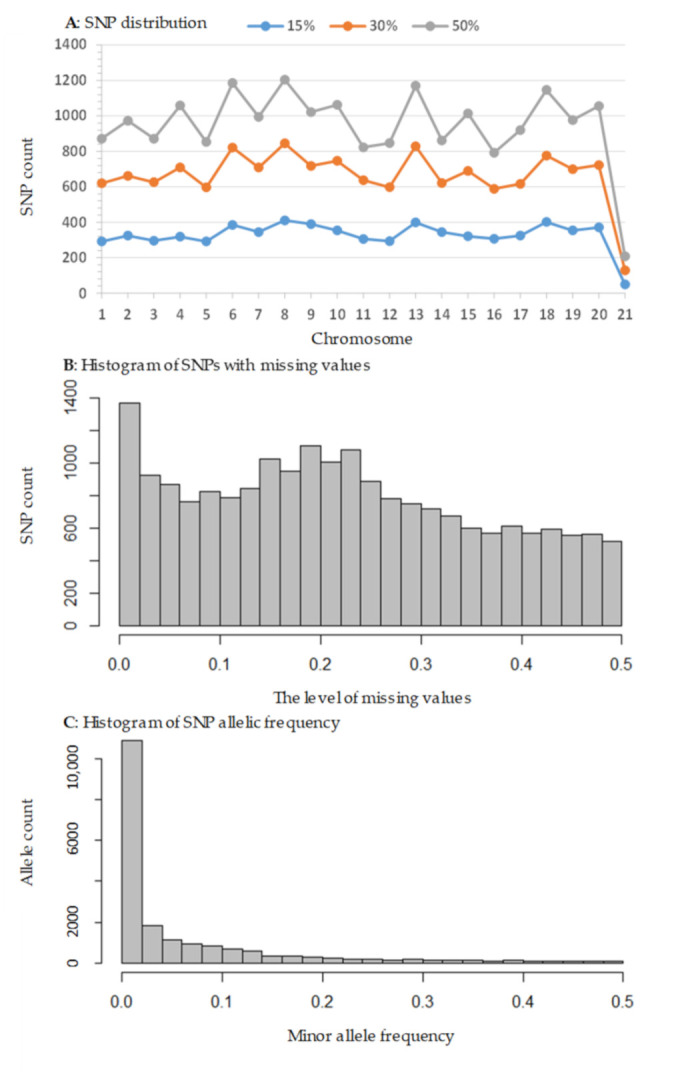
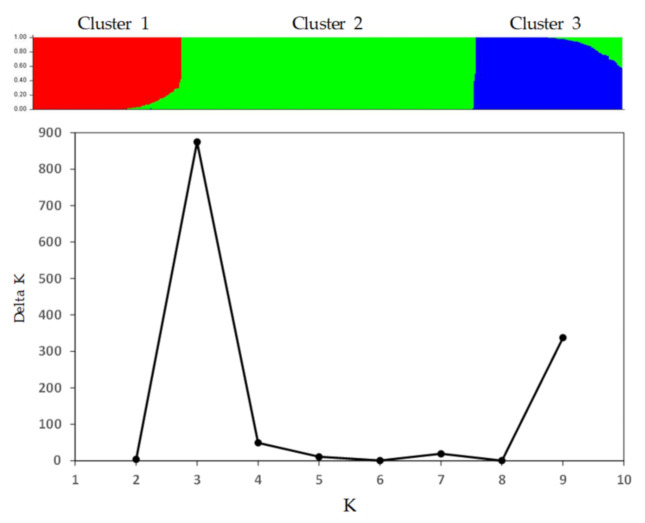
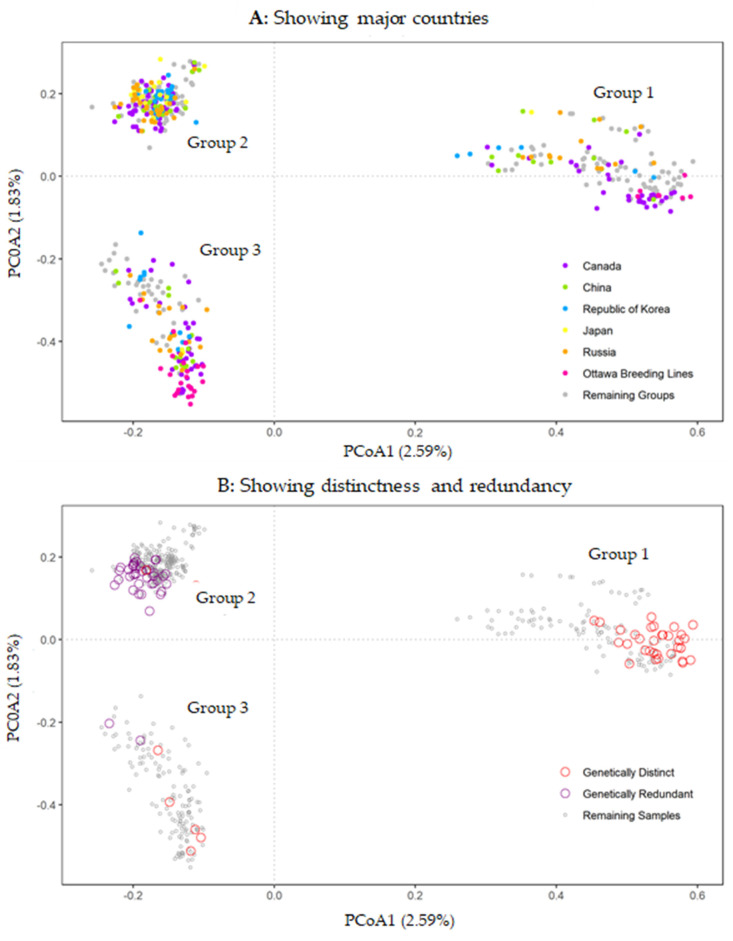
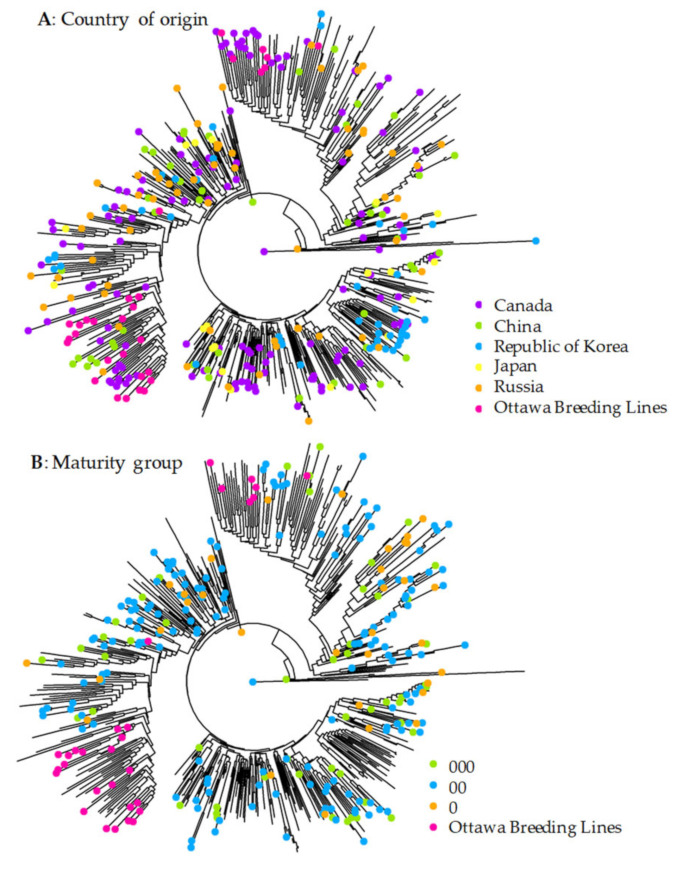
Genomic characterization is playing an increasing role in plant germplasm conservation and utilization, as it can provide higher resolution with genome-wide SNP markers than before to identify and analyze genetic variation. A genotyping-by-sequencing technique was applied to genotype 541 soybean accessions conserved at Plant Gene Resources of Canada and 30 soybean cultivars and breeding lines developed by the Ottawa soybean breeding program of Agriculture and Agri-Food Canada. The sequencing generated an average of 952,074 raw sequence reads per sample. SNP calling identified 43,891 SNPs across 20 soybean chromosomes and 69 scaffolds with variable levels of missing values. Based on 19,898 SNPs with up to 50% missing values, three distinct genetic groups were found in the assayed samples. These groups were a mixture of the samples that originated from different countries and the samples of known maturity groups. The samples that originated from Canada were clustered into all three distinct groups, but 30 Ottawa breeding lines fell into two groups only. Based on the average pairwise dissimilarity estimates, 40 samples with the most genetic distinctness were identified from three genetic groups with diverse sample origin and known maturity. Additionally, 40 samples with the highest genetic redundancy were detected and they consisted of different sample origins and maturity groups, largely from one genetic group. Moreover, some genetically duplicated samples were identified, but the overall level of genetic duplication was relatively low in the collection. These findings are useful for soybean germplasm management and utilization.

Keywords: accession duplication; genetic distinctness; genetic redundancy; genomic characterization; genotyping-by-sequencing; soybean.


Conflict of interest statement

The authors declare no conflict of interest.

Figures

Figure 1
Figure 1
The frequency distribution of SNPs identified in this study with respect to chromosome (A), the level of missing values (B) and minor allele frequency (C). Panel (A) shows the SNP counts over all 20 chromosomes for SNPs with three levels of missing values (15%, 30% and 50%) across the 571 samples. Note that chromosome 21 represents all 69 scaffolds. Panel (B) displays the SNP counts with respect to missing value levels ranging from 0 to 50%. Panel (C) shows the minor allele frequency distribution in the dataset of SNPs with a 50% missing value level.
Figure 2
Figure 2
Three genetic clusters of 571 soybean samples inferred by STRUCTURE based on 19,898 SNP markers. The upper panel displays the sorted mixture coefficients of 571 samples with K = 3. The lower panel shows the support for three optimal clusters based on Delta K estimates.
Figure 3
Figure 3
PCoA plots of 571 soybean accessions based on 19,898 SNP genotype data with a missing value level of up to 50%. Panel (A) displays the accessions originated from Canada, China, the Republic of Korea, Japan, and Russia, as highlighted in different colours, while the remaining groups are shown in grey. Three groups are also labelled. Panel (B) shows 40 genetically distinct samples in open red circles and 40 genetically redundant samples in open purple circles, while the remaining samples are shown in open grey circles.
Figure 4
Figure 4
The neighbor-joining tree of 571 soybean accessions of different origins based on 19,898 SNP genotype data with a missing value level of up to 50%. Panels (A,B) are the same, but have different sample labels. Panel (A) shows the accessions originated from Canada, China, the Republic of Korea, Japan, and Russia. Panel (B) highlights three maturity groups and Ottawa breeding lines.

Similar articles

Cited by

References

    1. McCouch S.R., McNally K.L., Wang W., Sackville H.R. Genomics of gene banks: A case study in rice. Am. J. Bot. 2012;99:407–423. doi: 10.3732/ajb.1100385. - DOI - PubMed
    1. Li J.Y., Wang J., Zeigler R.S. The 3000 rice genomes project: New opportunities and challenges for future rice research. GigaScience. 2014;3:8. doi: 10.1186/2047-217X-3-8. - DOI - PMC - PubMed
    1. Milner S.G., Jost M., Taketa S., Mazón E.R., Himmelbach A., Oppermann M., Weise S., Knüpffer H., Basterrechea M., König P., et al. Genebank genomics reveals the diversity of a global barley collection. Nat. Genet. 2019;51:319–326. doi: 10.1038/s41588-018-0266-x. - DOI - PubMed
    1. Sansaloni C., Franco J., Santos B., Percival-Alwyn L., Singh S., Petroli C., Campos J., Dreher K., Payne T., Marshall D., et al. Diversity analysis of 80,000 wheat accessions reveals consequences and opportunities of selection footprints. Nat. Commun. 2020;11:4572. doi: 10.1038/s41467-020-18404-w. - DOI - PMC - PubMed
    1. McCouch S., Navabi Z.K., Abberton M., Anglin N.L., Barbieri R.L., Baum M., Bett K., Booker H., Brown G.L., Bryan G.J., et al. Mobilizing crop biodiversity. Mol. Plant. 2020;13:1341–1344. doi: 10.1016/j.molp.2020.08.011. - DOI - PubMed

LinkOut - more resources