. 2021 Aug 9;10(8):1636.
doi: 10.3390/plants10081636.

Metabolomics Response to Drought Stress in Morus alba L. Variety Yu-711

Affiliations

Metabolomics Response to Drought Stress in Morus alba L. Variety Yu-711

Michael Ackah et al. Plants (Basel). .

Abstract

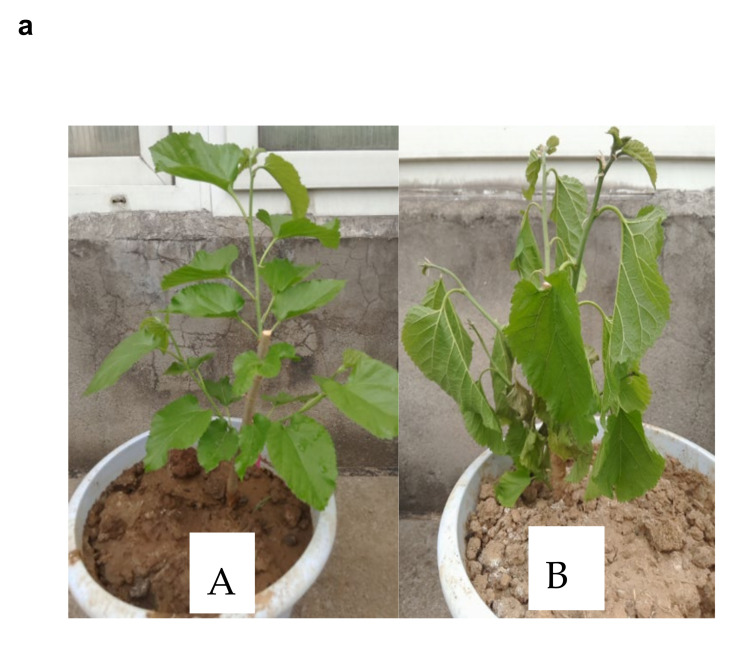
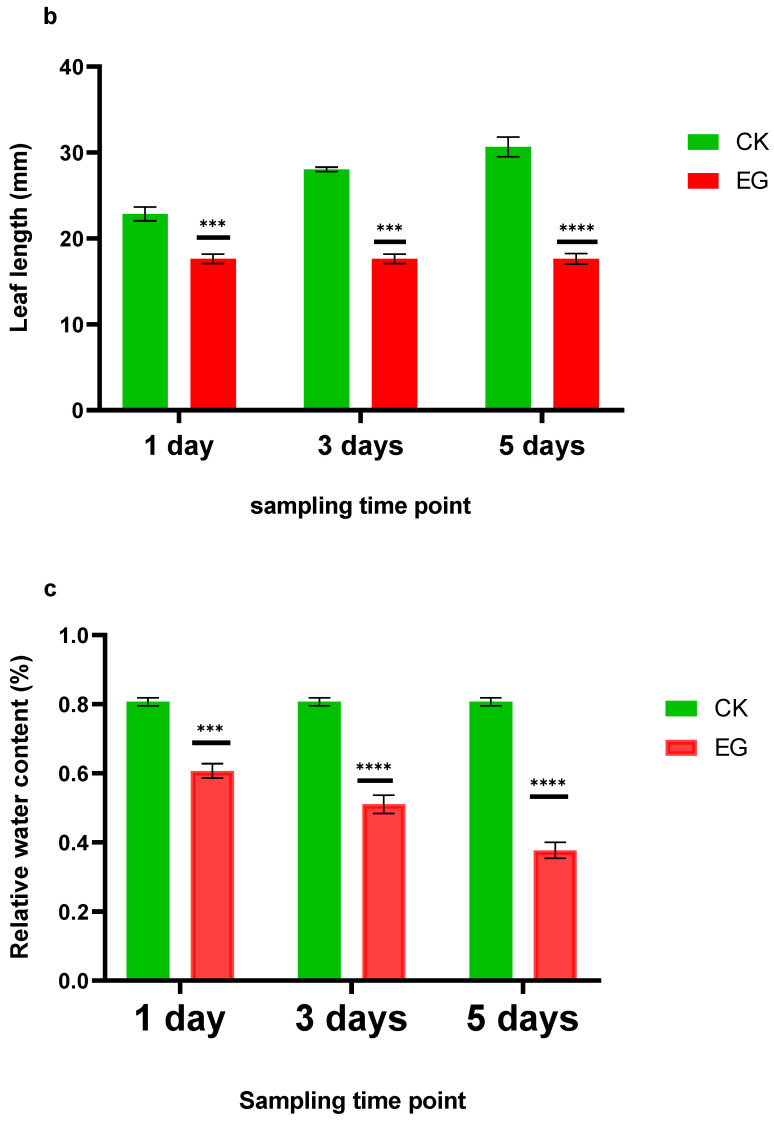
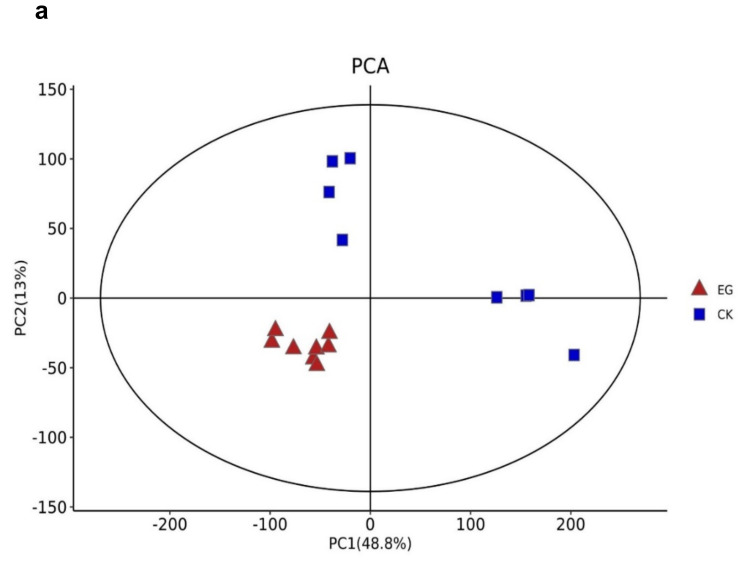
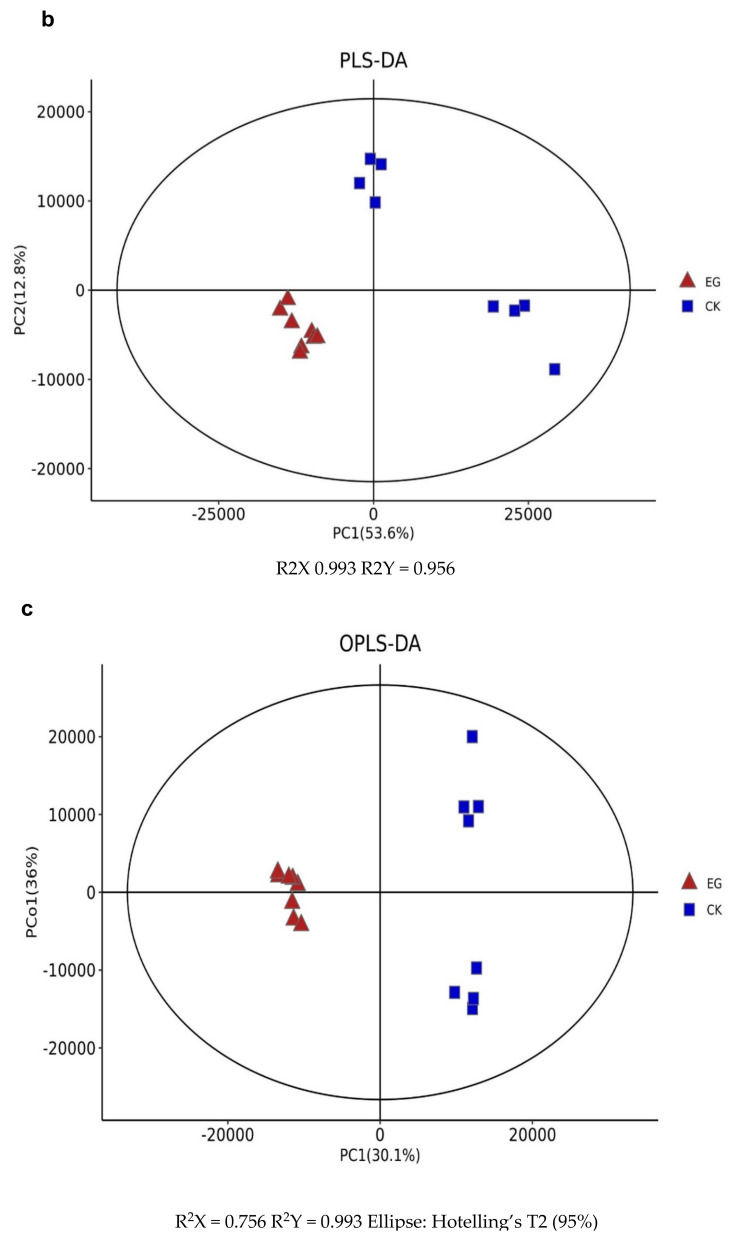
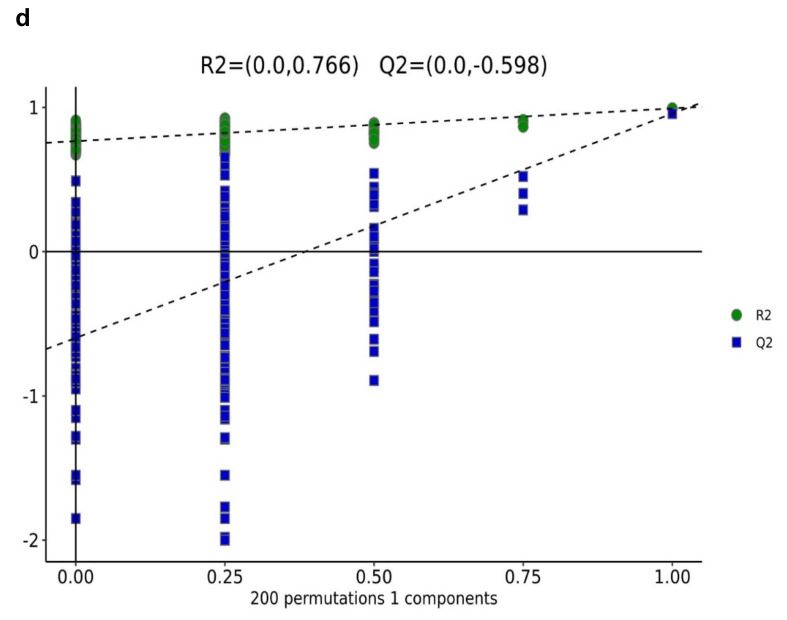
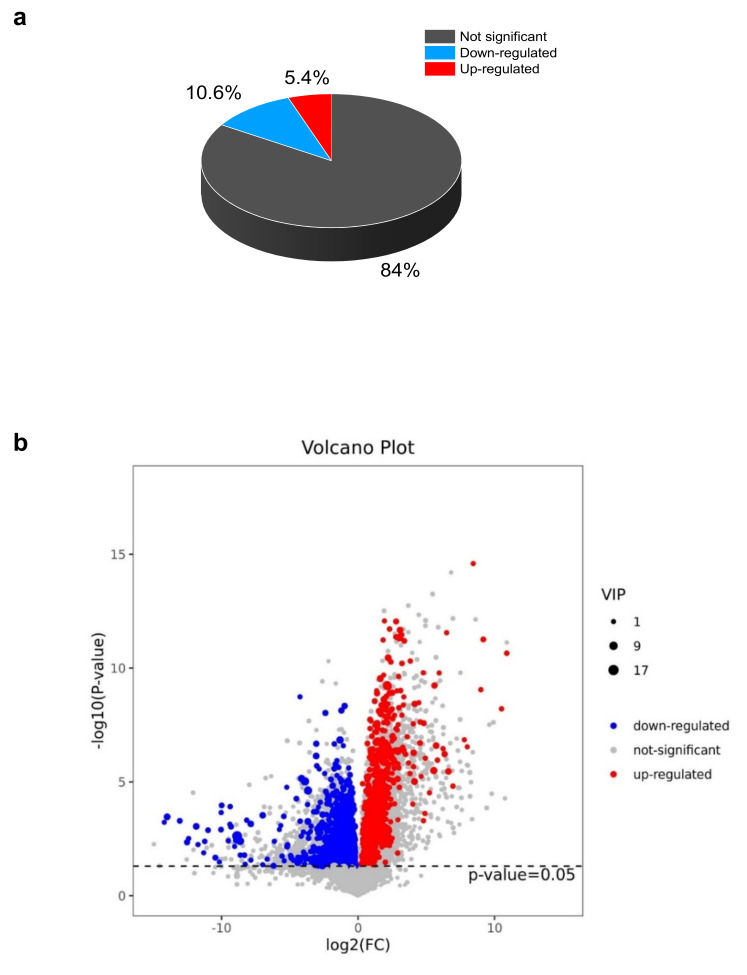
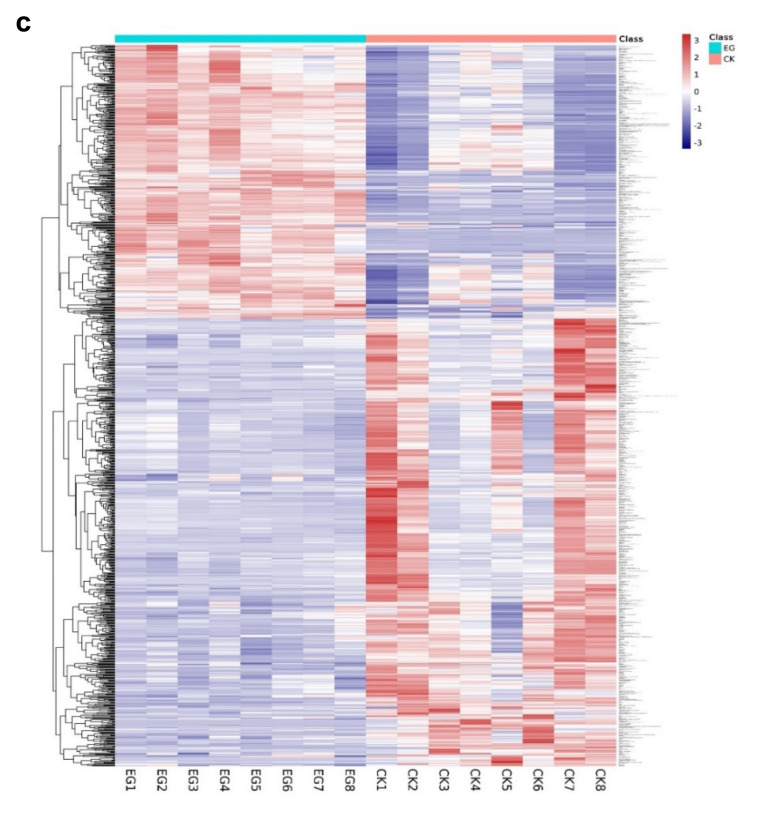
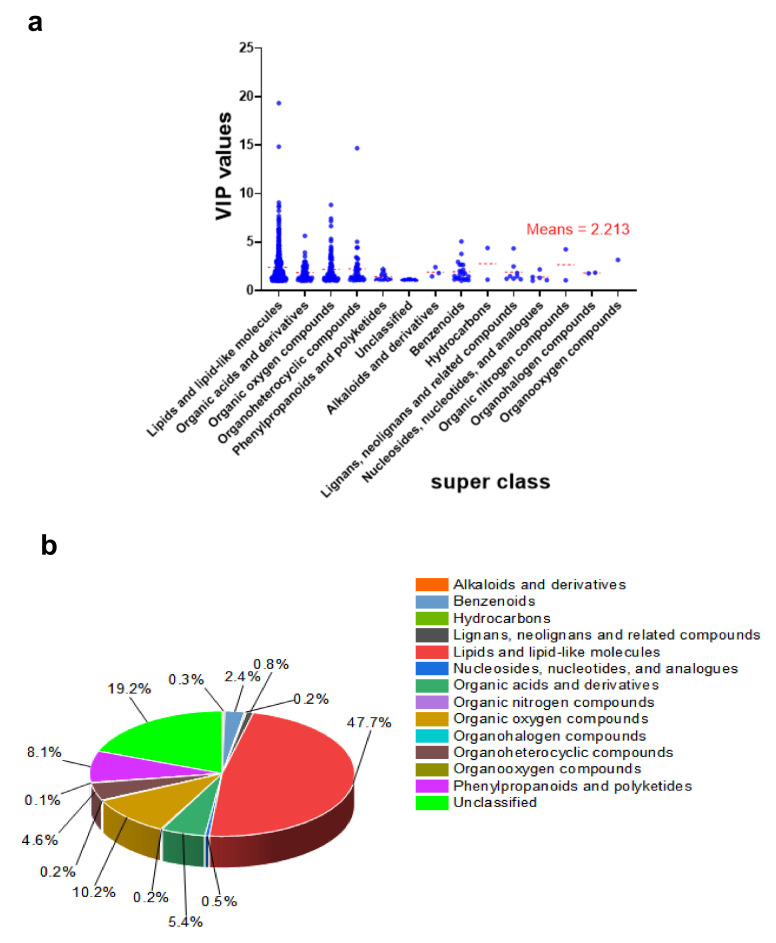
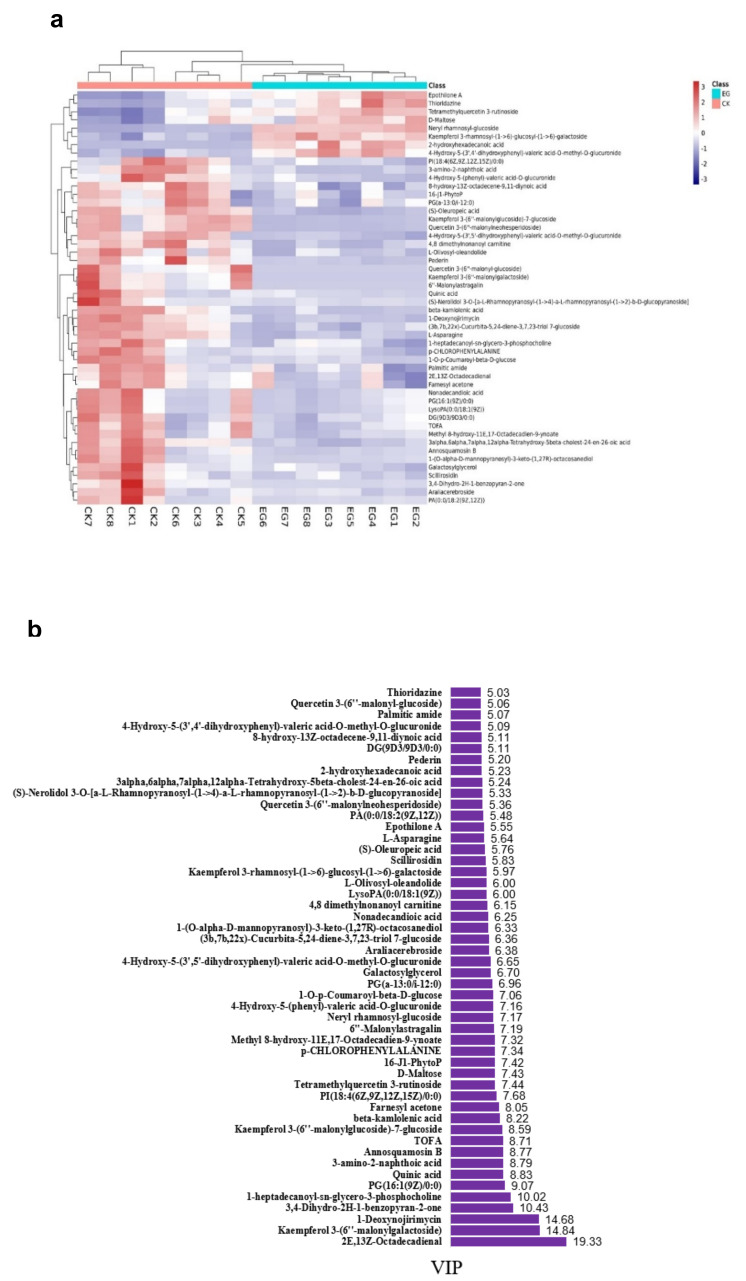
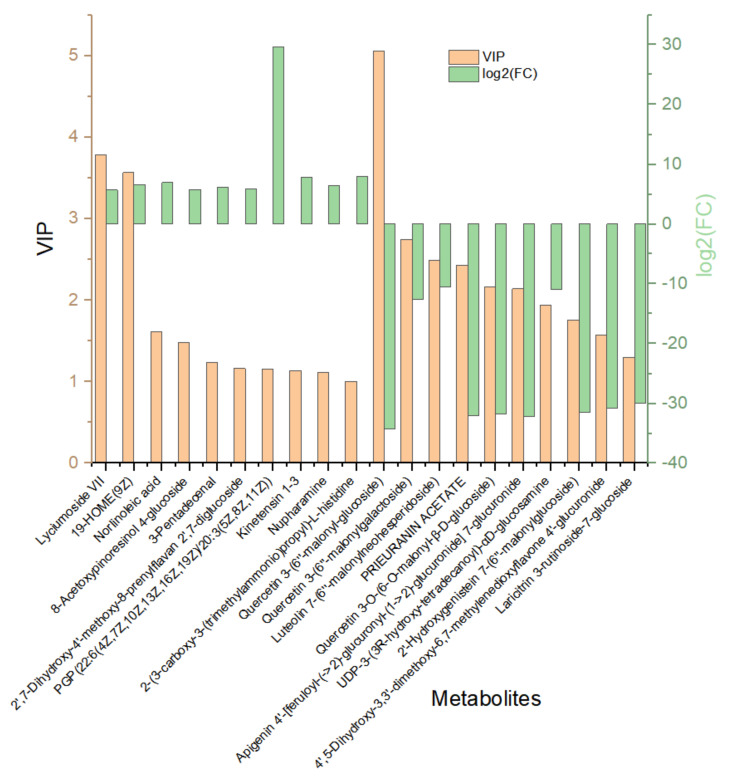
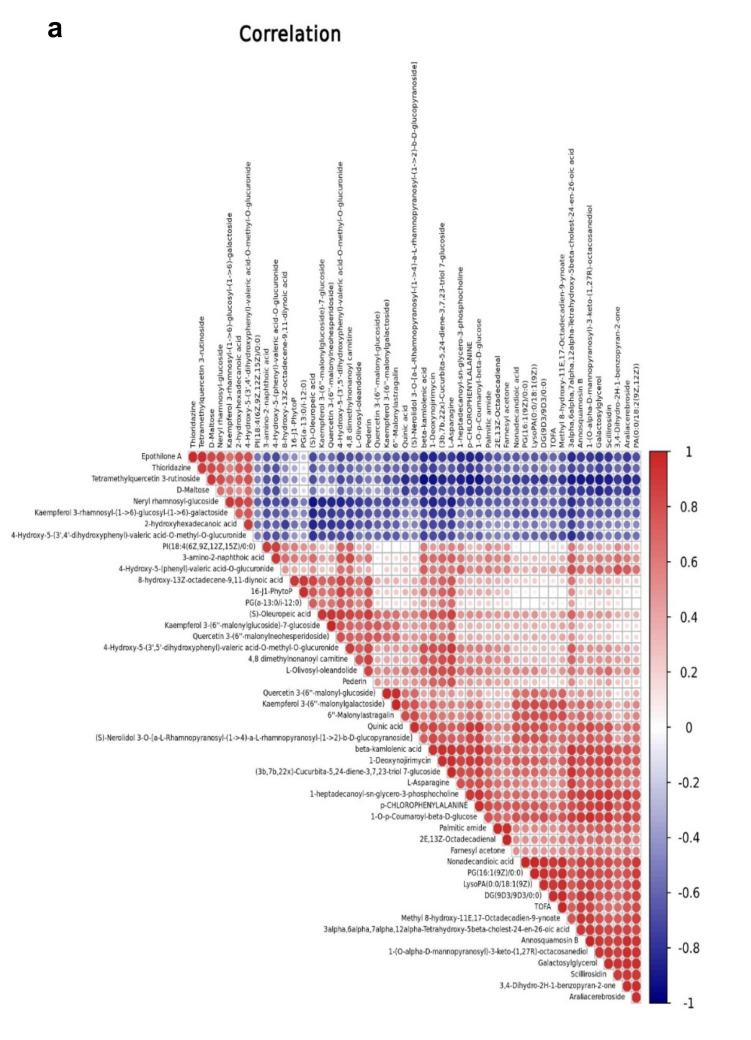
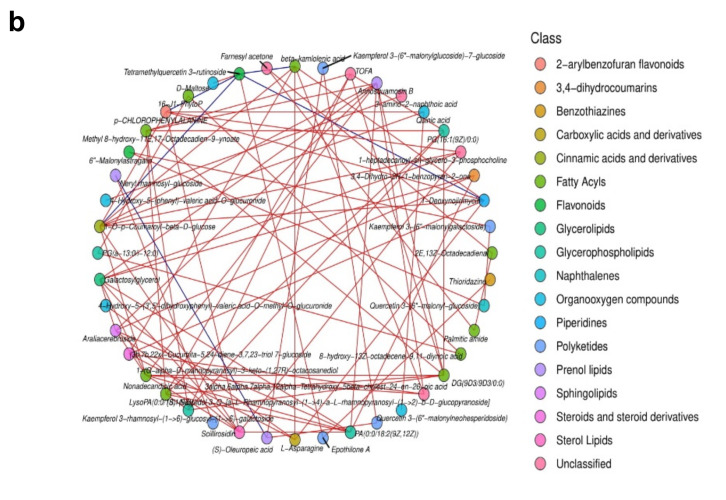
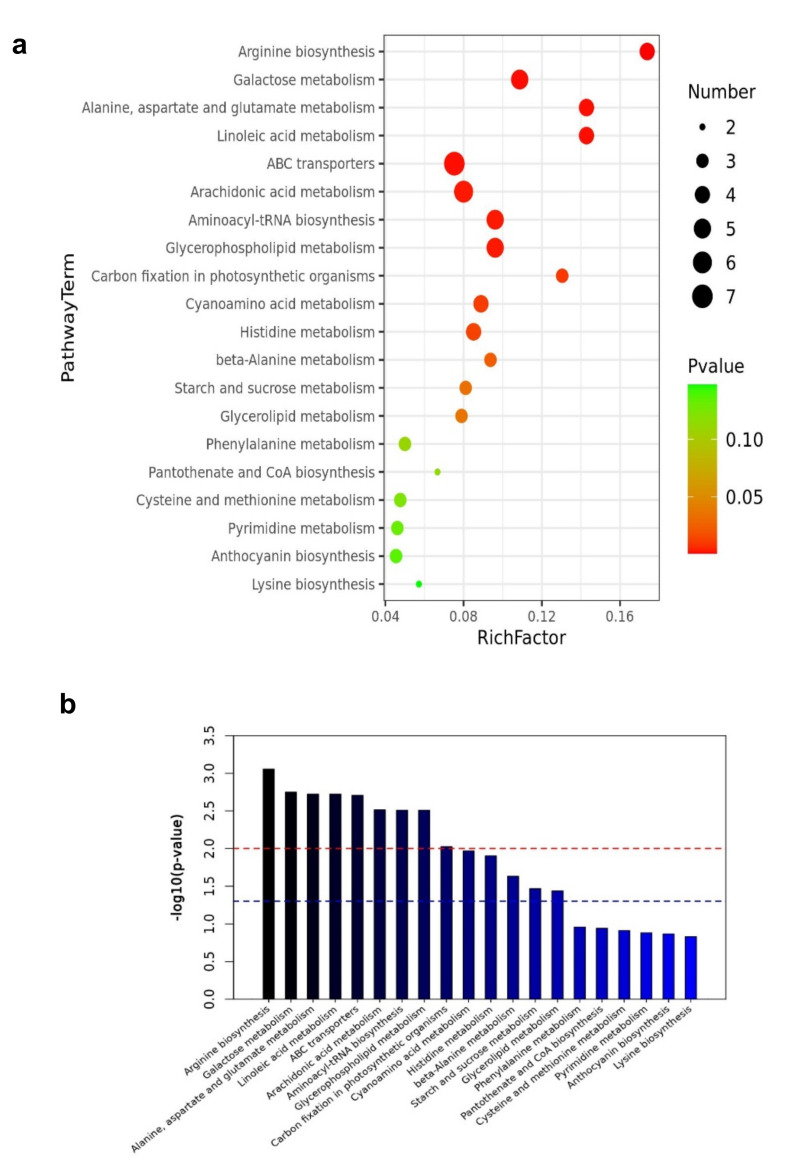
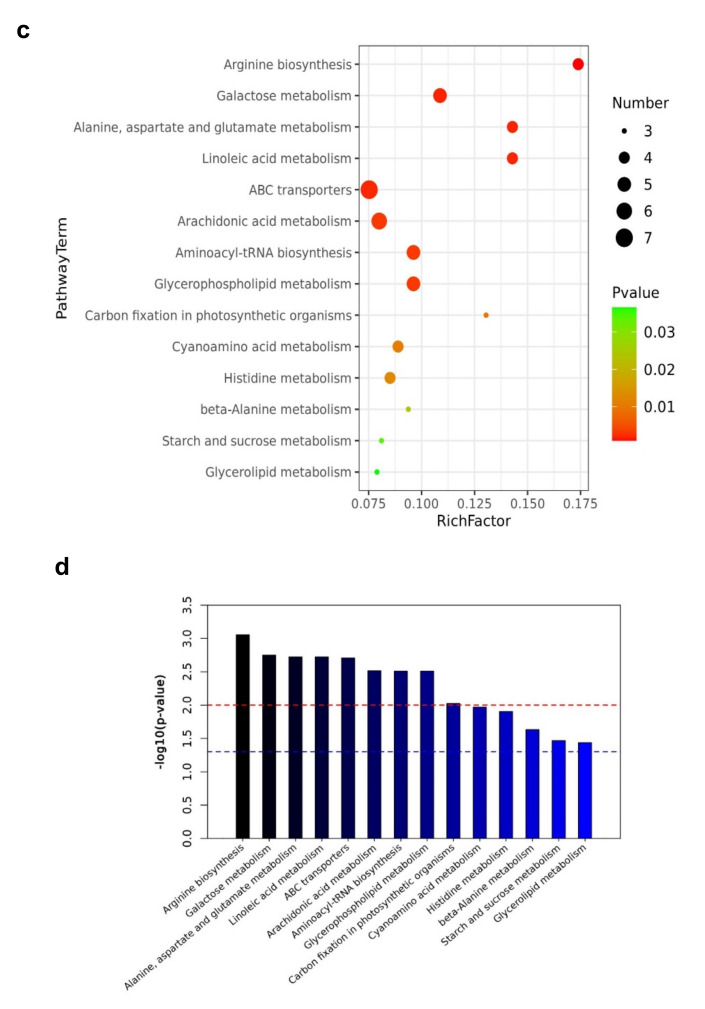
Mulberry is an economically significant crop for the sericulture industry worldwide. Stresses such as drought exposure have a significant influence on plant survival. Because metabolome directly reflects plant physiological condition, performing a global metabolomic analysis is one technique to examine this influence. Using a liquid chromatography-mass spectrometry (LC-MS) technique based on an untargeted metabolomic approach, the effect of drought stress on mulberry Yu-711 metabolic balance was examined. For this objective, Yu-711 leaves were subjected to two weeks of drought stress treatment and control without drought stress. Numerous differentially accumulated metabolic components in response to drought stress treatment were revealed by multivariate and univariate statistical analysis. Drought stress treatment (EG) revealed a more differentiated metabolite response than the control (CK). We found that the levels of total lipids, galactolipids, and phospholipids (PC, PA, PE) were significantly altered, producing 48% of the total differentially expressed metabolites. Fatty acyls components were the most abundant lipids expressed and decreased considerably by 73.6%. On the other hand, the prenol lipids class of lipids increased in drought leaves. Other classes of metabolites, including polyphenols (flavonoids and cinnamic acid), organic acid (amino acids), carbohydrates, benzenoids, and organoheterocyclic, had a dynamic trend in response to the drought stress. However, their levels under drought stress decreased significantly compared to the control. These findings give an overview for the understanding of global plant metabolic changes in defense mechanisms by revealing the mulberry plant metabolic profile through differentially accumulated compounds.

Keywords: LC-MS; drought stress; metabolites; mulberry; untargeted approach.


Conflict of interest statement

The authors declare no conflict of interest.

Figures

Figure 1
Figure 1
Physiological responses of seedling leaves affected by drought and the control treatment. (a) Mulberry seedlings under drought and control experimental setup. (Panel A); seedlings under control treatment. (Panel B); seedlings under drought stress treatment at the five days time point. (b) Leaf length measured at one days, three days, and five days time points. (c) The relative water content at one days, three days, and five days time points. The values in a and b are represented as mean ± SD of three replicates with three plants per replicate. The asterisks (***) and (****) denote a significant and highly significant difference, respectively (p < 0.05) according to a two-tailed Student t-test using GraphPad Prism 9. CK; Control treatment group. EG; Drought stress treatment group.
Figure 1
Figure 1
Physiological responses of seedling leaves affected by drought and the control treatment. (a) Mulberry seedlings under drought and control experimental setup. (Panel A); seedlings under control treatment. (Panel B); seedlings under drought stress treatment at the five days time point. (b) Leaf length measured at one days, three days, and five days time points. (c) The relative water content at one days, three days, and five days time points. The values in a and b are represented as mean ± SD of three replicates with three plants per replicate. The asterisks (***) and (****) denote a significant and highly significant difference, respectively (p < 0.05) according to a two-tailed Student t-test using GraphPad Prism 9. CK; Control treatment group. EG; Drought stress treatment group.
Figure 2
Figure 2
Sample peaks and metabolites. (a) Peaks at the positive ion mode. (b) Peaks at the negative ion mode. (c) Bar chart of all sample peaks and the corresponding metabolites in both the negative and positive mode. (d) Metabolite intensity distribution between EG, CK, and QC. QC; quality control.
Figure 2
Figure 2
Sample peaks and metabolites. (a) Peaks at the positive ion mode. (b) Peaks at the negative ion mode. (c) Bar chart of all sample peaks and the corresponding metabolites in both the negative and positive mode. (d) Metabolite intensity distribution between EG, CK, and QC. QC; quality control.
Figure 3
Figure 3
The difference in metabolites between EG and CK in mulberry (Yu-711) leaves based on multivariate statistical analysis. (a) Principal component analysis (PCA). (b) Partial least-squares-discriminant analysis (PLS-DA). (c) Orthogonal partial least-squares-discriminant analysis (OPLS-DA). (d) A 200 times permutation test of OPLS-DA mode. R2 = (0.0, 0.766); Q2 = (0.0, -0.598).
Figure 3
Figure 3
The difference in metabolites between EG and CK in mulberry (Yu-711) leaves based on multivariate statistical analysis. (a) Principal component analysis (PCA). (b) Partial least-squares-discriminant analysis (PLS-DA). (c) Orthogonal partial least-squares-discriminant analysis (OPLS-DA). (d) A 200 times permutation test of OPLS-DA mode. R2 = (0.0, 0.766); Q2 = (0.0, -0.598).
Figure 4
Figure 4
The fold change (FC) arrangement and pattern of the main differential metabolites in EG_CK in Yu-711 leaves. (a) The proportion of differential metabolites in EG_CK. (b) Volcano plot on metabolites that were significantly different in EG_CK. The red color indicates metabolites with high concentrations. The blue color is metabolites with low concentrations. The grey color indicates no change in different metabolites. (c) Pattern heat map between samples. The color legend, which ranges from blue to red, reflects the abundance of metabolites, ranging from low to a high concentration.
Figure 4
Figure 4
The fold change (FC) arrangement and pattern of the main differential metabolites in EG_CK in Yu-711 leaves. (a) The proportion of differential metabolites in EG_CK. (b) Volcano plot on metabolites that were significantly different in EG_CK. The red color indicates metabolites with high concentrations. The blue color is metabolites with low concentrations. The grey color indicates no change in different metabolites. (c) Pattern heat map between samples. The color legend, which ranges from blue to red, reflects the abundance of metabolites, ranging from low to a high concentration.
Figure 5
Figure 5
Classification of the differentially expressed metabolites and their variable importance in the projection (VIP) distribution in EG_CK in mulberry Yu-711 leaves. (a) VIP distribution in each metabolite superclass as a scatter plot. The average mean of the differentially expressed metabolites is 2.213, and the red dashed line is the individual means. (b) A pie chart depicting the proportion of each metabolite in the superclass. Lipids and lipid-like molecules represent 47.7%, followed by unclassified at 19.2%, phenylpropanoid and polyketides at 8.1%, and organic oxygen compounds at 10.2%.
Figure 6
Figure 6
Heat map of the top 50 differentially expressed metabolites in EG CK in mulberry Yu-711 leaves based on hierarchical clustering analysis. (a) Differentially expressed metabolites separated by hierarchical clustering. The x-axis depicts (1–8) biological replicates of each type of treatment sample, and the y-axis represents the differentially expressed metabolites separated by hierarchical clustering. From blue to red color indicates an increase in metabolites abundance from low to high concentration; (b) VIP values of each differentially expressed metabolite.
Figure 7
Figure 7
Bar graph of 20 differentially expressed metabolites in EG_CK in mulberry Yu-711 leaves. VIP values in a brown column and the green columns represent log2 (fold change, FC) values. The left half represents high concentrated metabolites, while those in the right half are low in concentration.
Figure 8
Figure 8
Correlation analysis and network of differentially expressed metabolites in EG_CK in the mulberry Yu-711 leaves. (a) Pearson’s coefficients of correlation of VIP values depicting the relation among metabolites between EG and CK. Positive correlation in red and blue is the negative correlation. Different sizes of circles indicated the correlation of Pearson’s coefficients. (b) Interactions between classes of the top 50 differentially expressed metabolites in a network. The threshold for Pearson’s correlation coefficient was set at 0.9. Positive and negative correlations between compounds are represented by red and blue lines, respectively.
Figure 8
Figure 8
Correlation analysis and network of differentially expressed metabolites in EG_CK in the mulberry Yu-711 leaves. (a) Pearson’s coefficients of correlation of VIP values depicting the relation among metabolites between EG and CK. Positive correlation in red and blue is the negative correlation. Different sizes of circles indicated the correlation of Pearson’s coefficients. (b) Interactions between classes of the top 50 differentially expressed metabolites in a network. The threshold for Pearson’s correlation coefficient was set at 0.9. Positive and negative correlations between compounds are represented by red and blue lines, respectively.
Figure 9
Figure 9
Pathway enrichment analysis of the differentially expressed metabolites of EG_CK in mulberry Yu-711. (a) Analysis of the top 20 metabolic pathways enriched by differential expressed metabolites using a heat map. The analysis focused on metabolic pathways visualization analysis obtained from KEGG (ttp://www.kegg.jp/ (accessed on 5 March 2021)). The color from green to red denotes that the p-value decreases sequentially. The size of the bubble represents the number of metabolites enriched in each pathway. (b) Bar graph showing that the p-value of the top 20 metabolites involved in the metabolic pathway is significant. The red dash line indicates the p-value = 0.01, and the blue dash line indicates the p-value = 0.05. The top of the bar above the blue line means the signal pathway represented by it is significant. (c) Heat map analysis of the top 20 metabolic pathways with a p-value less than 0.05 enriched by differentially expressed metabolites. From green to red indicates p-value decreases sequentially; the point size indicates the number of metabolites enriched in each pathway. (d) A bar graph showing the p-value of not more than 0.05 of significant metabolites involved in the pathway. The red and blue dash line means p-value = 0.01, and 0.05, respectively.
Figure 9
Figure 9
Pathway enrichment analysis of the differentially expressed metabolites of EG_CK in mulberry Yu-711. (a) Analysis of the top 20 metabolic pathways enriched by differential expressed metabolites using a heat map. The analysis focused on metabolic pathways visualization analysis obtained from KEGG (ttp://www.kegg.jp/ (accessed on 5 March 2021)). The color from green to red denotes that the p-value decreases sequentially. The size of the bubble represents the number of metabolites enriched in each pathway. (b) Bar graph showing that the p-value of the top 20 metabolites involved in the metabolic pathway is significant. The red dash line indicates the p-value = 0.01, and the blue dash line indicates the p-value = 0.05. The top of the bar above the blue line means the signal pathway represented by it is significant. (c) Heat map analysis of the top 20 metabolic pathways with a p-value less than 0.05 enriched by differentially expressed metabolites. From green to red indicates p-value decreases sequentially; the point size indicates the number of metabolites enriched in each pathway. (d) A bar graph showing the p-value of not more than 0.05 of significant metabolites involved in the pathway. The red and blue dash line means p-value = 0.01, and 0.05, respectively.

References

    1. Bailey-Serres J., Lee S.C., Brinton E. Waterproofing Crops: Effective Flooding Survival Strategies. Plant Physiol. 2012;160:1698–1709. doi: 10.1104/pp.112.208173. - DOI - PMC - PubMed
    1. Peng C., Ma Z., Lei X., Zhu Q., Chen H., Wang W., Liu S., Li W., Fang X., Zhou X. A drought-induced pervasive increase in tree mortality across Canada’s boreal forests. Nat. Clim. Chang. 2011;1:467–471. doi: 10.1038/nclimate1293. - DOI
    1. Guo X., Xin Z., Yang T., Ma X., Zhang Y., Wang Z., Ren Y., Lin T. Metabolomics Response for Drought Stress Tolerance in Chinese Wheat Genotypes (Triticum aestivum) Plants. 2020;9:520. doi: 10.3390/plants9040520. - DOI - PMC - PubMed
    1. Prasad P.V.V., Staggenborg S.A., Ristic Z. Bridging Among Disciplines by Synthesizing Soil and Plant Processes. Wiley; Hoboken, NJ, USA: 2015. Impacts of Drought and/or Heat Stress on Physiological, Developmental, Growth, and Yield Processes of Crop Plants; pp. 301–355.
    1. Cattivelli L., Rizza F., Badeck F.-W., Mazzucotelli E., Mastrangelo A.M., Francia E., Mare C., Tondelli A., Stanca A.M. Drought tolerance improvement in crop plants: An integrated view from breeding to genomics. Field Crop. Res. 2008;105:1–14. doi: 10.1016/j.fcr.2007.07.004. - DOI