

Hypouricemic Effects of Chrysanthemum indicum L. and Cornus officinalis on Hyperuricemia-Induced HepG2 Cells, Renal Cells, and Mice
- PMID: 34451714
- PMCID: PMC8398120
- DOI: 10.3390/plants10081668
Hypouricemic Effects of Chrysanthemum indicum L. and Cornus officinalis on Hyperuricemia-Induced HepG2 Cells, Renal Cells, and Mice
Abstract
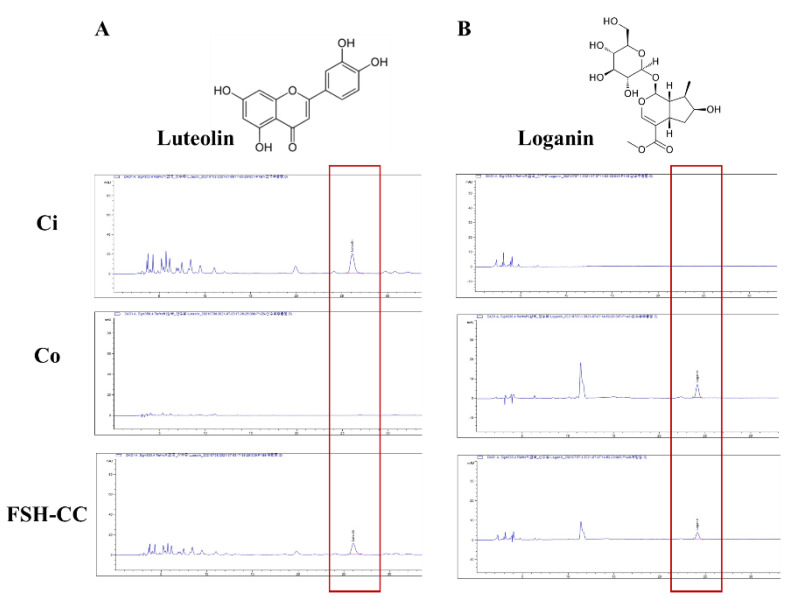
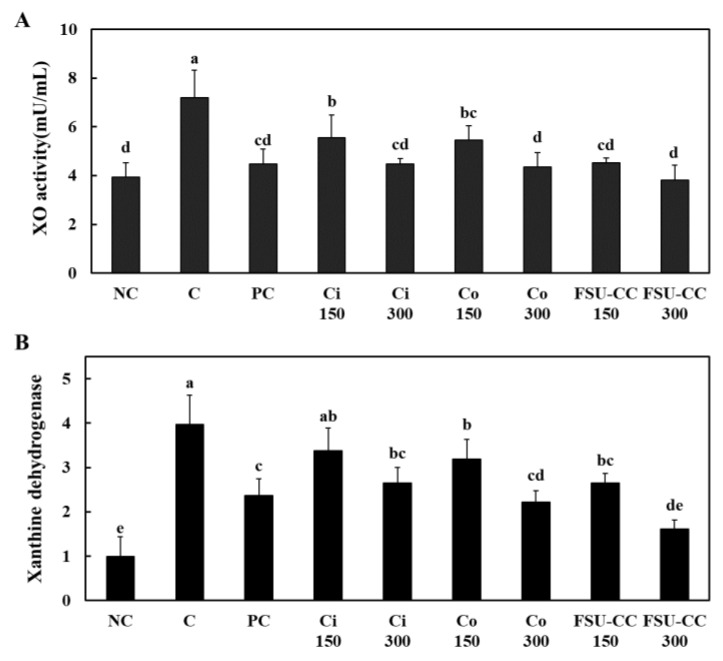
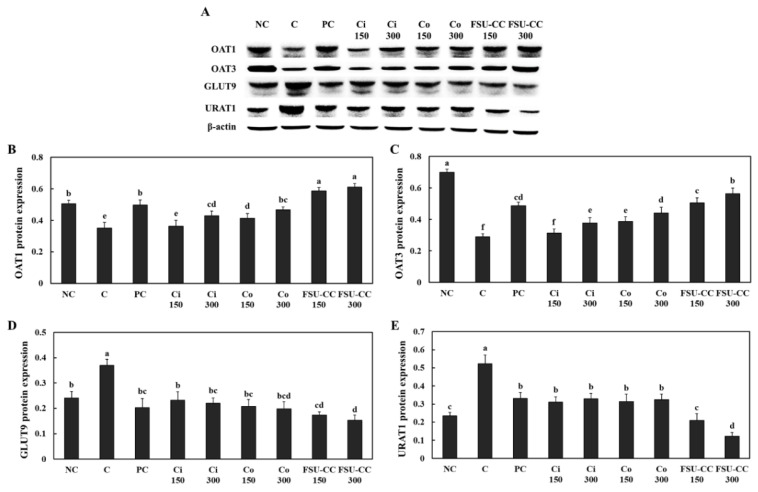
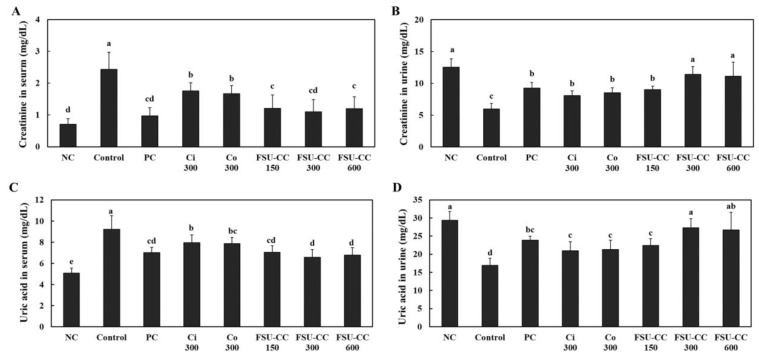
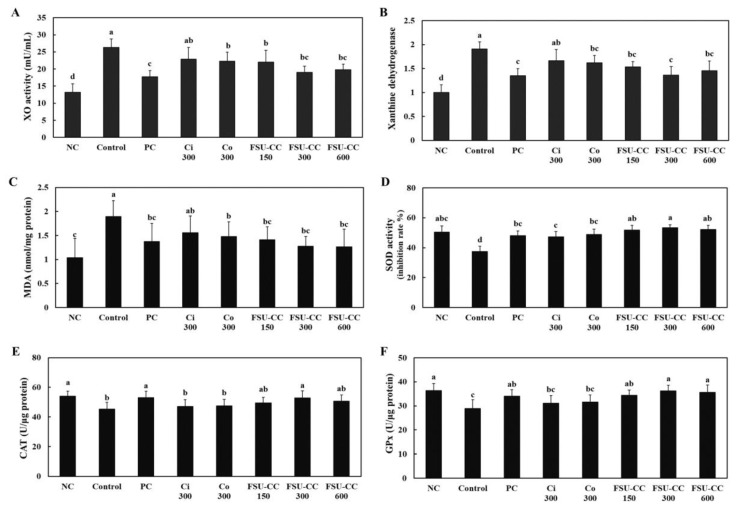
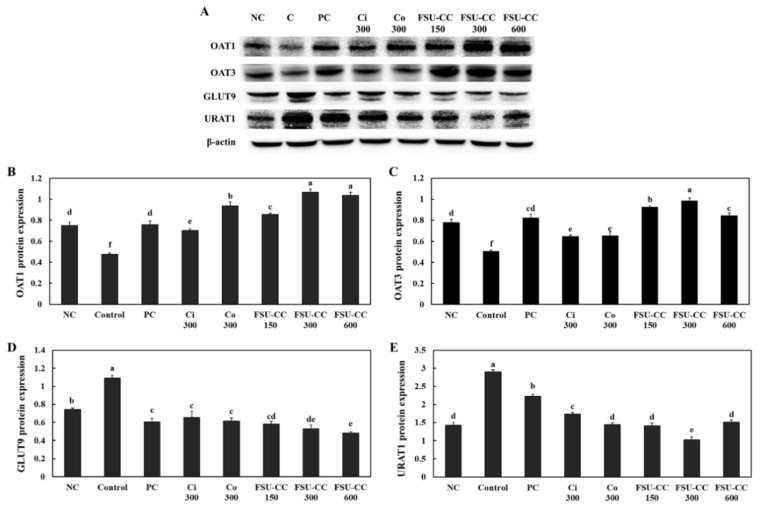
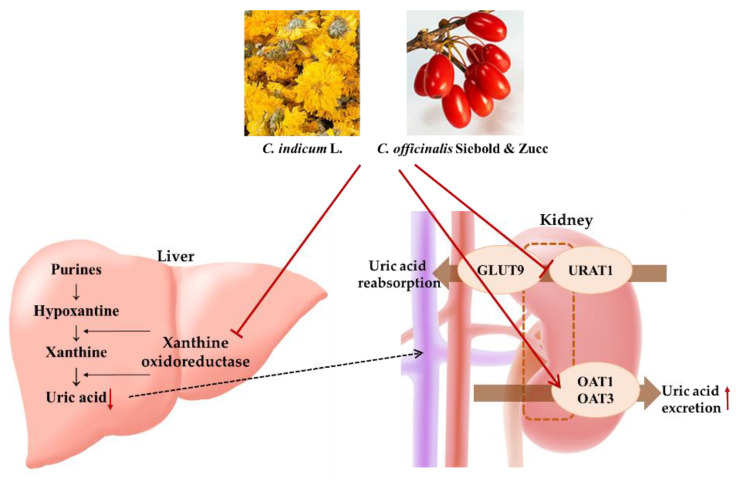
Hyperuricemia, abnormally excess accumulation of uric acid, is caused by an imbalance between the production and excretion of uric acid and is a major cause of gout. We compared the effects of extracts from Chrysanthemum indicum L. (Ci) and Cornus officinalis Siebold and Zucc. (Co) on hyperuricemia, both individually and in combination (FSU-CC), using hypoxanthine-treated human liver cancer (HepG2) cells, primary mouse renal proximal tubule cells, and potassium oxonate induced hyperuricemic mice. The Ci contained 7.62 mg/g luteolin and 0 mg/g loganin, Co contained 0 mg/g luteolin and 4.90 mg/g loganin, and FSH-CC contained 3.95 mg/g luteolin and 2.48 mg/g loganin. We found that treatment with Ci, Co, and FSU-CC suppressed the activity of xanthine oxidase and mRNA expression of xanthine dehydrogenase while inducing an increase in the expression levels of the organic anion transporter 1 (OAT1) and organic anion transporter 3 (OAT3) proteins and a decrease in the expression levels of glucose transporter 9 (GLUT9) and urate transporter 1 (URAT1) proteins. Particularly, treatment and supplementation with FSU-CC showed stronger effects than those of supplementation with either Ci or Co alone. We observed that the excretion of creatinine and uric acid in the combination of Ci and Co was higher than that observed in their individual supplementations and was similar to that of the normal group. Therefore, our data suggest that a combination of Ci and Co may potentially be used for the development of effective natural anti-hyperuricemic functional foods.
Keywords: Chrysanthemum indicum L.; Cornus officinalis Siebold and Zucc.; hyperuricemia; uric acid.
Conflict of interest statement
The authors declare no conflict of interest.
Figures
Similar articles
-
DKB114, A Mixture of Chrysanthemum Indicum Linne Flower and Cinnamomum Cassia (L.) J. Presl Bark Extracts, Improves Hyperuricemia through Inhibition of Xanthine Oxidase Activity and Increasing Urine Excretion.Nutrients. 2018 Sep 28;10(10):1381. doi: 10.3390/nu10101381. Nutrients. 2018. PMID: 30274153 Free PMC article.
-
Baicalein alleviates hyperuricemia by promoting uric acid excretion and inhibiting xanthine oxidase.Phytomedicine. 2021 Jan;80:153374. doi: 10.1016/j.phymed.2020.153374. Epub 2020 Oct 9. Phytomedicine. 2021. PMID: 33075645
-
Synergistic Uric Acid-Lowering Effects of the Combination of Chrysanthemum indicum Linne Flower and Cinnamomum cassia (L.) J. Persl Bark Extracts.Evid Based Complement Alternat Med. 2017;2017:9764843. doi: 10.1155/2017/9764843. Epub 2017 Jul 9. Evid Based Complement Alternat Med. 2017. PMID: 28769989 Free PMC article.
-
Recent advances on uric acid transporters.Oncotarget. 2017 Aug 10;8(59):100852-100862. doi: 10.18632/oncotarget.20135. eCollection 2017 Nov 21. Oncotarget. 2017. PMID: 29246027 Free PMC article. Review.
-
Urate Transporters in the Kidney: What Clinicians Need to Know.Electrolyte Blood Press. 2021 Jun;19(1):1-9. doi: 10.5049/EBP.2021.19.1.1. Epub 2021 Jun 30. Electrolyte Blood Press. 2021. PMID: 34290818 Free PMC article. Review.
Cited by
-
Natural Resources of Medicinal and Cosmetic Plants.Plants (Basel). 2022 May 5;11(9):1251. doi: 10.3390/plants11091251. Plants (Basel). 2022. PMID: 35567252 Free PMC article.
-
Modulation of IRAK4 as a Therapeutic Strategy Against Monosodium Urate- and Xanthine-Induced Inflammation in Macrophages and HepG2 Cells.Res Sq [Preprint]. 2025 Jul 16:rs.3.rs-6908346. doi: 10.21203/rs.3.rs-6908346/v1. Res Sq. 2025. PMID: 40709261 Free PMC article. Preprint.
-
Chrysanthemum indicum L. ameliorates muscle atrophy by improving glucose tolerance in CT26-induced cancer cachexia.Front Pharmacol. 2024 Nov 18;15:1455805. doi: 10.3389/fphar.2024.1455805. eCollection 2024. Front Pharmacol. 2024. PMID: 39624846 Free PMC article.
-
Therapeutic potential and pharmacological mechanisms of Traditional Chinese Medicine in gout treatment.Acta Pharmacol Sin. 2025 May;46(5):1156-1176. doi: 10.1038/s41401-024-01459-6. Epub 2025 Jan 17. Acta Pharmacol Sin. 2025. PMID: 39825190 Review.
-
Luteolin ameliorates hyperuricemic nephropathy by activating urate excretion and Nrf2/HO-1/NQO1 antioxidant pathways in mice.Food Sci Nutr. 2024 Aug 20;12(10):8053-8066. doi: 10.1002/fsn3.4403. eCollection 2024 Oct. Food Sci Nutr. 2024. PMID: 39479625 Free PMC article.
References
LinkOut - more resources
Full Text Sources
