. 2021 Jul 27;14(8):727.
doi: 10.3390/ph14080727.

Pitavastatin Is a Highly Potent Inhibitor of T-Cell Proliferation

Affiliations

Pitavastatin Is a Highly Potent Inhibitor of T-Cell Proliferation

Linda Voss et al. Pharmaceuticals (Basel). .

Abstract

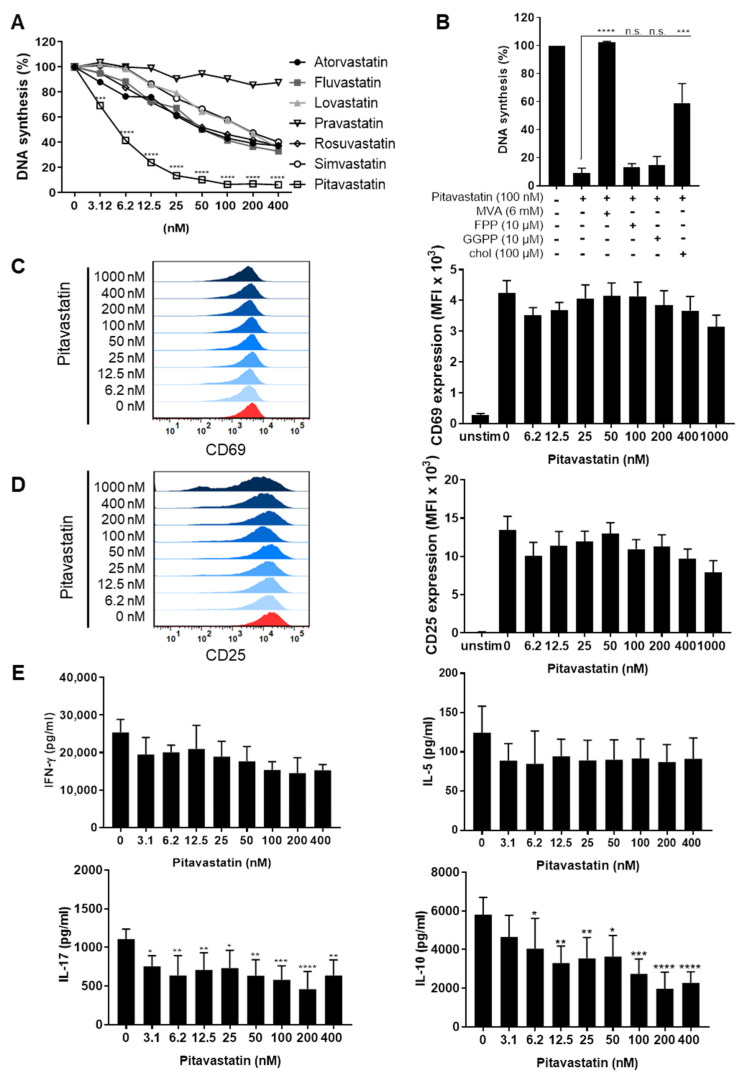
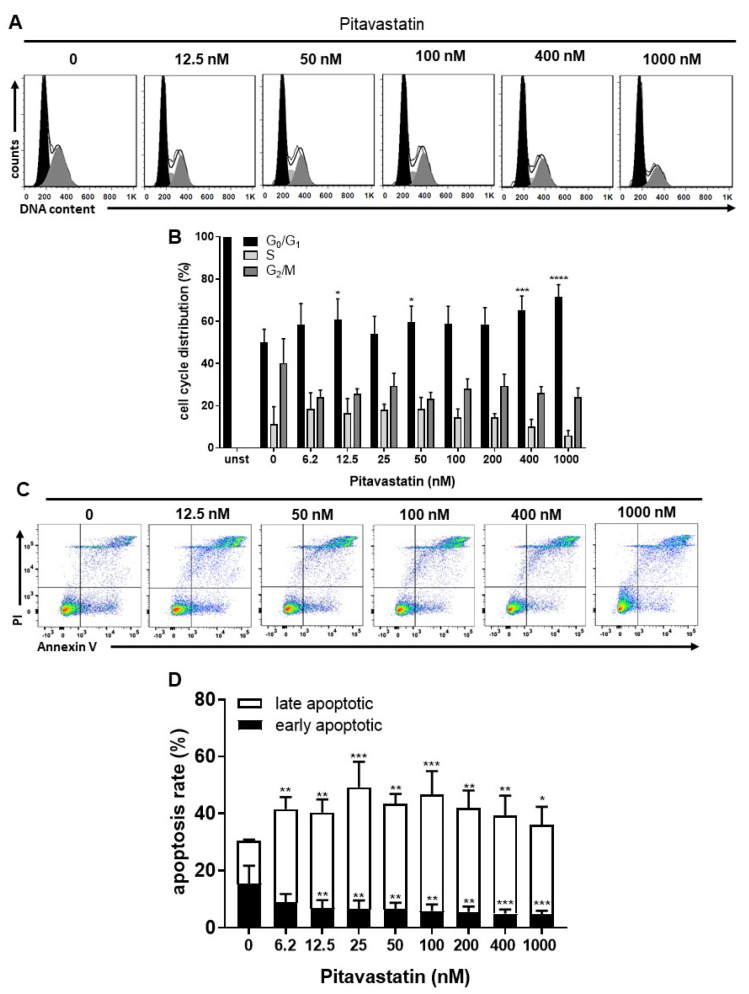
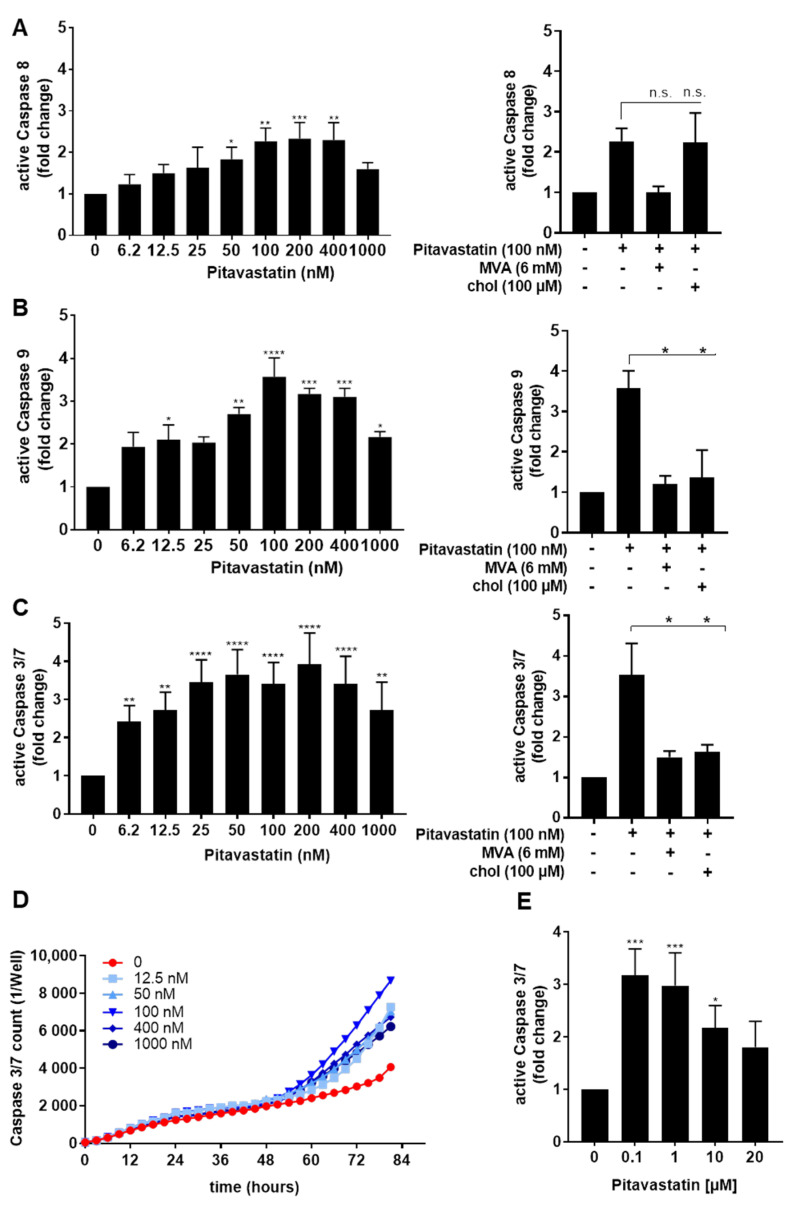
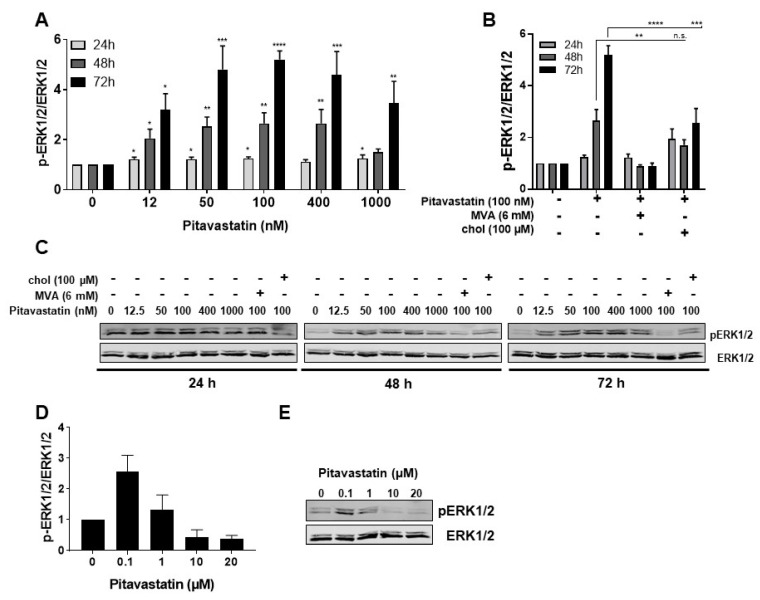
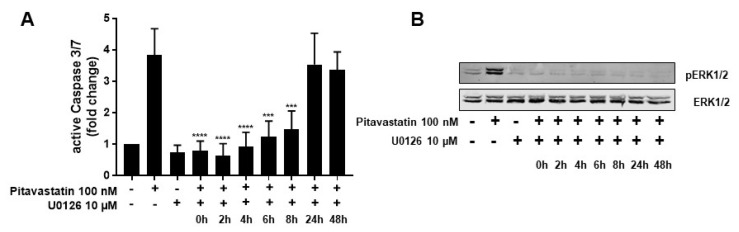
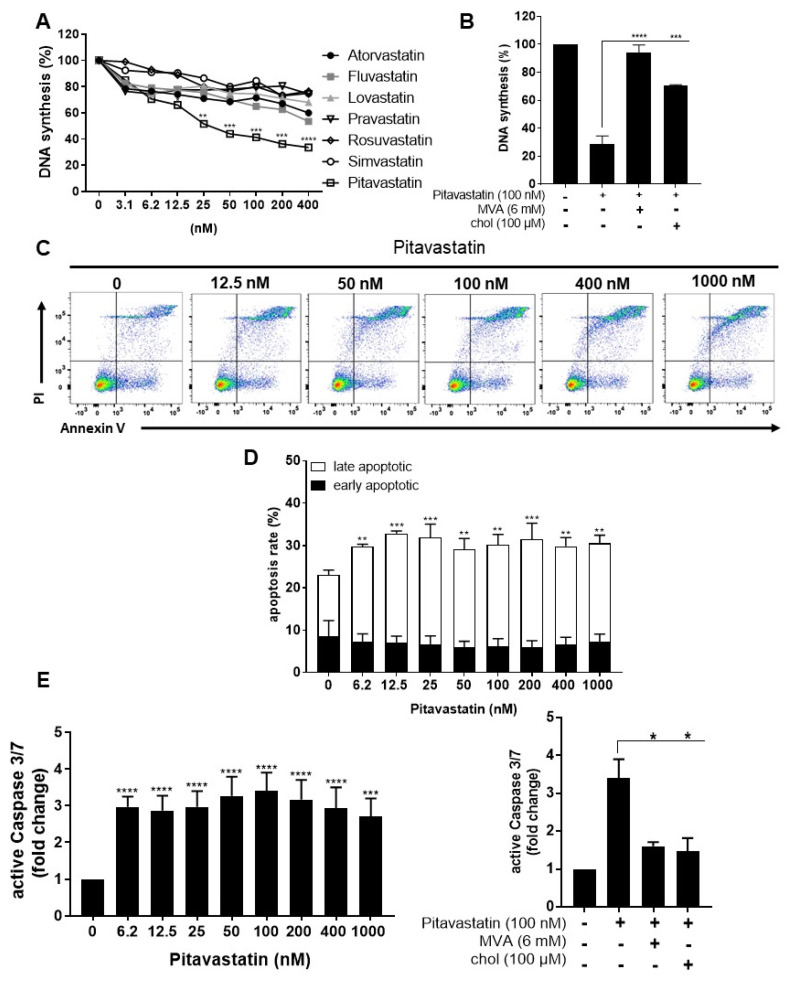
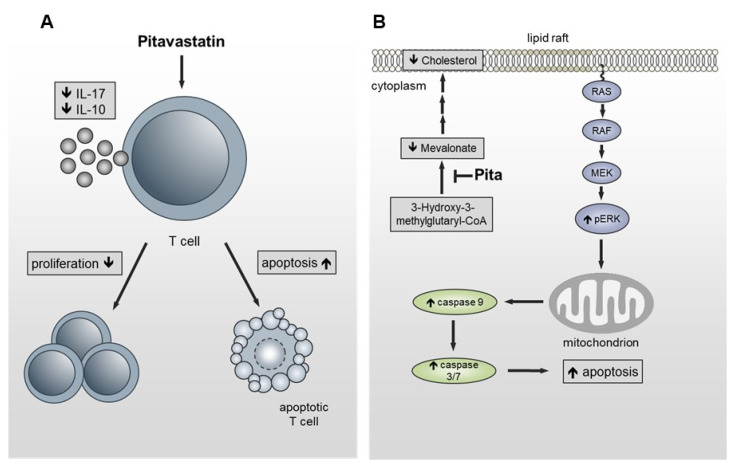
Repositioning of approved drugs is an alternative time- and cost-saving strategy to classical drug development. Statins are 3-hydroxy-3-methylglutaryl-CoA (HMG CoA) reductase inhibitors that are usually used as cholesterol-lowering medication, and they also exhibit anti-inflammatory effects. In the present study, we observed that the addition of Pitavastatin at nanomolar concentrations inhibits the proliferation of CD3/CD28 antibody-stimulated human T cells of healthy donors in a dose-dependent fashion. The 50% inhibition of proliferation (IC50) were 3.6 and 48.5 nM for freshly stimulated and pre-activated T cells, respectively. In addition, Pitavastatin suppressed the IL-10 and IL-17 production of stimulated T cells. Mechanistically, we found that treatment of T cells with doses <1 µM of Pitavastatin induced hyperphosphorylation of ERK1/2, and activation of caspase-9, -3 and -7, thus leading to apoptosis. Mevalonic acid, cholesterol and the MEK1/2 inhibitor U0126 reversed this Pitavastatin-mediated ERK1/2 activation and apoptosis of T cells. In summary, our results suggest that Pitavastatin is a highly potent inhibitor of T-cell proliferation, which induces apoptosis via pro-apoptotic ERK1/2 activation, thus representing a potential repositioning candidate for the treatment of T-cell-mediated autoimmune diseases.

Keywords: ERK1/2 activation; Pitavastatin; apoptosis; drug repositioning; inhibitor of T-cell proliferation.


Conflict of interest statement

The authors declare no conflict of interest.

Figures

Figure 1
Figure 1
Pitavastatin inhibited proliferation, as well as IL-10 and IL-17 production of stimulated T cells, but had no influence on T-cell activation. Human resting T cells freshly stimulated with anti-CD3/CD28 antibodies were cultured with increasing concentrations of different statins (A) or 100 nM Pitavastatin in the presence or absence of either 6 mM MVA, 10 µM FPP, 10 µM GGPP or 100 µM cholesterol (chol) (B) for 72 h. DNA synthesis was determined by standard [3H]-thymidine uptake. [3H]-TdR incorporation is shown as mean percentage ± SEM of DNA synthesis in relation to control cultures (vehicle) set to 100%. (CE) Human T cells were freshly stimulated with anti-CD3/CD28 antibodies and incubated with increasing concentrations of Pitavastatin. Expression levels of the T-cell activation markers CD69 after 16 h (C) and CD25 after 48 h (D) were analyzed by flow cytometry. Representative histograms (left) and mean fluorescence intensity (MFI, right) are displayed. Cell-culture supernatants were harvested 72 h after treatment, and concentrations of IFN-γ, IL-5, IL-17 and IL-10 were determined with specific ELISA (E). Data are presented as the mean ± SEM of n = 4 independent experiments. Statistical analysis was performed with One-Way ANOVA and Dunnett’s Multiple Comparison Analysis Test as post hoc test. (**** p ≤ 0.0001, *** p  ≤  0.001, ** p  ≤  0.01, * p  ≤  0.05).
Figure 2
Figure 2
Pitavastatin blocked cell-cycle progression and induced cell death in freshly stimulated T cells. Human T cells were freshly stimulated with anti-CD3/CD28 antibodies and cultured with increasing concentrations of Pitavastatin for 72 h. DNA content and cell-cycle phase of cells were determined by using propidium iodide staining and flow cytometric analysis. Representative histograms of DNA content are shown in (A) (G0/G1 (black), S (light gray) and G2/M (dark gray)). (B) The bars indicate the percentage of cells in G0/G1 phase, S phase and G2/M phase. Data are presented as the mean + SEM of n = 4 independent experiments. Cells were stained after 72 h with Annexin V-FITC/PI for flow cytometric analysis. (C) Representative flow cytometry dot plots and (D) quantification of early and late apoptotic cells of n = 4 independent experiments are shown. Statistical analysis was performed with One-Way ANOVA and Dunnett’s Multiple Comparison Analysis Test as post hoc test. (**** p ≤ 0.0001, *** p  ≤  0.001, ** p  ≤  0.01, * p  ≤  0.05).
Figure 3
Figure 3
Pitavastatin activated caspases in freshly stimulated T cells. Resting human T cells were freshly stimulated with anti-CD3/CD28 antibodies and cultured with increasing concentrations of Pitavastatin or 100 nM Pitavastatin in the presence or absence of 6 mM MVA or 100 µM cholesterol (chol). Cells were stained after 72 h with active caspase-8-binding FITC-IETD-FMK (A), active caspase 9-binding FITC-LEHD-FMK reagent (B) or CellEvent™ Caspase-3/7 Green detection reagent (C) for flow cytometric analysis. Mean + SEM of relative caspase expression of n = 3 independent experiments are displayed. (D) For kinetic analyses, human T cells were stimulated with anti-CD3/CD28 antibodies and cultured with increasing concentrations of Pitavastatin in the presence of Caspase-3/7 Green detection reagent. Kinetic measures of the number of caspase-3/7 positive cells were recorded by the IncuCyte S3 imaging system at 3 h intervals for 84 h. (E) Resting human T cells were freshly stimulated with anti-CD3/CD28 antibodies and cultured with high concentrations of Pitavastatin. Cells were stained after 72 h with CellEvent™ Caspase-3/7 Green detection reagent. Results of n = 3 independent experiments are presented as mean values of relative caspase expression. Statistical analysis was performed with One-Way ANOVA and Dunnett’s Multiple Comparison Analysis Test as post hoc test. (**** p ≤ 0.0001, *** p  ≤  0.001, ** p  ≤  0.01, * p  ≤  0.05).
Figure 4
Figure 4
Pitavastatin enhanced ERK phosphorylation in freshly stimulated T cells. Resting human T cells were freshly stimulated with anti-CD3/CD28 antibodies and cultured with increasing concentrations of Pitavastatin (A) or 100 nM Pitavastatin in the presence or absence of either 6 mM MVA or 100 µM cholesterol (chol). (B) After 24 h, 48 h or 72 h incubation, cells were lysed and analyzed by Western blot. (A,B) Relative expression of p-ERK1/2 based on densitometric quantification. Quantitative data are presented as mean + SEM from n = 4 independent experiments. (C) Representative Western blot images of p-ERK1/2 and total ERK1/2. (D,E) Resting human T cells were freshly stimulated with anti-CD3/CD28 antibodies and cultured with high concentrations of Pitavastatin. After 48 h of incubation, cells were lysed and analyzed by Western blot. (D) Relative expression of p-ERK1/2 based on densitometric quantification. Quantitative data are presented as the mean + SEM from n = 3 independent experiments. (E) Representative Western blot images of p-ERK1/2 and total ERK1/2. Statistical analysis was performed with One-Way ANOVA and Dunnett’s Multiple Comparison Analysis Test as post hoc test. (**** p ≤ 0.0001, *** p  ≤  0.001, ** p  ≤  0.01, * p  ≤  0.05).
Figure 5
Figure 5
ERK hyperphosphorylation is responsible for Pitavastatin-induced apoptosis. Resting human T cells were freshly stimulated with anti-CD3/CD28 antibodies and cultured with 100 nM Pitavastatin in the presence or absence of 10 µM of the MEK1/2 inhibitor U0126. (A) Cells were stained after 72 h with CellEvent™ Caspase-3/7 Green detection reagent. Mean + SEM of relative caspase expression of n = 3 independent experiments are displayed. (B) Representative Western blot images of p-ERK1/2 and total ERK1/2. Statistical analysis was performed with One-Way ANOVA and Dunnett’s Multiple Comparison Analysis Test as post hoc test. (**** p ≤ 0.0001, *** p  ≤  0.001).
Figure 6
Figure 6
Pitavastatin suppressed proliferation and induced apoptosis in pre-activated T cells. Resting human T cells were pre-activated for 48 h with anti-CD3/CD28 antibodies and cultured with increasing concentrations of different statins (A) or 100 nM Pitavastatin in the presence or absence of 6 mM MVA or 100 µM cholesterol (chol) (B) for 72 h. DNA synthesis was determined by standard [3H]-thymidine uptake. [3H]-TdR incorporation is shown as mean percentage of DNA synthesis in relation to control cultures (vehicle) set to 100%. Cells were stained after 72 h with Annexin V-FITC/PI for flow cytometric analysis. (C) Representative flow cytometry dot plots and (D) quantification of early and late apoptotic cells of n = 3 independent experiments are shown. (E) Resting human T cells were pre-activated for 48 h with anti-CD3/CD28 antibodies and cultured with increasing concentrations of Pitavastatin (left) or 100 nM Pitavastatin in the presence or absence of 6 mM MVA or 100 µM cholesterol (chol) (right). Cells were stained after 72 h with CellEvent™ Caspase-3/7 Green detection reagent. Relative caspase expression of n = 3 independent experiments is presented as mean + SEM. Statistical analysis was performed with One-Way ANOVA and Dunnett’s Multiple Comparison Analysis Test as post hoc test. (**** p ≤ 0.0001, *** p  ≤  0.001, ** p  ≤  0.01, * p  ≤  0.05).
Figure 7
Figure 7
Schematic presentation of the functional effects of Pitavastatin on T cells. (A) Pitavastatin inhibits proliferation in freshly stimulated and pre-activated T cells. Inhibition of proliferation was associated with reduced IL-17 and IL-10 secretion and apoptosis induction. (B) By inhibiting HMG-CoA reductase, the cholesterol concentration in the lipid rafts is reduced, leading to hyperphosphorylation of ERK1/2. Sustained activation of ERK1/2 induces the activation of caspase-9 and caspase-3/7, leading to cell death.

Similar articles

Cited by

References

    1. Van Norman G.A. Drugs, Devices, and the FDA: Part 1: An Overview of Approval Processes for Drugs. JACC Basic Transl. Sci. 2016;1:170–179. doi: 10.1016/j.jacbts.2016.03.002. - DOI - PMC - PubMed
    1. Collier R. Rapidly rising clinical trial costs worry researchers. CMAJ. 2009;180:277–278. doi: 10.1503/cmaj.082041. - DOI - PMC - PubMed
    1. Sertkaya A., Wong H.H., Jessup A., Beleche T. Key cost drivers of pharmaceutical clinical trials in the United States. Clin. Trials. 2016;13:117–126. doi: 10.1177/1740774515625964. - DOI - PubMed
    1. Arrowsmith J. Trial watch: Phase III and submission failures: 2007–2010. Nat. Rev. Drug Discov. 2011;10:87. doi: 10.1038/nrd3375. - DOI - PubMed
    1. Pushpakom S., Iorio F., Eyers P.A., Escott K.J., Hopper S., Wells A., Doig A., Guilliams T., Latimer J., McNamee C., et al. Drug repurposing: Progress, challenges and recommendations. Nat. Rev. Drug Discov. 2018;18:41–58. doi: 10.1038/nrd.2018.168. - DOI - PubMed

LinkOut - more resources