. 2021 Aug 17;14(8):809.
doi: 10.3390/ph14080809.

A High-Content Screen for the Identification of Plant Extracts with Insulin Secretion-Modulating Activity

Affiliations

A High-Content Screen for the Identification of Plant Extracts with Insulin Secretion-Modulating Activity

Roland Hager et al. Pharmaceuticals (Basel). .

Abstract

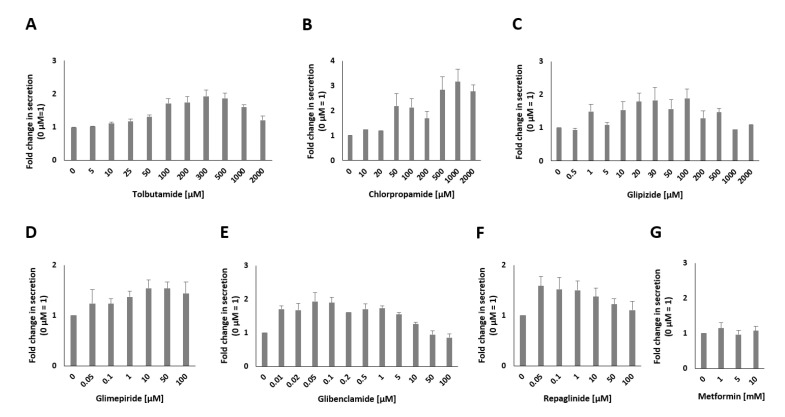
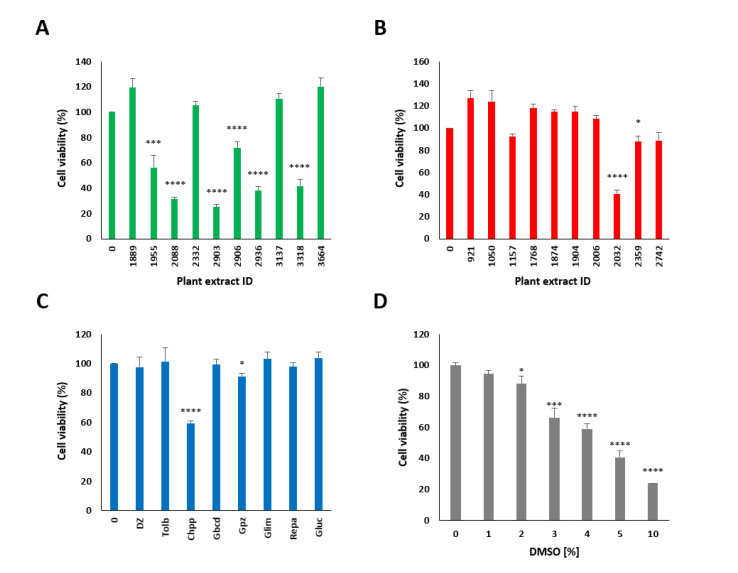
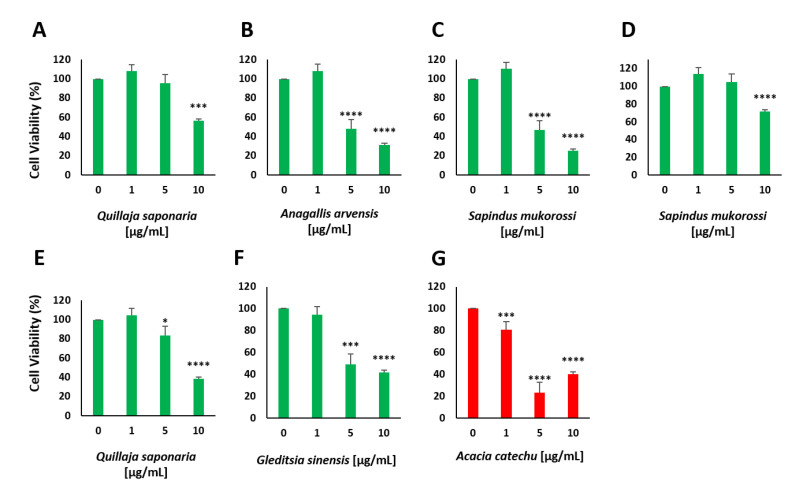
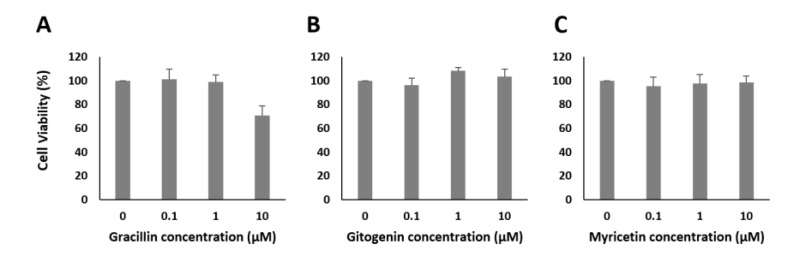
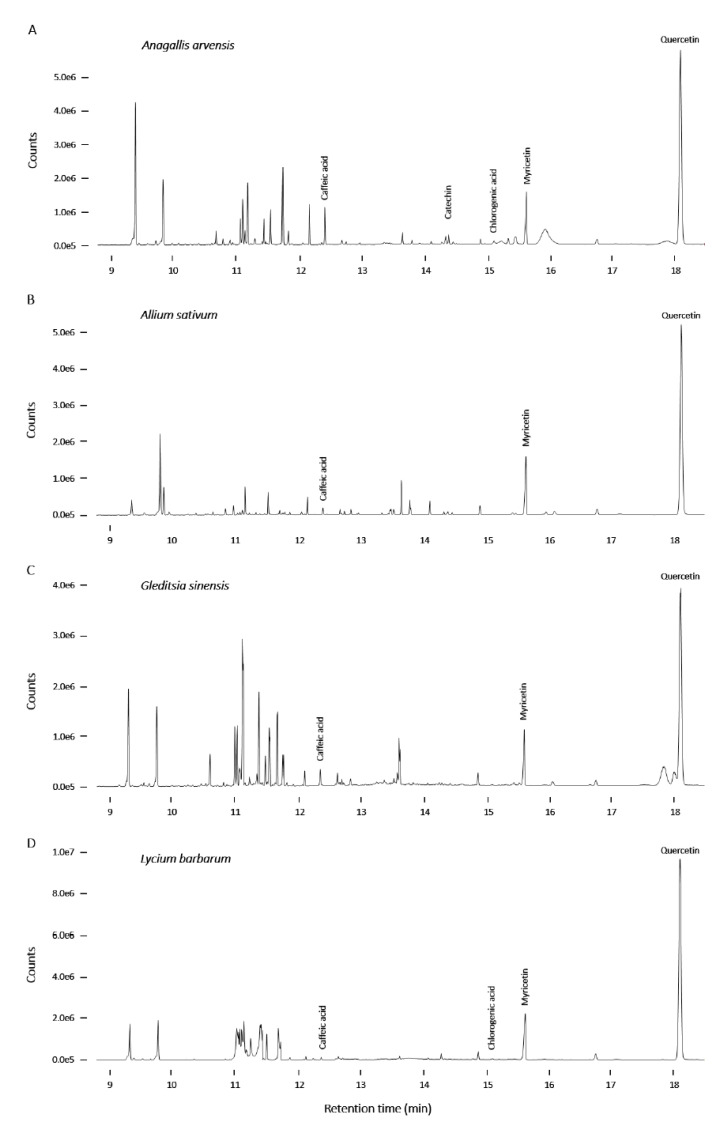
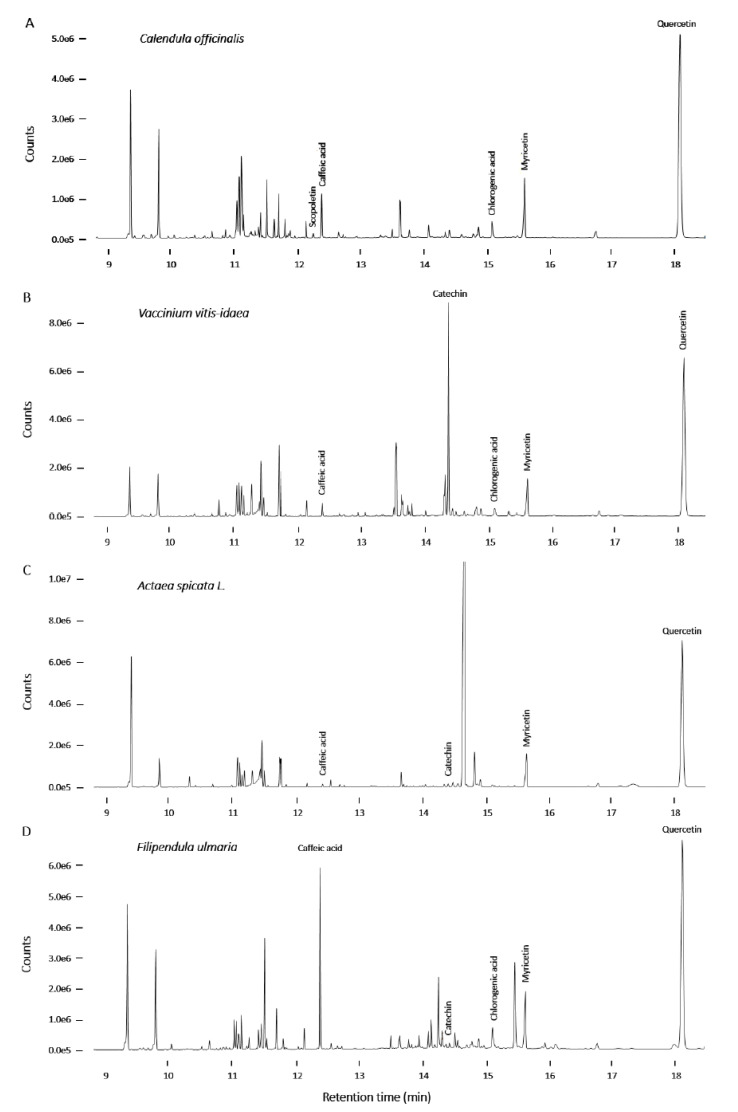
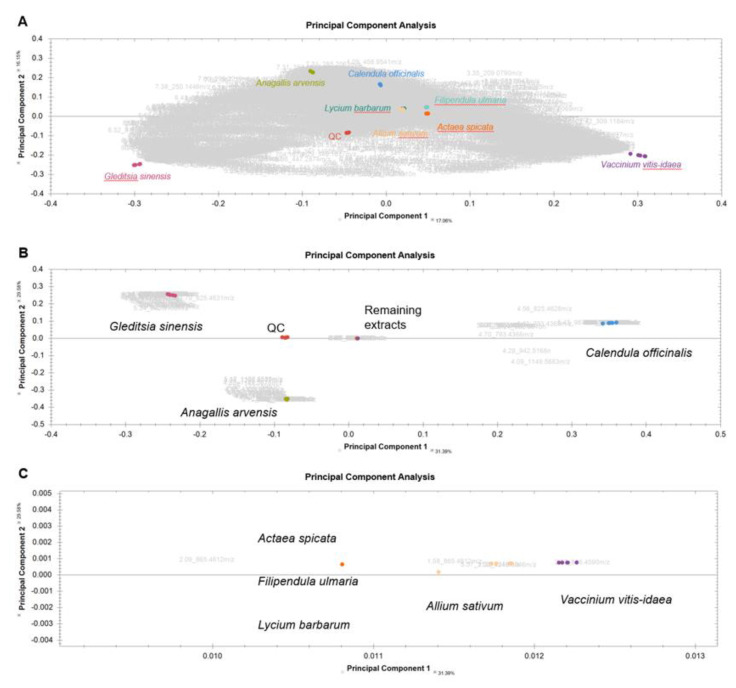
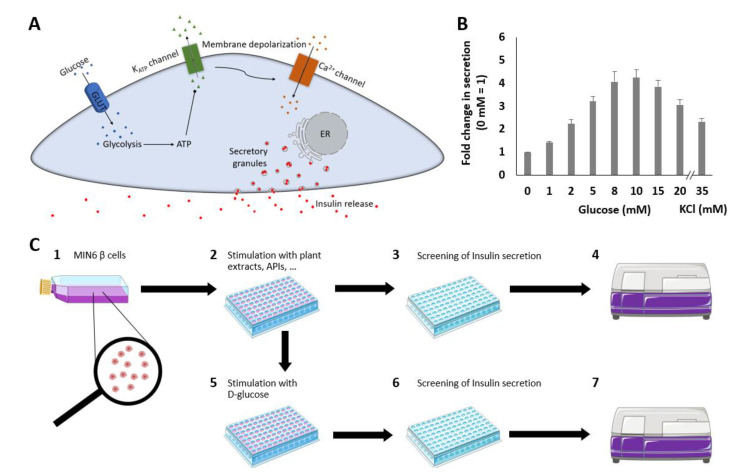
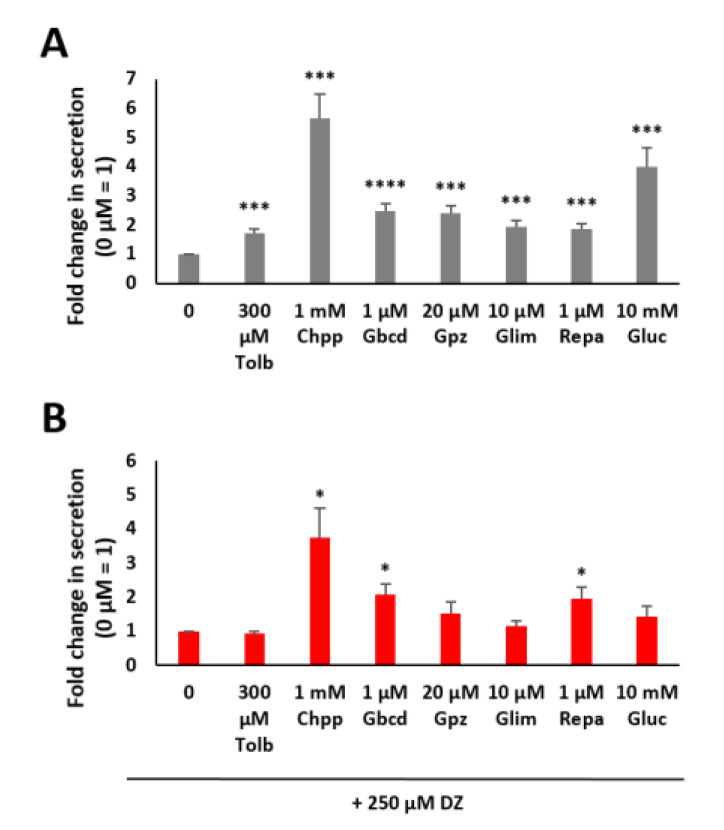
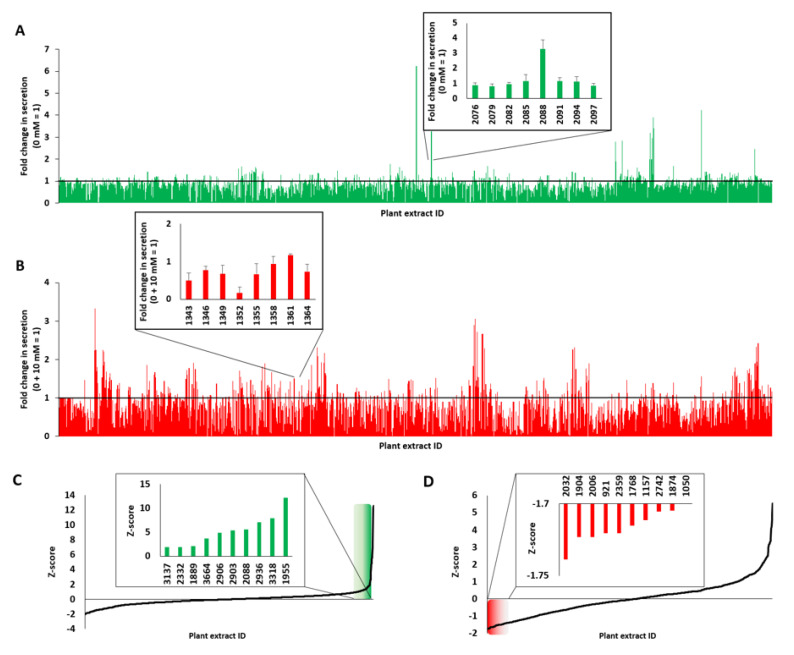
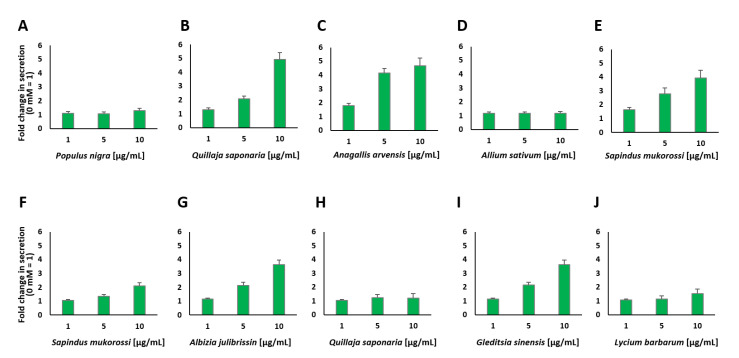
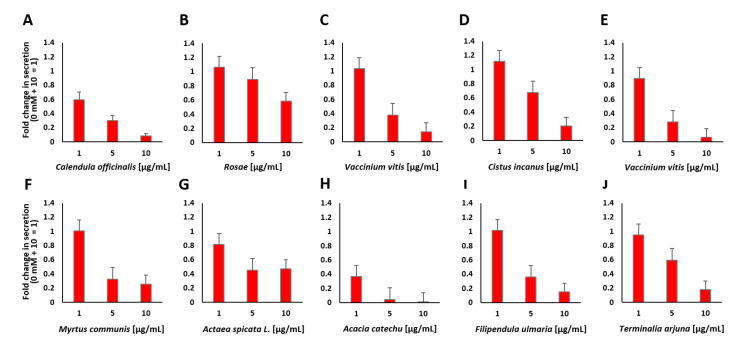
Bioactive plant compounds and extracts are of special interest for the development of pharmaceuticals. Here, we describe the screening of more than 1100 aqueous plant extracts and synthetic reference compounds for their ability to stimulate or inhibit insulin secretion. To quantify insulin secretion in living MIN6 β cells, an insulin-Gaussia luciferase (Ins-GLuc) biosensor was used. Positive hits included extracts from Quillaja saponaria, Anagallis arvensis, Sapindus mukorossi, Gleditsia sinensis and Albizia julibrissin, which were identified as insulin secretion stimulators, whereas extracts of Acacia catechu, Myrtus communis, Actaea spicata L., Vaccinium vitis-idaea and Calendula officinalis were found to exhibit insulin secretion inhibitory properties. Gas chromatography-mass spectrometry (GC-MS) and liquid chromatography-mass spectrometry (LC-MS) were used to characterize several bioactive compounds in the selected plant extracts, and these bioactives were retested for their insulin-modulating properties. Overall, we identified several plant extracts and some of their bioactive compounds that may be used to manipulate pancreatic insulin secretion.

Keywords: GC-MS; LC-MS; Western blotting; bioactives; diabetes; insulin; luciferase; natural compounds; natural plant extracts; screening; β cells.


Conflict of interest statement

The authors declare no conflict of interest. The funders had no role in the design of the study; in the collection, analysis, or interpretation of data; in the writing of the manuscript; or in the decision to publish the results.

Figures

Figure A1
Figure A1
Fold change in the amount of insulin secreted expressed as luciferase activity in MIN6 β cells after incubation with different concentrations of tolbutamide (A), chlorpropamide (B), glipizide (C), glimepiride (D), glibenclamide (E), repaglinide (F) and metformin (G).
Figure A2
Figure A2
Cell viability of MIN6 pancreatic β cells determined by the resazurin assay tested at a concentration of 10 µg/mL. Stimulating plant extracts: 1889: Populus nigra, 1955: Quillaja saponaria, 2088: Anagallis arvensis, 2332: Allium sativum, 2903: Sapindus mukorossi, 2906: Sapindus mukorossi, 3137: Albizia julibrissin, 2936: Quillaja saponaria, 3318: Gleditsia sinensis and 3664: Lycium barbarum, (A). Suppressing plant extracts: 921: Calendula officinalis, 1050: Rosae, 1157: Vaccinium vitis-idaea, 1768: Cistus incanus, 1874: Vaccinium vitis-idaea, 1904: Myrtus communis, 2006: Actaea spicata L., 2332: Acacia catechu, 2359: Filipendula ulmaria and 2742: Terminalia arjuna (B). Active pharmaceutical ingredients: 250 µM DZ, 300 µM tolbutamide, 1 mM chlorpropamide, 1 µM glibenclamide, 20 µM glipizide, 10 µM glimepiride and 1 µM repaglinide (C). DMSO (D). Data are normalized to untreated cells (0 mM glucose or 0% DMSO = 100% viability) and presented as the mean ± SEM. n ≥ 8; **** p < 0.0001, *** p < 0.001, and * p < 0.05 indicate a significant difference compared to the untreated cells.
Figure A3
Figure A3
Cell viability of MIN6 pancreatic β cells after treatment with different concentrations of different extracts as determined by the resazurin assay. Quillaja saponaria (A), Anagallis arvensis (B), Sapindus mukorossi (C), Sapindus mukorossi (D), Quillaja saponaria (E), Gleditsia sinensis (F) and Acacia catechu (G). * p < 0.05; *** p < 0.001; **** p < 0.0001.
Figure A4
Figure A4
Cell viability of MIN6 pancreatic beta cells dependent on different concentrations of selected bioactive compounds: (A) Gracillin, (B) Gitogenin and (C) Myricetin.
Figure A5
Figure A5
GC-MS chromatograms of Anagallis arvensis (A), Allium sativum (B), Gleditsia sinensis (C) and Lycium barbarum (D).
Figure A6
Figure A6
GC-MS chromatograms of Calendula officinalis (A), Vaccinium vitis-idaea (B), Actaea spicata L. (C) and Filipendula ulmaria (D).
Figure A7
Figure A7
Principal components analysis (PCA) biplot showing scores (colored dots) and loadings (compound IDs in grey with retention time and m/z values) of UPLC-ESI-IMS-TOF MS runs of selected plant extracts. Different colors refer to different plant species. The QC scores are depicted in red. (A) PCA of all compounds (no filters), (B) PCA with only possible identifications and (C) zoomed-in area.
Figure 1
Figure 1
Schematic overview of the GSIS pathway from pancreatic β cells that produce and secrete insulin in response to changes in ambient blood glucose concentrations. Glucose enters the cell via the glucose transporter GLUT2 and is metabolized to pyruvate and ATP. The generated ATP binds to and closes ATP-dependent potassium channels (KATP channels). Due to channel closure, potassium exit is blocked, resulting in depolarization of the cell membrane. Voltage-gated calcium channels are thus triggered, and an influx of calcium occurs. The elevated cytoplasmic calcium concentration triggers the release of insulin and C-peptide in equimolar amounts (A). Insulin secretion depending on different glucose concentrations in MIN6 β cells and in response to 35 mM KCl. Fold changes in the secreted luciferase activity expressing Ins-GLuc normalized to the activity of 0 mM glucose and expressed as fold change ± SEM. Data are the average of at least three independent experiments with a minimum of 17 replicates in total (B). Schematic overview of the insulin secretion stimulation and suppression assay (C). MIN6 β cells were cultured in flasks or dishes, trypsinized, counted and diluted in cell culture media (1). Cells (200 µL) were aliquoted into wells of a 96-well plate and cultured before washing and starving in KRPH buffer and incubation with plant extracts (2). Fifty microliters of supernatant were removed, pipetted into a white 96-well plate and mixed with working solution (3). Luminescence was measured immediately after pipetting (4). To test the suppression of insulin secretion of the plant extracts, 10 mM glucose was added (5) after incubation with different plant extracts (2). Assay preparation and measurements (6, 7) were performed as described previously (3, 4).
Figure 2
Figure 2
Fold change in insulin secretion as measured by luciferase activity in MIN6 β cells after incubation with tolbutamide (Tolb), chlorpropamide (Chpp), glibenclamide (Gbcd), glipizide (Gpz), glimepiride (Glim), repaglinide (Repa) and glucose (Gluc) (A) and incubation after preincubation with 250 µM diazoxide (DZ) (B). Fold change in insulin secretion as measured by luciferase activity in MIN6 β cells expressing Ins-GLuc normalized to the activity of 0 mM glucose and expressed as the means ± SEM (n ≥ 8). * p < 0.05; *** p < 0.001; **** p < 0.0001.
Figure 3
Figure 3
Ins-Gluc-expressing MIN6 β cells were treated with more than 1100 plant extracts (A), green illustrated data or preincubated with these extracts and diazoxide (DZ) for 1 h and stimulated with 10 mM glucose (B), red illustrated data. The Z-score was calculated from normalized values, and the data were sorted and are illustrated in (C) for incubation with plant extracts and (D) for incubation with plant extracts in combination with 10 mM glucose. Plant extracts were screened at a final concentration of 10 µg/mL (n = 4).
Figure 4
Figure 4
Insulin secretion from MIN6 β cells in response to stimulation with various concentrations of the indicated plant extracts (AJ). Fold change in the amount of secreted insulin expressed as luciferase activity from Ins-GLuc normalized to the activity of 0 mM glucose and expressed as fold change ± SEM (n ≥ 8).
Figure 5
Figure 5
Insulin secretion from MIN6 β cells in response to stimulation with 10 mM glucose after preincubation with various concentrations of the indicated plant extracts (AJ). Fold change in the amount of secreted insulin expressed as luciferase activity from Ins-GLuc normalized to the activity of 0 mM + 10 mM glucose expressed as fold change ± SEM (n ≥ 11).
Figure 6
Figure 6
Insulin secretion in response to stimulation with various concentrations of identified bioactives (AJ) and insulin secretion in response to stimulation with 10 mM glucose after preincubation with various concentrations of bioactives to test for insulin secretion inhibiting properties (KT).
Figure 7
Figure 7
Manipulation of p44/42 phosphorylation. Western blotting (A) and quantitative analysis of each band (B) of whole-cell extracts from MIN6 β cells after treatment with the indicated substances for 1 h: Blank (0), 250 µM diazoxide (DZ), 10 mM glucose (Gluc), Filipendula ulmaria (2359, 10 µg/mL) and Lycium barbarum (3664, 10 µg/mL). Mean ± SEM (n = 3).

Similar articles

Cited by

References

    1. Komatsu M., Takei M., Ishii H., Sato Y. Glucose-stimulated insulin secretion: A newer perspective. J. Diabetes Investig. 2013;4:511–516. doi: 10.1111/jdi.12094. - DOI - PMC - PubMed
    1. Kakei M., Yoshida M., Dezaki K., Ito K., Yamada H., Funazaki S., Kawakami M., Sugawara H., Yada T. Glucose and GTP-binding protein-coupled receptor cooperatively regulate transient receptor potential-channels to stimulate insulin secretion Review. Endocr. J. 2016;63:867–876. doi: 10.1507/endocrj.EJ16-0262. - DOI - PubMed
    1. Henquin J.C. Triggering and amplifying pathways of regulation of insulin secretion by glucose. Diabetes. 2000;49:1751–1760. doi: 10.2337/diabetes.49.11.1751. - DOI - PubMed
    1. Tunaru S., Bonnavion R., Brandenburger I., Preussner J., Thomas D., Scholich K., Offermanns S. 20-HETE promotes glucose-stimulated insulin secretion in an autocrine manner through FFAR1. Nat. Commun. 2018;9:177. doi: 10.1038/s41467-017-02539-4. - DOI - PMC - PubMed
    1. Kalwat M.A., Cobb M.H. Mechanisms of the amplifying pathway of insulin secretion in the β cell. Pharmacol. Ther. 2017;179:17–30. doi: 10.1016/j.pharmthera.2017.05.003. - DOI - PMC - PubMed

LinkOut - more resources