. 2021 Aug 20;14(8):820.
doi: 10.3390/ph14080820.

The Synergistic Activity of Bortezomib and TIC10 against A2058 Melanoma Cells

Affiliations

The Synergistic Activity of Bortezomib and TIC10 against A2058 Melanoma Cells

Angéla Takács et al. Pharmaceuticals (Basel). .

Abstract

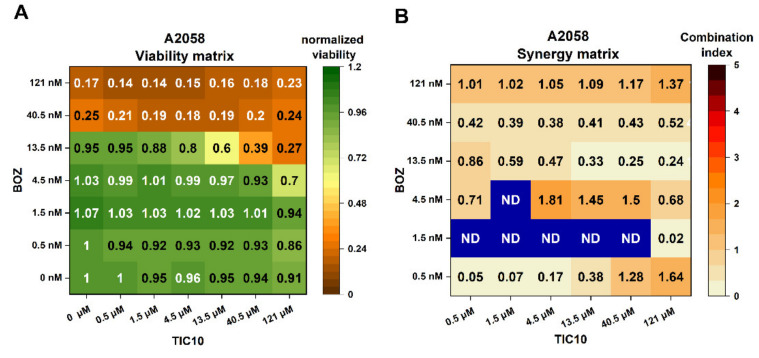
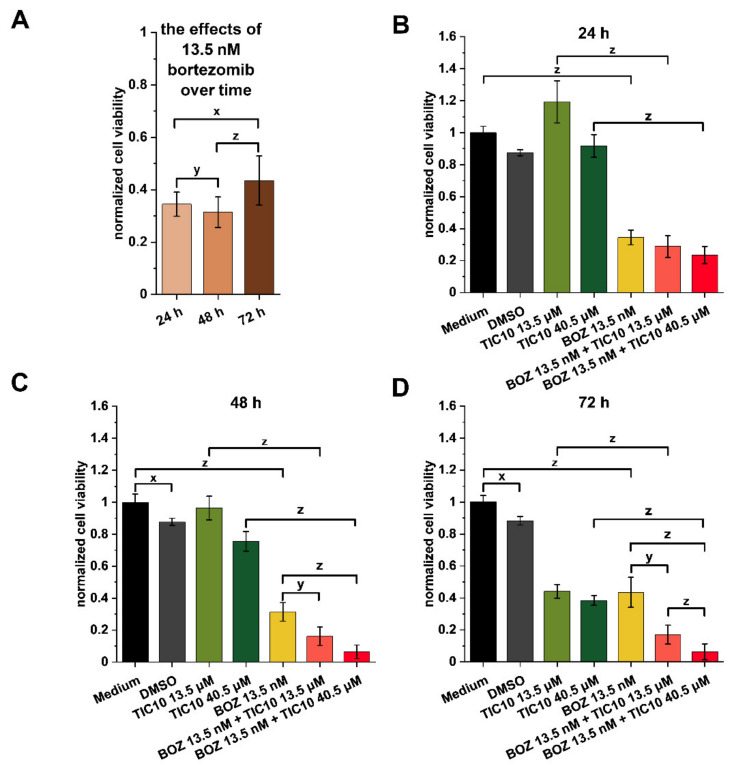
Combination antitumor treatments are essential parts of modern tumor therapy as-compared to monotherapies-(i) they are more effective; (ii) the dose of the compounds can be reduced; and (iii) therefore the side effects are improved. Our research group previously demonstrated the antitumor character of bortezomib (BOZ) in A2058 melanoma cells. Unfortunately, dose-related side effects are common during BOZ therapy, which could be prevented by reducing the dose of BOZ. This study aimed to characterize synergistic combinations of BOZ with a TRAIL (TNF-related apoptosis-inducing ligand) -inducing compound (TIC10), where the doses can be cut down but the efficacy is preserved. Endpoint cell viability assays were performed on A2058 cells, and synergism of BOZ and TIC10 was observed after 72 h. Synergism was further validated in a real-time impedimetric assay, and our results showed that BOZ-treated melanoma cells survived the treatment, an effect not registered in the co-treatments. Treatment with the combinations resulted in increased apoptosis, which was not accompanied by enhanced LDH release. Nevertheless, the expression of death receptor 5 (DR5) was increased on the cell surface without transcriptional regulation. In summary, our findings support the theory that the application of BOZ and TIC10 in combination could provide higher efficacy in vitro.

Keywords: TIC10; antitumor efficacy; bortezomib; combination therapy; melanoma.


Conflict of interest statement

The authors declare no conflict of interest.

Figures

Figure 1
Figure 1
Heat maps showing antiproliferative effects of bortezomib (BOZ), TIC10 and their combinations on A2058 cells after 72 h of incubation. (A) Normalized viability data are expressed as a ratio of medium control, and (B) combination index heat maps of various drug ratios. Combination index < 1, = 1 or > 1 represents synergism, additive effect or antagonism, respectively. ND: not detectable. Data are presented as mean values (n = 3).
Figure 2
Figure 2
Analysis of cell viability at different time points of treatment. A real-time assay was conducted to observe changes over time (A) after bortezomib (BOZ) treatment and (B) after 24 h, (C) after 48 h and (D) after 72 h treatments with the combinations. The data were normalized to the medium control. Data are presented as mean values ± standard deviation (SD) (n = 3). The levels of significance are shown as follows: x: p < 0.05; y: p < 0.01; z: p < 0.001, determined by a one-way ANOVA test followed by Fisher’s LSD post hoc test.
Figure 3
Figure 3
Analysis of the apoptotic and cytotoxic effects of the treatments. (A) Percentage of early apoptotic (Ax V-positive) and (B) late apoptotic (Ax V and 7AAD double-positive) cells, and (C) the fold change of the LDH release after 72 h treatment with bortezomib (BOZ), TIC10 and their combinations. (C) The data were normalized to the medium control. Data are presented as mean values ± standard deviation (SD) (n = 3). The levels of significance are shown as follows: x: p < 0.05; y: p < 0.01; z: p < 0.001, determined by a one-way ANOVA test followed by Fisher’s LSD post hoc test.
Figure 4
Figure 4
Influence on the death receptor 4 (DR4) and death receptor 5 (DR5) expression of melanoma cell line after 72 h exposure. The ratio of the mean fluorescence intensity (RFI) of (A) DR4 expression and (B) DR5 expression is reported. The data were normalized to the medium control (RFI = treated cells MFI/control cells MFI; MFI: mean fluorescence intensity). Data are presented as mean values ± standard deviation (SD) (n = 2). The levels of significance are shown as follows: x: p < 0.05; y: p < 0.01; z: p < 0.001, determined by a one-way ANOVA test followed by Fisher’s LSD post hoc test.

References

    1. Pham D.D.M., Guhan S., Tsao H. KIT and Melanoma: Biological Insights and Clinical Implications. Yonsei Med. J. 2020;61:562–571. doi: 10.3349/ymj.2020.61.7.562. - DOI - PMC - PubMed
    1. Bertrand J.U., Steingrimsson E., Jouenne F., Bressac-de Paillerets B., Larue L. Melanoma Risk and Melanocyte Biology. Acta Derm. Venereol. 2020;100:adv00139. doi: 10.2340/00015555-3494. - DOI - PMC - PubMed
    1. Leonardi G.C., Falzone L., Salemi R., Zanghì A., Spandidos D.A., McCubrey J.A., Candido S., Libra M. Cutaneous melanoma: From pathogenesis to therapy (Review) Int. J. Oncol. 2018;52:1071–1080. doi: 10.3892/ijo.2018.4287. - DOI - PMC - PubMed
    1. Rastrelli M., Tropea S., Rossi C.R., Alaibac M. Melanoma: Epidemiology, Risk Factors, Pathogenesis, Diagnosis and Classification. In Vivo. 2014;28:1005–1011. - PubMed
    1. Simiczyjew A., Dratkiewicz E., Mazurkiewicz J., Ziętek M., Matkowski R., Nowak D. The Influence of Tumor Microenvironment on Immune Escape of Melanoma. Int. J. Mol. Sci. 2020;21:8359. doi: 10.3390/ijms21218359. - DOI - PMC - PubMed

LinkOut - more resources