Review
. 2021 Aug 6;13(8):1214.
doi: 10.3390/pharmaceutics13081214.

The Pharmaceutical Technology Approach on Imaging Innovations from Italian Research

Affiliations
Review

The Pharmaceutical Technology Approach on Imaging Innovations from Italian Research

Giorgia Ailuno et al. Pharmaceutics. .

Abstract

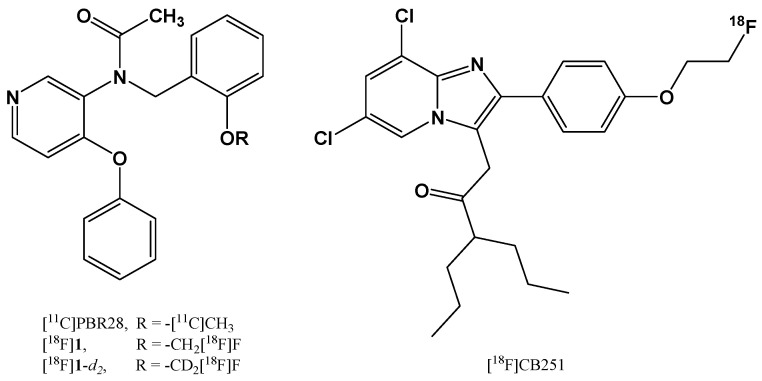
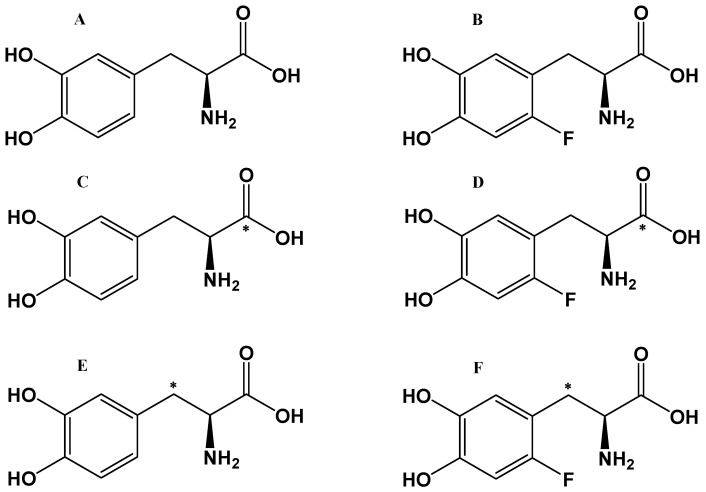
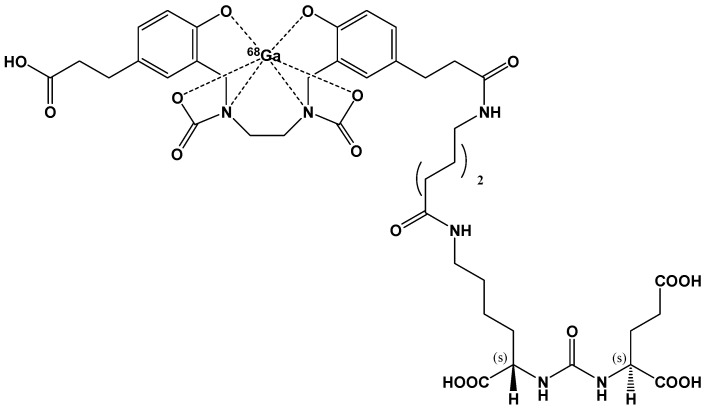
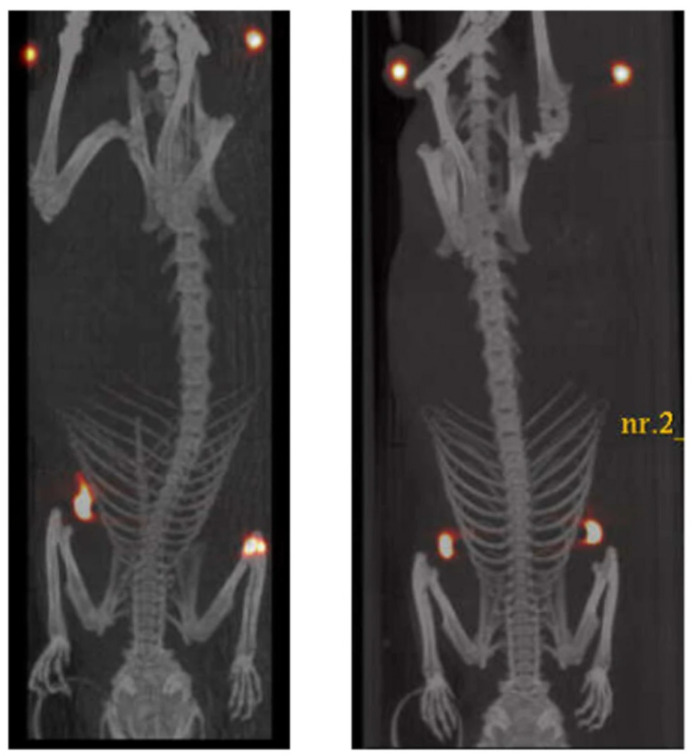
Many modern therapeutic approaches are based on precise diagnostic evidence, where imaging procedures play an essential role. To date, in the diagnostic field, a plethora of agents have been investigated to increase the selectivity and sensitivity of diagnosis. However, the most common drawbacks of conventional imaging agents reside in their non-specificity, short imaging time, instability, and toxicity. Moreover, routinely used diagnostic agents have low molecular weights and consequently a rapid clearance and renal excretion, and this represents a limitation if long-lasting imaging analyses are to be conducted. Thus, the development of new agents for in vivo diagnostics requires not only a deep knowledge of the physical principles of the imaging techniques and of the physiopathological aspects of the disease but also of the relative pharmaceutical and biopharmaceutical requirements. In this scenario, skills in pharmaceutical technology have become highly indispensable in order to respond to these needs. This review specifically aims to collect examples of newly developed diagnostic agents connoting the importance of an appropriate formulation study for the realization of effective products. Within the context of pharmaceutical technology research in Italy, several groups have developed and patented promising agents for fluorescence and radioactive imaging, the most relevant of which are described hereafter.

Keywords: diagnosis; formulations; imaging; nanosystem; nuclear medicine; radiotracers; tumor diagnosis; tumor imaging.


Conflict of interest statement

The authors declare no conflict of interest.

Figures

Figure 1
Figure 1
Chemical structures of [11C]PBR28, [18F]fluoromethyl-PBR28 [18F]1, its deuterate aryloxyanilide analog [18F]1-d2, and [18F]CB251.
Figure 2
Figure 2
[18F]F-DOPA and [11C]-L-DOPA bio-precursor tracers. (A) L-DOPA, (B) [18F]F-DOPA, (C) [11C]-L-DOPA, (D) [11C]F-DOPA, (E) [β-11C]-L-DOPA, and (F) [β-11C]F-DOPA. * indicates labeling in β-position or in the carboxylic position.
Figure 3
Figure 3
Chemical structure of the radiotracer for PET imaging [68Ga]GaPSMA-11.
Figure 4
Figure 4
µPet/CT superimposed images of two adult female rats, 40 h after the injection of 64Cu-HAC in the mammary glands. In the upper part of the images, near hind legs, two objects with high density and imbibed with 64Cu are located as reference points for accurate overlapping of PET and CT images. Reproduced from [28] under a Creative Commons Attribution 4.0 International License (http://creativecommons.org/licenses/by/4.0/).
Figure 5
Figure 5
Upper panel shows the scheme of the synthesis of G(4)-PAMAM-FITC (2), Ac-La-G(4)-PAMAM-FITC (4), and Ac-La-G(4)-PAMAM-FITC/sorafenib (5) dendrimers; bottom panel shows representative single confocal slices of fixed HepG-2 cells: HepG-2 cells imaged with (a) DAPI; (b) Phalloidin-TRITC; (c) Ac-La-G(4)-PAMAM-FITC 4; (d) overlay after an incubation period of 15 min. Bar: 25 μm. Adapted with permission [32]. Copyright 2017, Elsevier B.V.
Figure 6
Figure 6
Upper panel shows a schematic representation of PLGA-TSPO NPs; bottom panel shows the fluorescence microscopy images: cells were seeded onto 24 mm coverslips and treated at 37 °C in a 5% CO2 atmosphere with 0.2 μM FITC−TSPO NPs (concentration is referred to FITC). Internalized FITC fluorescence was acquired after 4 (i), 8 (ii), and 24 h (iii). Cells incubated with 25 nM MitoTracker Red CMXRos (iv) and cells treatment with FITC (7 μM) alone after 24 h (v) were used as the control. Average intensity of internalized fluorescence of treated cells as imaged after 4, 8, and 24 h of incubation (vi). Data are given as means ± SD (bars) for five separate cultures. The statistical significance of differences was calculated by the unpaired Student’s t test with Bonferroni’s correction. * p < 0.05, ** p < 0.005. Adapted with permission [34]. Copyright © 2021 American Chemical Society.
Figure 7
Figure 7
Representative confocal microscopy image of co-localization in a double-tagged C6 glioma cell (green: TSPO targeted-G(4)-PAMAM dendrimers grafted with FITC 1 μM; red: mitochondrion tagged with MitoTracker Red; yellow: convergence of red and green, indicating co-localization). Insert: TSPO ligand molecule and the TSPO-targeted G(4)-PAMAM–FITC dendrimer. Reproduced with permission [62]. Copyright 2017, Wiley-VCH Verlag GmbH & Co. KGaA, Weinheim.
Figure 8
Figure 8
(A) Co-localization analysis of C6 rat glioma cells stained with MitoTracker green and TSPO-targeted QD@SiO2 NPs. All pixels of the co-localization image shown in panel B are reported in the scatter diagram of panel A, in which the two image channels are compared. Region 1 of the diagram displays the co-localization pixels. (B) Representative confocal image of co-localization of TSPO-targeted QD@SiO2 NPs (red) and MitoTracker (green) in C6 cells. The co-localization is marked by the convergence of the red and green to yellow fluorescence; scale bar: 10 μm. (C) TSPO-targeted QD@SiO2 NPs. Reproduced with permission [62]. Copyright 2017, Wiley-VCH Verlag GmbH & Co. KGaA, Weinheim.
Figure 9
Figure 9
Fluorescence imaging study by IVIS Lumina XRMS. (a) Imaging of U87-MG xenograft model at 30 min, 1 h, 4 h, 8 h, and 24 h post-injection of TSPO-targeted NP of 200 µg. (b) Inhibition study using PK 11195 (10 mg/1 kg). (c) Tumor-to-skin ratios in mouse models with PK 11195 pre-injection or without PK11195 pre-injection. Reproduced with permission [38]. Copyright © 2021 Elsevier B.V. All rights reserved.

References

    1. Kasban H., Atomic E., Authority E. A Comparative Study of Medical Imaging Techniques. Int. J. Latest Trends Eng. Technol. 2015;4:37–58.
    1. Ai T., Morelli J.N., Hu X., Hao D., Goerner F.L., Ager B., Runge V.M. A historical overview of magnetic resonance imaging, focusing on technological innovations. Investig. Radiol. 2012;47:725–741. doi: 10.1097/RLI.0b013e318272d29f. - DOI - PubMed
    1. Haris M., Yadav S.K., Rizwan A., Singh A., Wang E., Hariharan H., Reddy R., Marincola F.M. Molecular magnetic resonance imaging in cancer. J. Transl. Med. 2015;13:313. doi: 10.1186/s12967-015-0659-x. - DOI - PMC - PubMed
    1. Saslow D., Boetes C., Burke W., Harms S., Leach M.O., Lehman C.D., Morris E., Pisano E., Schnall M., Sener S., et al. American cancer society guidelines for breast screening with MRI as an adjunct to mammography. Obstet. Gynecol. Surv. 2007;62:458–460. doi: 10.1097/01.ogx.0000269073.50925.38. - DOI - PubMed
    1. Kirkham A.P.S., Emberton M., Allen C. How Good is MRI at Detecting and Characterising Cancer within the Prostate? Eur. Urol. 2006;50:1163–1175. doi: 10.1016/j.eururo.2006.06.025. - DOI - PubMed

LinkOut - more resources