

Nebulised Isotonic Hydroxychloroquine Aerosols for Potential Treatment of COVID-19
- PMID: 34452220
- PMCID: PMC8399722
- DOI: 10.3390/pharmaceutics13081260
Nebulised Isotonic Hydroxychloroquine Aerosols for Potential Treatment of COVID-19
Abstract
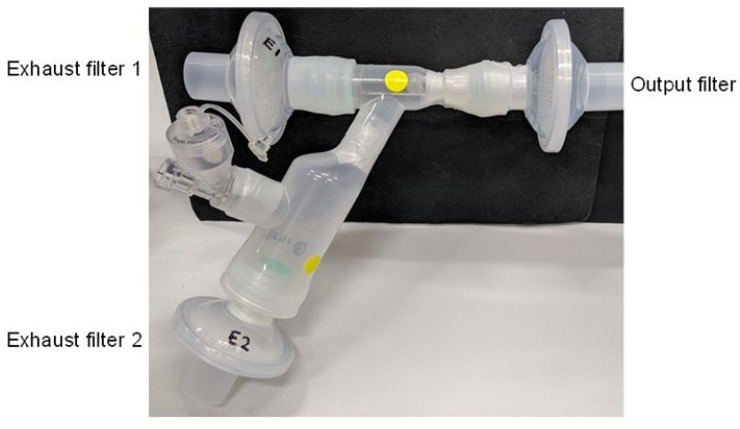
The coronavirus disease 2019 (COVID-19) is an unprecedented pandemic that has severely impacted global public health and the economy. Hydroxychloroquine administered orally to COVID-19 patients was ineffective, but its antiviral and anti-inflammatory actions were observed in vitro. The lack of efficacy in vivo could be due to the inefficiency of the oral route in attaining high drug concentration in the lungs. Delivering hydroxychloroquine by inhalation may be a promising alternative for direct targeting with minimal systemic exposure. This paper reports on the characterisation of isotonic, pH-neutral hydroxychloroquine sulphate (HCQS) solutions for nebulisation for COVID-19. They can be prepared, sterilised, and nebulised for testing as an investigational new drug for treating this infection. The 20, 50, and 100 mg/mL HCQS solutions were stable for at least 15 days without refrigeration when stored in darkness. They were atomised from Aerogen Solo Ultra vibrating mesh nebulisers (1 mL of each of the three concentrations and, in addition, 1.5 mL of 100 mg/mL) to form droplets having a median volumetric diameter of 4.3-5.2 µm, with about 50-60% of the aerosol by volume < 5 µm. The aerosol droplet size decreased (from 4.95 to 4.34 µm) with increasing drug concentration (from 20 to 100 mg/mL). As the drug concentration and liquid volume increased, the nebulisation duration increased from 3 to 11 min. The emitted doses ranged from 9.1 to 75.9 mg, depending on the concentration and volume nebulised. The HCQS solutions appear suitable for preclinical and clinical studies for potential COVID-19 treatment.
Keywords: aerosol; coronavirus disease 2019 (COVID-19); droplet; hydroxychloroquine; inhalation; vibrating mesh nebuliser.
Conflict of interest statement
M.Y.T.C., R.Y.K.C., P.T., H.-K.C. and P.C.L.K. are employees of The University of Sydney. W.T. is a PhD student of The University of Sydney under the supervision of P.C.L.K. and H.-K.C. I.G. is a consultant and shareholder in Pulmoquine Therapeutics, Inc. R.B.M. is a founder, equity holder, and member of the scientific advisory board of Pulmoquine Therapeutics, Inc. The Company had no role in the design of the study; in the collection, analyses, or interpretation of data; in the writing of the manuscript, or in the decision to publish the results.
Figures


References
-
- Johns Hopkins University COVID-19 Dashboard by the Center for Systems Science and Engineering (CSSE) at Johns Hopkins University (JHU) [(accessed on 17 July 2021)]; Available online: https://coronavirus.jhu.edu/map.html.
Grants and funding
LinkOut - more resources
Full Text Sources
Research Materials
