

Exacerbation of Influenza A Virus Disease Severity by Respiratory Syncytial Virus Co-Infection in a Mouse Model
- PMID: 34452495
- PMCID: PMC8402720
- DOI: 10.3390/v13081630
Exacerbation of Influenza A Virus Disease Severity by Respiratory Syncytial Virus Co-Infection in a Mouse Model
Abstract
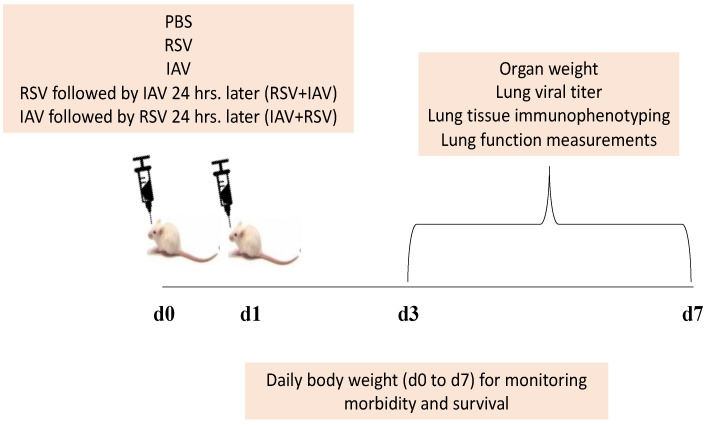
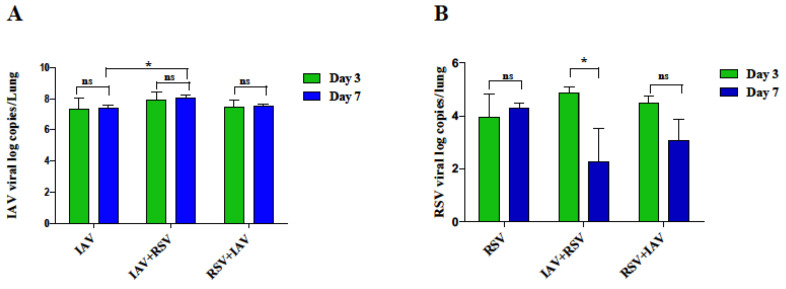
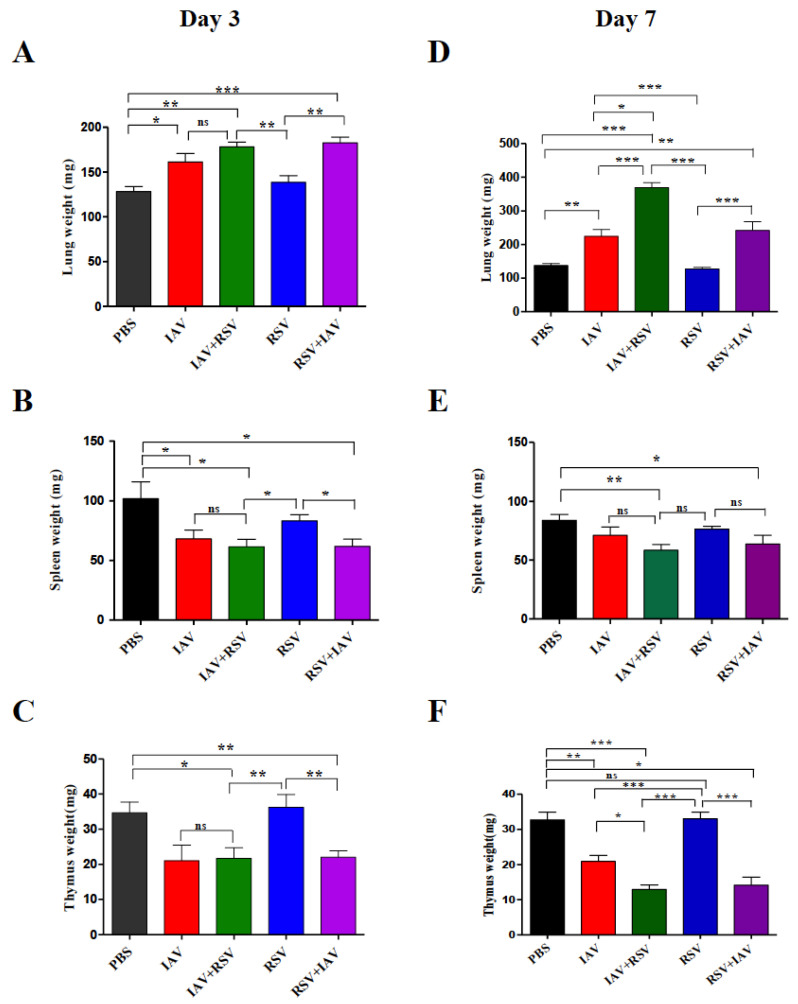
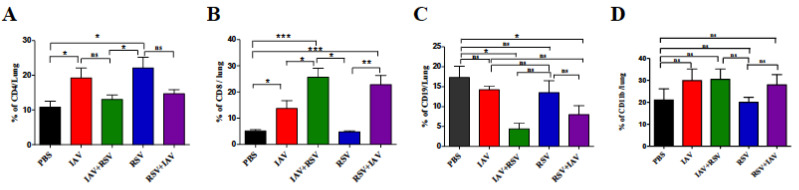
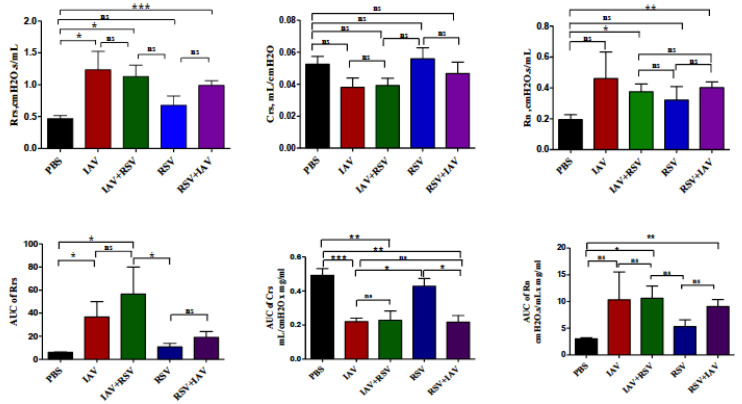
Influenza A virus (IAV) and respiratory syncytial virus (RSV) are leading causes of childhood infections. RSV and influenza are competitive in vitro. In this study, the in vivo effects of RSV and IAV co-infection were investigated. Mice were intranasally inoculated with RSV, with IAV, or with both viruses (RSV+IAV and IAV+RSV) administered sequentially, 24 h apart. On days 3 and 7 post-infection, lung tissues were processed for viral loads and immune cell populations. Lung functions were also evaluated. Mortality was observed only in the IAV+RSV group (50% of mice did not survive beyond 7 days). On day 3, the viral loads in single-infected and co-infected mice were not significantly different. However, on day 7, the IAV titer was much higher in the IAV+RSV group, and the RSV viral load was reduced. CD4 T cells were reduced in all groups on day 7 except in single-infected mice. CD8 T cells were higher in all experimental groups except the RSV-alone group. Increased airway resistance and reduced thoracic compliance were demonstrated in both co-infected groups. This model indicates that, among all the infection types we studied, infection with IAV followed by RSV is associated with the highest IAV viral loads and the most morbidity and mortality.
Keywords: IAV; RSV; co-infection; mortality; viral titer.
Conflict of interest statement
The authors declare no conflict of interest.
Figures

Similar articles
-
Influenza A virus interferes with respiratory syncytial virus in mice and reconstituted human airway epithelium.Microbiol Spectr. 2025 Jun 3;13(6):e0318724. doi: 10.1128/spectrum.03187-24. Epub 2025 May 14. Microbiol Spectr. 2025. PMID: 40366152 Free PMC article.
-
Influenza A Virus Inhibits RSV Infection via a Two-Wave Expression of IFIT Proteins.Viruses. 2020 Oct 16;12(10):1171. doi: 10.3390/v12101171. Viruses. 2020. PMID: 33081322 Free PMC article.
-
Inflammation and emphysema in cigarette smoke-exposed mice when instilled with poly (I:C) or infected with influenza A or respiratory syncytial viruses.Respir Res. 2016 Jul 1;17(1):75. doi: 10.1186/s12931-016-0392-x. Respir Res. 2016. PMID: 27363862 Free PMC article.
-
The pathogenesis of respiratory syncytial virus disease in childhood.Br Med Bull. 2002;61:13-28. doi: 10.1093/bmb/61.1.13. Br Med Bull. 2002. PMID: 11997296 Review.
-
Inno4Vac Workshop Report Part 2: RSV-Controlled Human Infection Model (CHIM) Strain Selection and Immune Assays for RSV CHIM Studies, November 2021, MHRA, UK.Influenza Other Respir Viruses. 2024 Oct;18(10):e70013. doi: 10.1111/irv.70013. Influenza Other Respir Viruses. 2024. PMID: 39440808 Free PMC article. Review.
Cited by
-
Priming With Rhinovirus Protects Mice Against a Lethal Pulmonary Coronavirus Infection.Front Immunol. 2022 May 30;13:886611. doi: 10.3389/fimmu.2022.886611. eCollection 2022. Front Immunol. 2022. PMID: 35711419 Free PMC article.
-
Respiratory Syncytial Virus Protects Bystander Cells against Influenza A Virus Infection by Triggering Secretion of Type I and Type III Interferons.J Virol. 2022 Nov 23;96(22):e0134122. doi: 10.1128/jvi.01341-22. Epub 2022 Nov 3. J Virol. 2022. PMID: 36326278 Free PMC article.
-
An RNA-hydrolyzing recombinant minibody prevents both influenza A virus and coronavirus in co-infection models.Sci Rep. 2024 Apr 11;14(1):8472. doi: 10.1038/s41598-024-52810-0. Sci Rep. 2024. PMID: 38605110 Free PMC article.
-
Toxoplasma gondii, HBV, and HCV co-infection and their correlation with CD4 cells among Iranian HIV-positive patients.Immun Inflamm Dis. 2023 Feb;11(2):e794. doi: 10.1002/iid3.794. Immun Inflamm Dis. 2023. PMID: 36840494 Free PMC article.
-
Influenza A and Respiratory Syncytial Virus Trigger a Cellular Response That Blocks Severe Acute Respiratory Syndrome Virus 2 Infection in the Respiratory Tract.J Infect Dis. 2023 Jun 15;227(12):1396-1406. doi: 10.1093/infdis/jiac494. J Infect Dis. 2023. PMID: 36550077 Free PMC article.
References
-
- GBD 2016 Lower Respiratory Infections Collaborators Estimates of the global, regional, and national morbidity, mortality, and aetiologies of lower respiratory infections in 195 countries, 1990–2016: A systematic analysis for the Global Burden of Disease Study 2016. Lancet Infect. Dis. 2018;18:1191–1210. doi: 10.1016/S1473-3099(18)30310-4. - DOI - PMC - PubMed
-
- Aberle J.H., Aberle S.W., Pracher E., Hutter H.P., Kundi M., Popow-Kraupp T. Single versus dual respiratory virus infections in hospitalized infants: Impact on clinical course of disease and interferon-γ response. Pediatric Infect. Dis. J. 2005;24:605–610. doi: 10.1097/01.inf.0000168741.59747.2d. - DOI - PubMed
Publication types
MeSH terms
LinkOut - more resources
Full Text Sources
Medical
Research Materials
