. 2021 Aug 18;13(8):1635.
doi: 10.3390/v13081635.

Modeling Within-Host Dynamics of SARS-CoV-2 Infection: A Case Study in Ferrets

Affiliations

Modeling Within-Host Dynamics of SARS-CoV-2 Infection: A Case Study in Ferrets

Naveen K Vaidya et al. Viruses. .

Abstract

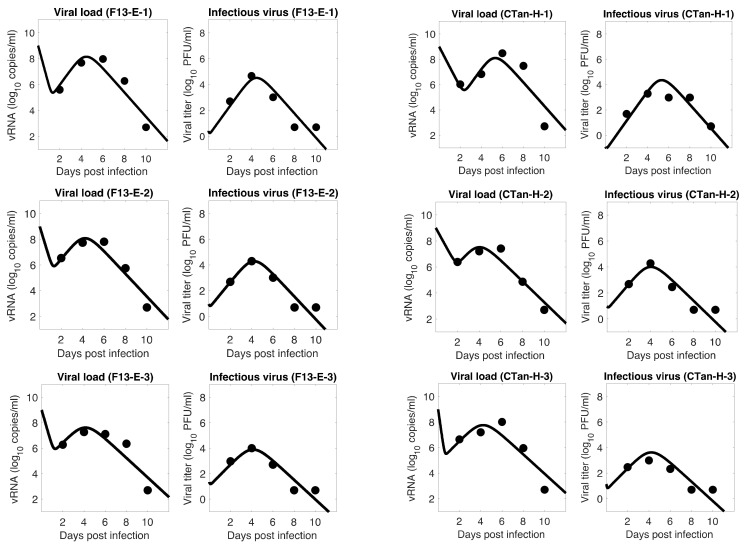
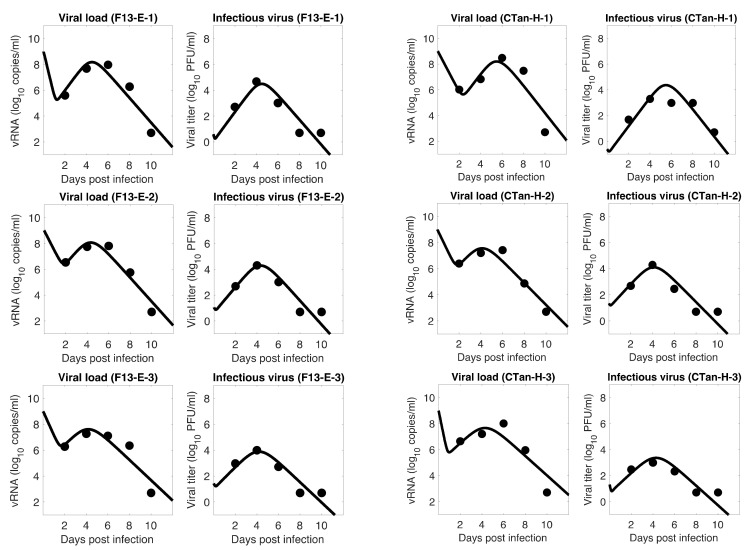
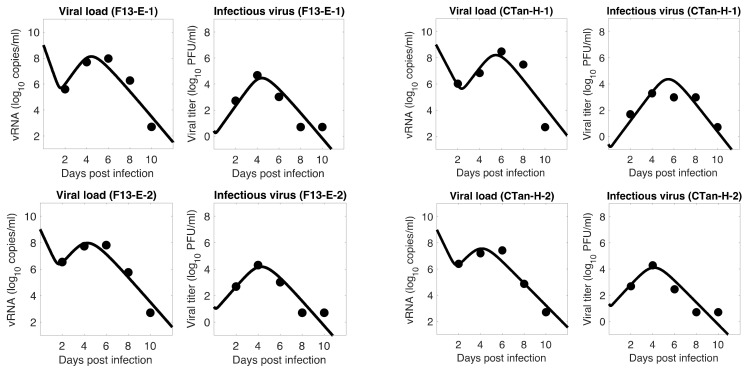
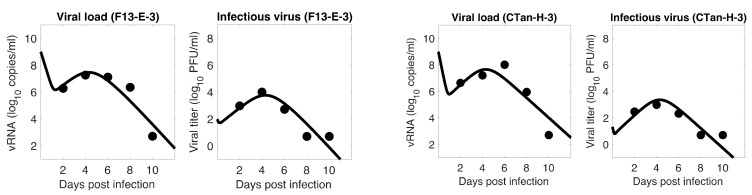
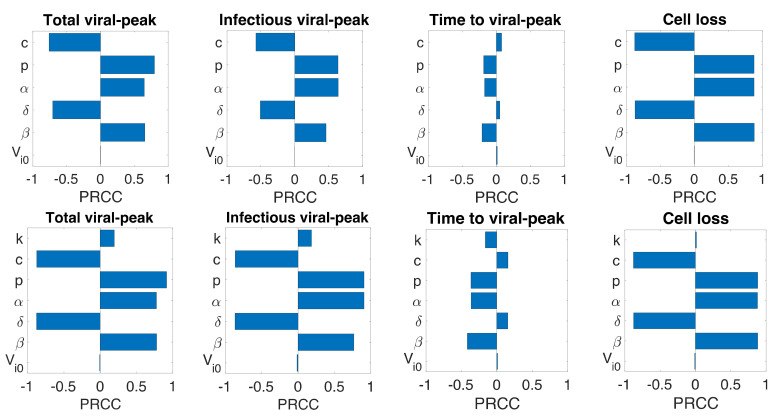
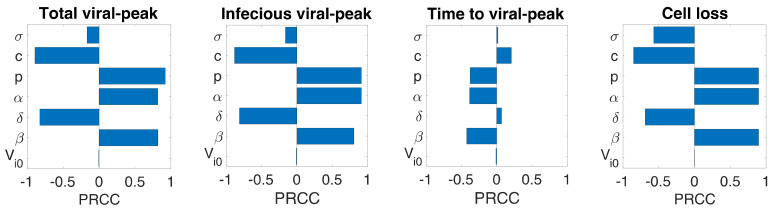
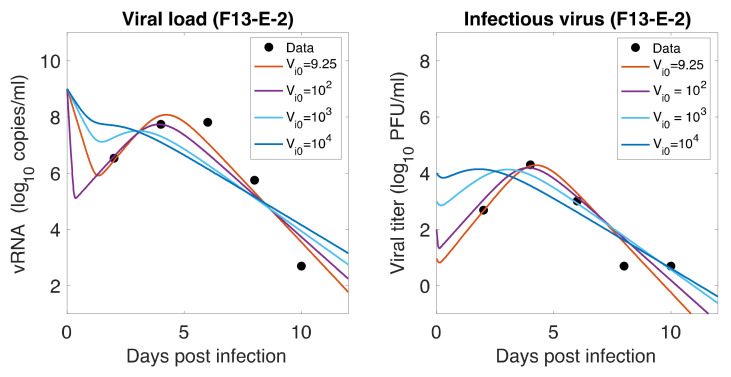
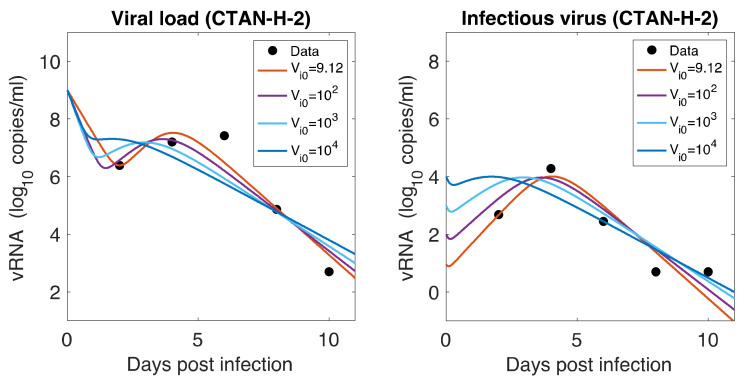
The pre-clinical development of antiviral agents involves experimental trials in animals and ferrets as an animal model for the study of SARS-CoV-2. Here, we used mathematical models and experimental data to characterize the within-host infection dynamics of SARS-CoV-2 in ferrets. We also performed a global sensitivity analysis of model parameters impacting the characteristics of the viral infection. We provide estimates of the viral dynamic parameters in ferrets, such as the infection rate, the virus production rate, the infectious virus proportion, the infected cell death rate, the virus clearance rate, as well as other related characteristics, including the basic reproduction number, pre-peak infectious viral growth rate, post-peak infectious viral decay rate, pre-peak infectious viral doubling time, post-peak infectious virus half-life, and the target cell loss in the respiratory tract. These parameters and indices are not significantly different between animals infected with viral strains isolated from the environment and isolated from human hosts, indicating a potential for transmission from fomites. While the infection period in ferrets is relatively short, the similarity observed between our results and previous results in humans supports that ferrets can be an appropriate animal model for SARS-CoV-2 dynamics-related studies, and our estimates provide helpful information for such studies.

Keywords: COVID-19; SARS-CoV-2; ferrets; viral dynamics; within-host modeling.


Conflict of interest statement

The authors declare no conflict of interest.

Figures

Figure 1
Figure 1
Model 1 fitting to the data. Prediction of the viral dynamics model 1 (solid line) along with the data (filled circle) containing the total viral load (RNA copies per mL) and the infectious virus titer (PFU per mL), collected from ferrets infected with F13-E SARS-CoV-2 and CTan-H SARS-CoV-2.
Figure 2
Figure 2
Model 2 fitting to the data. Prediction of the viral dynamics model 2 (solid line) along with the data (filled circle) containing the total viral load (RNA copies per mL) and the infectious virus titer (PFU per mL), collected from ferrets infected with F13-E SARS-CoV-2 and CTan-H SARS-CoV-2.
Figure 3
Figure 3
Model 3 fitting to the data. Prediction of the viral dynamics model 3 (solid line) along with the data (filled circle) containing the total viral load (RNA copies per mL) and the infectious virus titer (PFU per mL), collected from ferrets infected with F13-E SARS-CoV-2 and CTan-H SARS-CoV-2.
Figure 3
Figure 3
Model 3 fitting to the data. Prediction of the viral dynamics model 3 (solid line) along with the data (filled circle) containing the total viral load (RNA copies per mL) and the infectious virus titer (PFU per mL), collected from ferrets infected with F13-E SARS-CoV-2 and CTan-H SARS-CoV-2.
Figure 4
Figure 4
Sensitivity analysis. Partial rank correlation coefficients (PRCC) from the Latin hypercube sampling method of the total viral-peak size (1st column), infectious viral peak size (2nd column), time to viral-peak (3rd column), and cell loss (4th column) for Model 1 (1st row), Model 2 (2nd Row), and Model 3 (3rd row).
Figure 4
Figure 4
Sensitivity analysis. Partial rank correlation coefficients (PRCC) from the Latin hypercube sampling method of the total viral-peak size (1st column), infectious viral peak size (2nd column), time to viral-peak (3rd column), and cell loss (4th column) for Model 1 (1st row), Model 2 (2nd Row), and Model 3 (3rd row).
Figure 5
Figure 5
Role of Initial infectious viruses. Fitting data with initial virus at the infection site (Vi0) estimated vs fixed. Shown here are two representative animals from each of the two groups infected with F13-E SARS-CoV-2 and CTan-H SARS-CoV-2. The best-fit curves corresponding to Vi0=9.25 PFU/mL (F13-E-2) and Vi0=9.12 PFU/mL (CTan-H-2) were obtained by allowing Vi0 to be estimated by data fitting process, while other best-fit curves were obtained by fixing the values of Vi0 at 102, 103, and 104 PFU/mL.
Figure 5
Figure 5
Role of Initial infectious viruses. Fitting data with initial virus at the infection site (Vi0) estimated vs fixed. Shown here are two representative animals from each of the two groups infected with F13-E SARS-CoV-2 and CTan-H SARS-CoV-2. The best-fit curves corresponding to Vi0=9.25 PFU/mL (F13-E-2) and Vi0=9.12 PFU/mL (CTan-H-2) were obtained by allowing Vi0 to be estimated by data fitting process, while other best-fit curves were obtained by fixing the values of Vi0 at 102, 103, and 104 PFU/mL.

Similar articles

Cited by

References

    1. Shi J., Wen Z., Zhong G., Yang H., Wang C., Huang B., Liu R., He X., Shuai L., Sun Z., et al. Susceptibility of ferrets, cats, dogs, and other domesticated animals to SARS-coronavirus 2. Science. 2020;368:1016–1020. doi: 10.1126/science.abb7015. - DOI - PMC - PubMed
    1. Wu F., Zhao S., Yu B., Chen Y.M., Wang W., Song Z.G., Hu Y., Tao Z.W., Tian J.H., Pei Y.Y., et al. A new coronavirus associated with human respiratory disease in China. Nature. 2020;579:265–269. doi: 10.1038/s41586-020-2008-3. - DOI - PMC - PubMed
    1. Chan J.F., Kok K.H., Zhu Z., Chu H., To K.K., Yuan S., Yuen K.Y. Genomic characterization of the 2019 novel human-pathogenic coronavirus isolated from a patient with atypical pneumonia after visiting Wuhan. Emerg. Microbes Infect. 2020;9:221–236. doi: 10.1080/22221751.2020.1719902. - DOI - PMC - PubMed
    1. Zou L., Ruan F., Huang M., Liang L., Huang H., Hong Z., Yu J., Kang M., Song Y., Xia J., et al. SARS-CoV-2 Viral Load in Upper Respiratory Specimens of Infected Patients. N. Engl. J. Med. 2020;382:1177–1179. doi: 10.1056/NEJMc2001737. - DOI - PMC - PubMed
    1. WHO . WHO Coronavirus (COVID-19) Dashboard. WHO; Geneva, Switzerland: 2021.

Publication types