. 2021 Aug 18;13(8):1636.
doi: 10.3390/v13081636.

Adeno-Associated Vector-Delivered CRISPR/ Sa Cas9 System Reduces Feline Leukemia Virus Production In Vitro

Affiliations

Adeno-Associated Vector-Delivered CRISPR/ Sa Cas9 System Reduces Feline Leukemia Virus Production In Vitro

A Katrin Helfer-Hungerbuehler et al. Viruses. .

Abstract

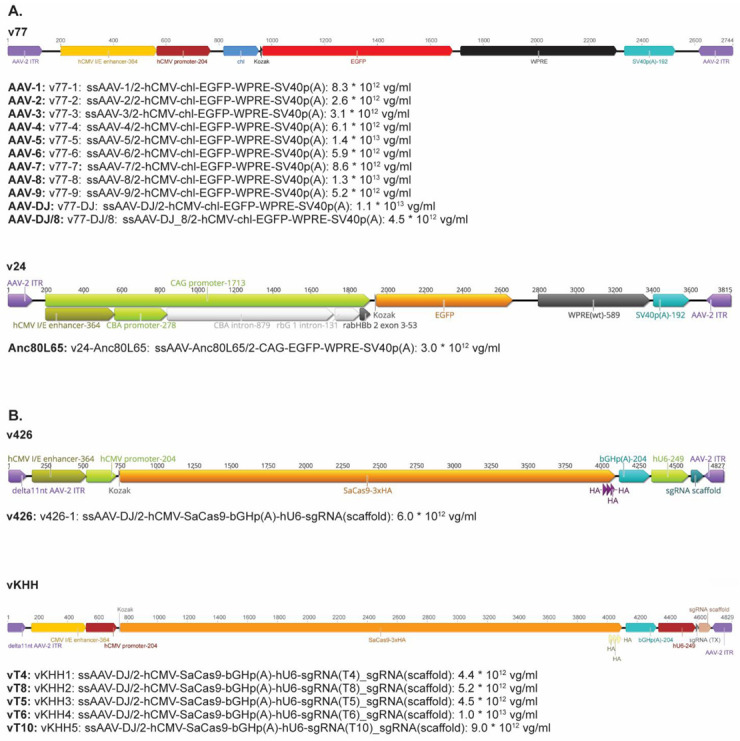
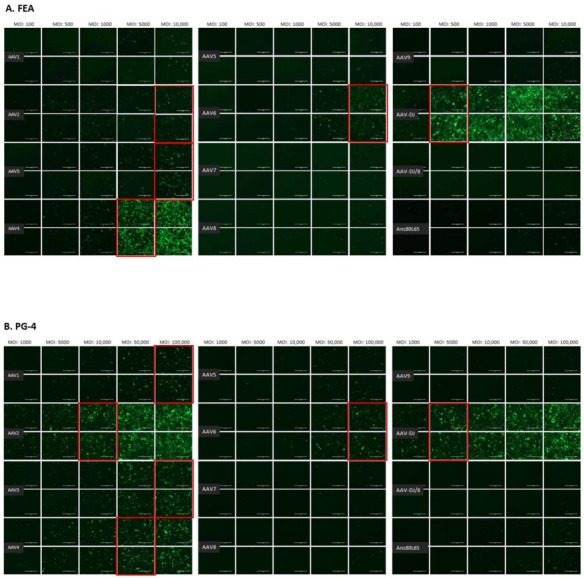
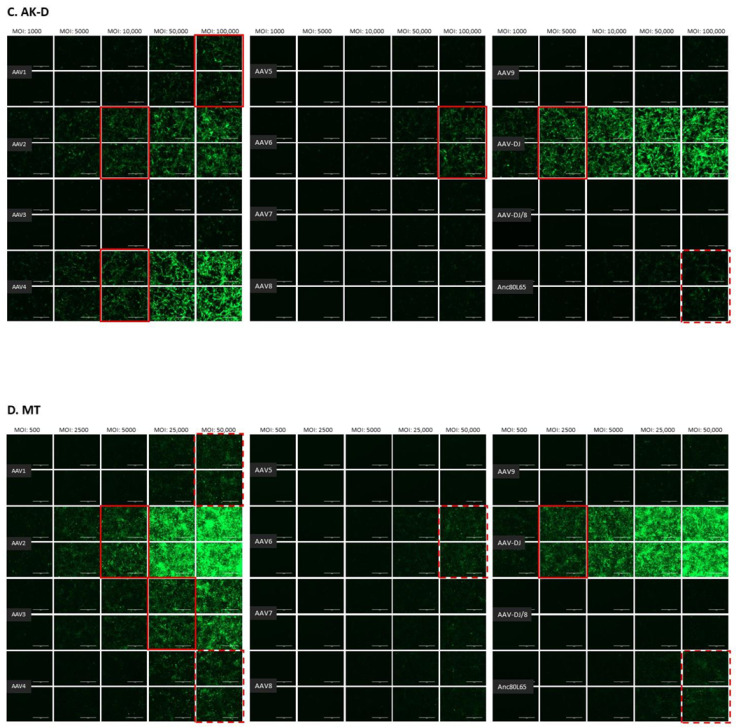
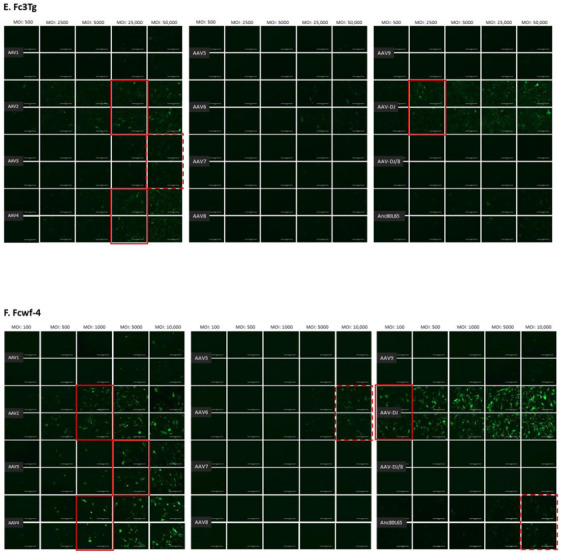
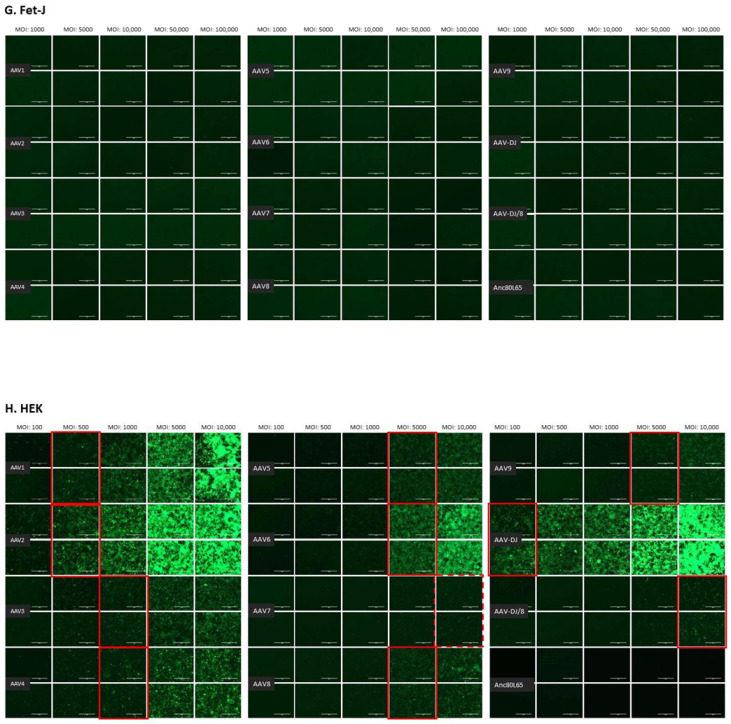
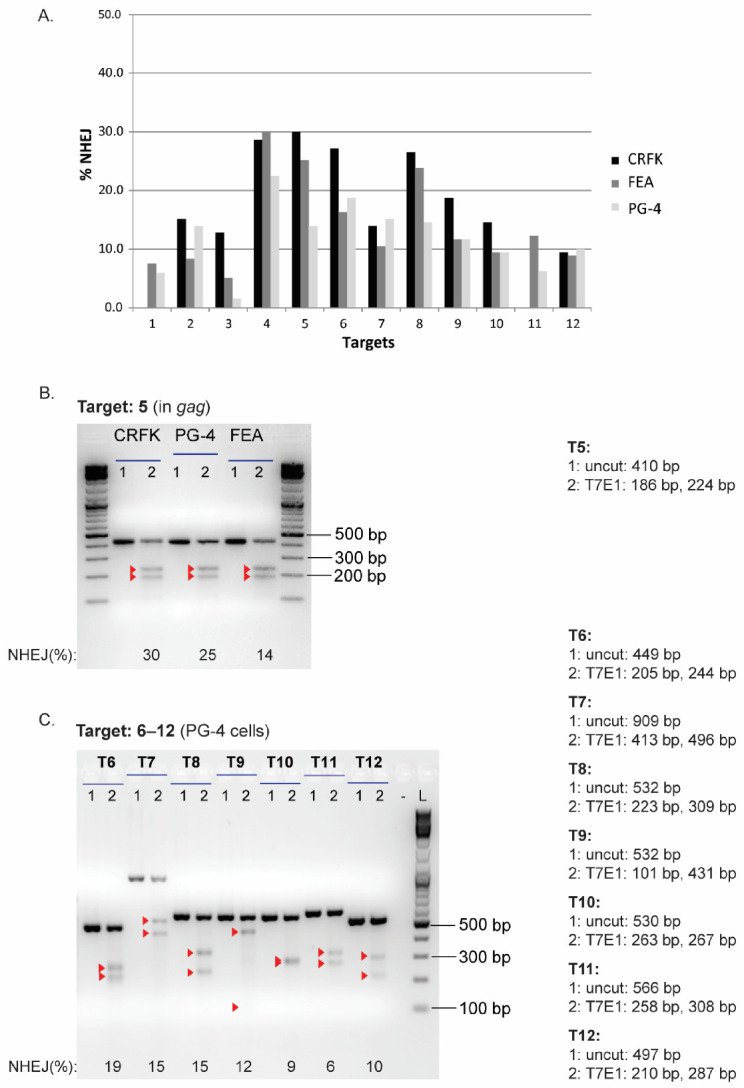
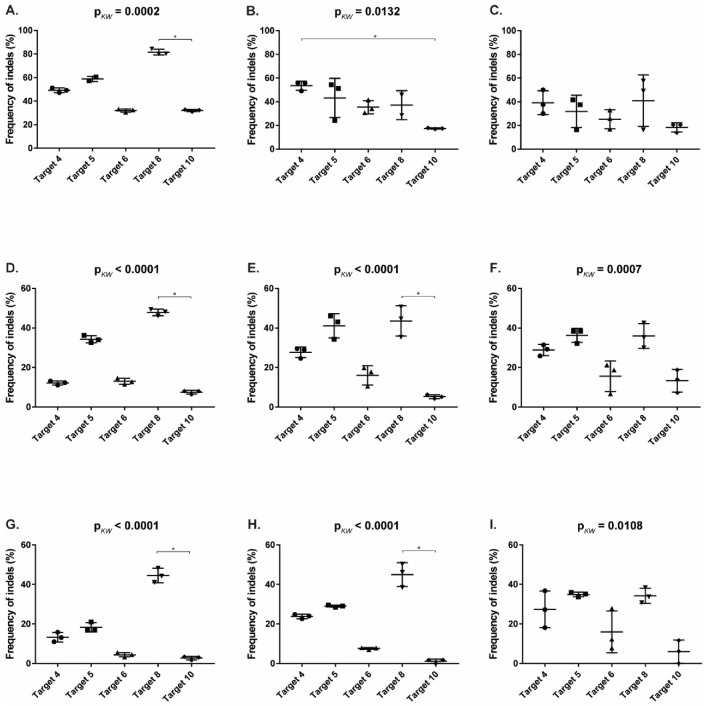
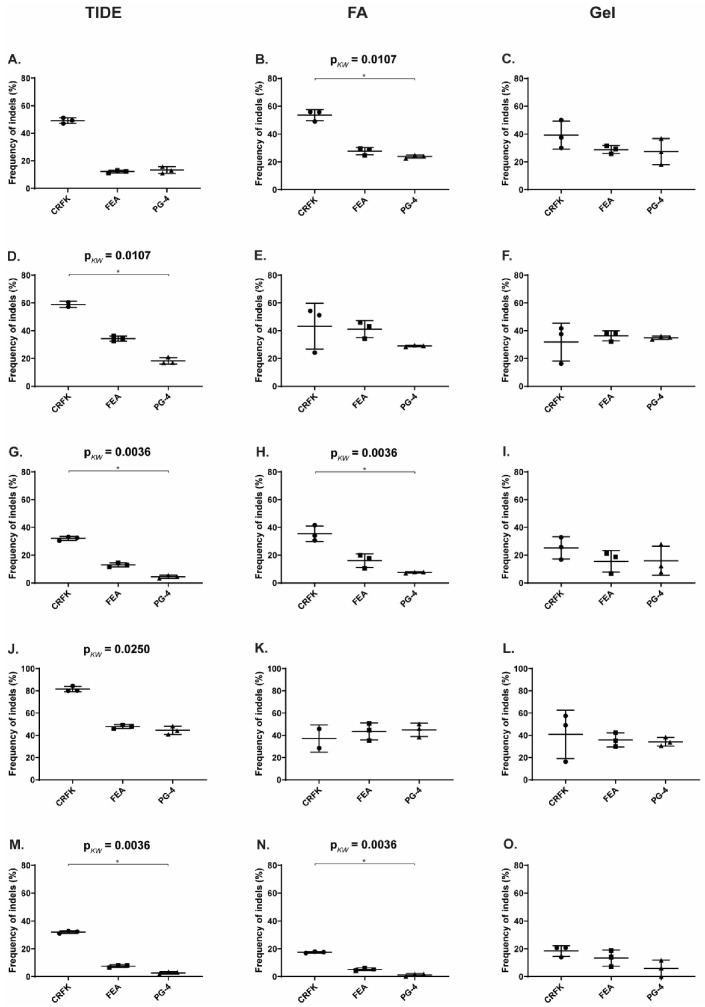
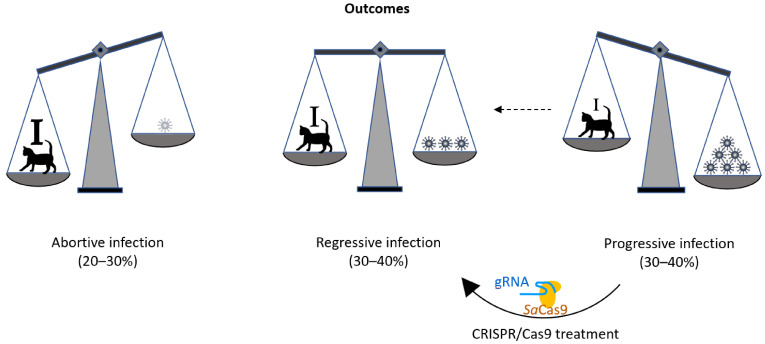
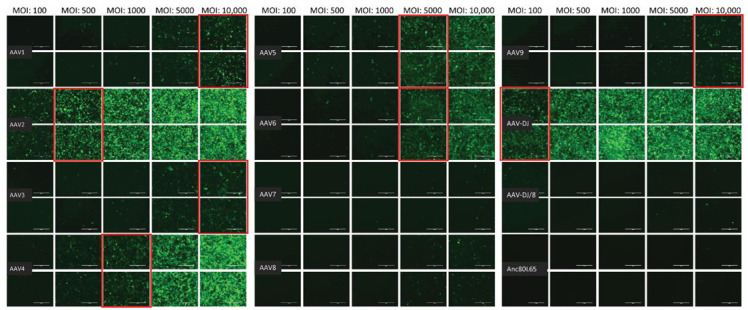
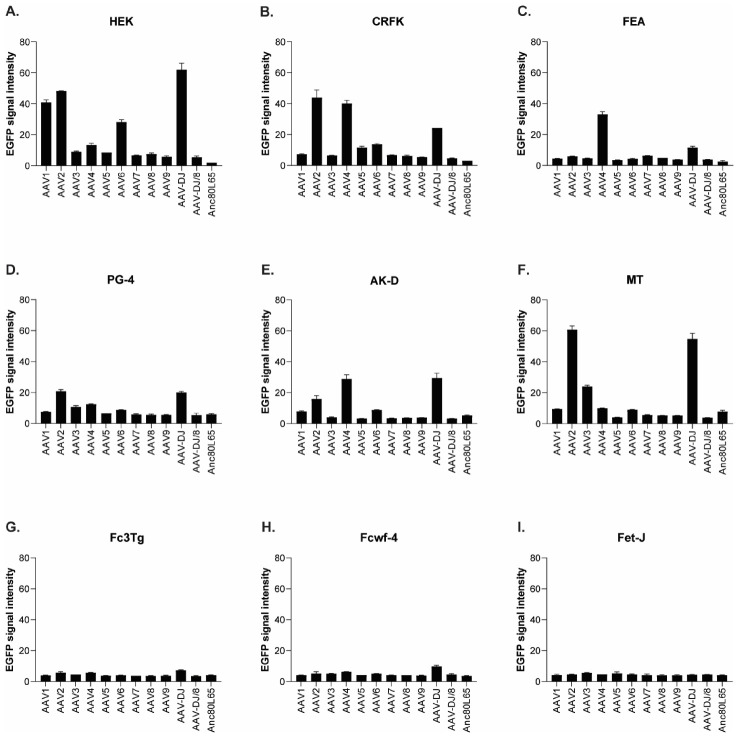
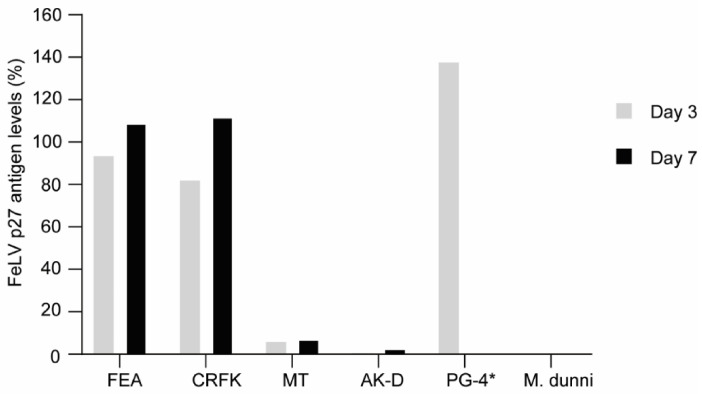
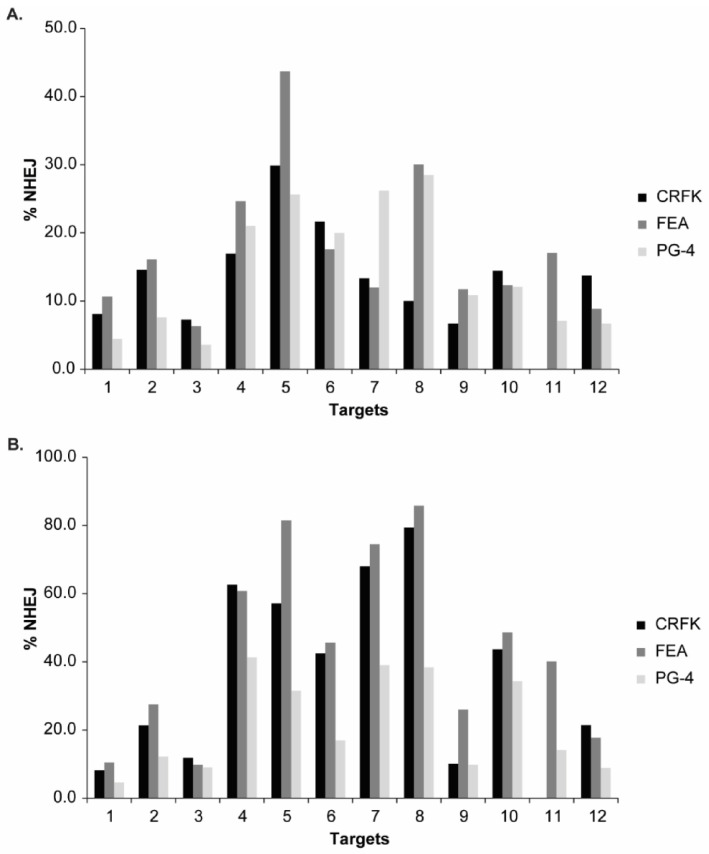
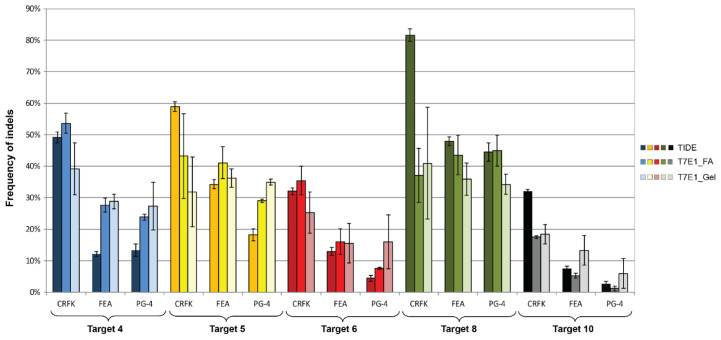
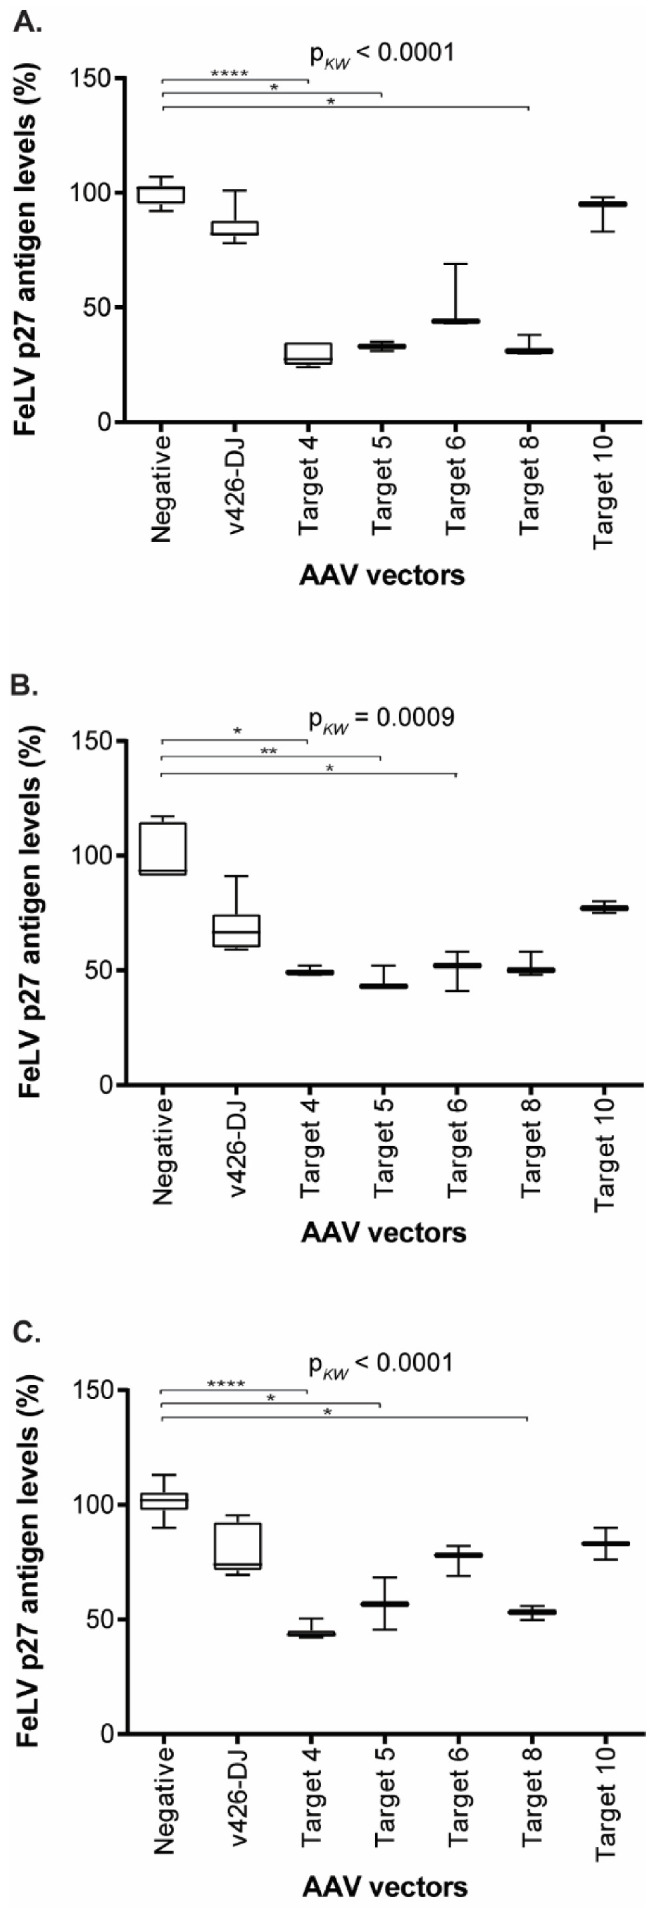
Feline leukemia virus (FeLV) is a retrovirus of cats worldwide. High viral loads are associated with progressive infection and the death of the host, due to FeLV-associated disease. In contrast, low viral loads, an effective immune response, and a better clinical outcome can be observed in cats with regressive infection. We hypothesize that by lowering viral loads in progressively infected cats, using CRISPR/SaCas9-assisted gene therapy, the cat's immune system may be permitted to direct the infection towards a regressive outcome. In a step towards this goal, the present study evaluates different adeno-associated vectors (AAVs) for their competence in delivering a gene editing system into feline cells, followed by investigations of the CRISPR/SaCas9 targeting efficiency for different sites within the FeLV provirus. Nine natural AAV serotypes, two AAV hybrid strains, and Anc80L65, an in silico predicted AAV ancestor, were tested for their potential to infect different feline cell lines and feline primary cells. AAV-DJ revealed superior infection efficiency and was thus employed in subsequent transduction experiments. The introduction of double-strand breaks, using the CRISPR/SaCas9 system targeting 12 selected FeLV provirus sites, was confirmed by T7 endonuclease 1 (T7E1), as well as Tracking of Indels by Decomposition (TIDE) analysis. The highest percentage (up to 80%) of nonhomologous end-joining (NHEJ) was found in the highly conserved gag and pol regions. Subsequent transduction experiments, using AAV-DJ, confirmed indel formation and showed a significant reduction in FeLV p27 antigen for some targets. The targeting of the FeLV provirus was efficient when using the CRISPR/SaCas9 approach in vitro. Whether the observed extent of provirus targeting will be sufficient to provide progressively FeLV-infected cats with the means to overcome the infection needs to be further investigated in vivo.

Keywords: AAV; CRISPR; FeLV; SaCas9; cat; feline leukemia virus; gene editing; provirus.


Conflict of interest statement

The authors declare no conflict of interest. The funders had no role in the design of the study; in the collection, analyses, or interpretation of data; in the writing of the manuscript; or in the decision to publish the results.

Figures

Figure A1
Figure A1
Schematic representation and concentration of the AAV vectors used in this study. (A). AAV vectors used for the determination of the tropism. (B). Gene therapy vectors.
Figure A2
Figure A2
Fluorescent microscopy images of cells infected with 12 AAV serotypes. (A) FEA, (B) PG-4, (C) AK-D, (D) MT, (E) Fc3Tg, (F) Fcwf-4, (G) Fet-J, and (H) HEK cells infected with 12 AAV serotypes. Infection of nine natural AAV serotypes (AAV1-9), two AAV hybrid strains (AAV-DJ and AAV-DJ/8), and Anc80L65, all EGFP tagged from the upper left to the lower right, using a multiplicity of infection (MOI) between 100 and 100,000 (specific MOI depended on the cell line) after 3 days. Red squares mark the minimal MOI at which a significant AAV infection could be visualized for each AAV serotype by fluorescence (corresponding to ≥50% infection); red dashed squares represent the minimal MOI, at which a EGFP signal was clearly visible, but not reaching 50% infection. The bars represent 400 µm.
Figure A2
Figure A2
Fluorescent microscopy images of cells infected with 12 AAV serotypes. (A) FEA, (B) PG-4, (C) AK-D, (D) MT, (E) Fc3Tg, (F) Fcwf-4, (G) Fet-J, and (H) HEK cells infected with 12 AAV serotypes. Infection of nine natural AAV serotypes (AAV1-9), two AAV hybrid strains (AAV-DJ and AAV-DJ/8), and Anc80L65, all EGFP tagged from the upper left to the lower right, using a multiplicity of infection (MOI) between 100 and 100,000 (specific MOI depended on the cell line) after 3 days. Red squares mark the minimal MOI at which a significant AAV infection could be visualized for each AAV serotype by fluorescence (corresponding to ≥50% infection); red dashed squares represent the minimal MOI, at which a EGFP signal was clearly visible, but not reaching 50% infection. The bars represent 400 µm.
Figure A3
Figure A3
SaCas9 cleavage efficiency in three cell lines determined by T7E1, visualized on an agarose gel. T7E1 assay showing percentage of NHEJ at the 12 FeLV target sites after transfection of CRFK, FEA, and PG-4 cells and sorting (A). Selected results showing SaCas9 cleavage efficiency at the Target 5 in CRFK, PG-4, and FEA cells (B) and Targets 6–12 in PG-4 cells (C) visualized after T7E1 cleavage on agarose gels. Red triangles indicate cleaved fragments.
Figure A4
Figure A4
Comparison of CRISPR/SaCas9 activity leading to indels after transduction. After CRISPR/SaCas9 transduction using the AAV-DJ vectors vT4 (Target 4, vKHH1), vT5 (Target 5, vKHH3), vT6 (Target 6, vKHH4), vT8 (Target 8, vKHH2), and vT10 (Target 10, vKHH5), frequency of indels (%) were compared using TIDE (A,D,G) and the T7E1 assays. T7E1 efficiency was determined by parallel capillary electrophoresis using a fragment analyzer (FA, graphs (B,E,H)) and band intensity comparison on an agarose gel (C,F,I). Transductions were performed on CRFK (AC), FEA (DF), and PG-4 cells (GI). Frequency of indels (%) was tested for significant differences by Kruskal–Wallis, one-way ANOVA by ranks (pKW as indicated), and subsequently by Dunn’s post-test: * = p < 0.05. The data are shown as scatter dot plots. The horizontal line represents the mean with SD.
Figure A5
Figure A5
Comparison of CRISPR/SaCas9 activity between cell lines. After CRISPR/SaCas9 transduction using the AAV-DJ vectors, the frequency of indels (%) was compared between the cell lines. Each raw corresponds to one Target: graphs (AC) to Target 4 (vKHH1); (DF) to Target 5 (vKHH3); (GI) to Target 6 (vKHH4); (JL) to Target 8 (vKHH2); and (MO) to Target 10 (vKHH5). The graphs (A,D,G,J,M) represent results determined by TIDE; (B,E,H,K,N) by T7E1 using the fragment analyzer (FA); (C,F,I,L,O) by T7E1 quantifying signal intensity on a gel. Frequency of indels (%) was tested for significant differences by Kruskal–Wallis, one-way ANOVA by ranks (pKW as indicated), and subsequently by Dunn’s post-test: * = p < 0.05. The data are shown as scatter dot plots. The horizontal line represents the mean with SD.
Figure 1
Figure 1
Schematic drawing of the outcomes of FeLV. In the course of FeLV infection, the virus/provirus load often corresponds to the disease outcome. Whereas during an abortive infection the cat’s immune response successfully eliminates viral proliferation (strong immune system: I), during progressive infection viral loads are constantly high (lack of effective FeLV-specific humoral and cellular immunity: i). During regressive infection, an effective immune response (marked with I) can control FeLV, often during the entire lifetime of the cat, thereby omitting FeLV-related disease and death. It is the goal of this study to develop the tools to shift the outcome of FeLV infection from progressive to regressive, with the help of a CRISPR/SaCas9 treatment that reduces the FeLV proviral loads in the cats’ cells and helps the immune system to overcome viremia.
Figure 2
Figure 2
Locations of the 12 FeLV sgRNAs (T1 to T12) in the FeLV-A/Glasgow-1 genome (GenBank: KP728112.1). The three genes, gag (group-specific antigen), pol (polymerase), and env (envelope) are flanked by the LTRs (long terminal repeats). Three target DNA sequences were chosen in gag (T4–T6), pol (T7–T9), env (T10–T12), and LTR (T1–T3), each marked with an arrow. The size of the genes and the LTRs is proportional to the genome size; arrows mark the location of the target, but their size is not to scale. Numbers below the schematic of the genome represent the beginning and end of the LTRs, as well as the beginning of each gene.
Figure 3
Figure 3
Fluorescent microscopy images of CRFK cells infected with 12 AAV serotypes after three days. Infection of nine natural AAV serotypes (AAV1-9), two AAV hybrid strains (AAV-DJ and AAV-DJ/8), and Anc80L65, all EGFP tagged from the upper left to the lower right, using a multiplicity of infection (MOI) between 100 and 10,000. From the left to the right of each column, the MOI consisted of 100, 500, 1000, 5000, and 10,000, always in duplicates (N = 2). Red squares mark the minimal MOI, at which a significant AAV infection could be visualized for each AAV serotype by fluorescence (corresponding to ≥ 50% infection). For AAV7, AAV8, AAV-DJ/8, and Anc80L65, no infection could be observed up to an MOI of 10,000. The bars represent 400 µm.
Figure 4
Figure 4
Quantification of the mean fluorescence signal intensity of cells infected with 12 AAV serotypes. (A) HEK (MOI of 10,000), (B) CRFK (MOI of 10,000), (C) FEA (MOI of 10,000), (D) PG-4 (MOI of 100,000), (E) AK-D (MOI of 100,000), (F) MT (MOI of 50,000), (G) Fc3Tg (MOI of 50,000), (H) Fcwf-4 (MOI of 10,000), and (I) Fet-J (MOI of 100,000) cells infected in duplicates (N = 2), with 12 AAV serotypes, all EGFP tagged. Mean signal intensity is shown for the highest MOI applied in the respective cell line, ranging from 10,000 to 100,000 on day 3. The signal strength ranges between 0 (black) and 255 (white).
Figure 5
Figure 5
Comparison of FeLV-A/Glasgow-1 infection in various feline cell lines. FeLV p27 antigen levels, as determined by ELISA, after three and seven days. The non-infectable M. dunni cell line was used as a negative control. * Due to the extremely high p27 levels in PG-4 cells, the value depicted only represents day three.
Figure 6
Figure 6
NHEJ frequency in CRFK, FEA, and PG-4 cells using CRISPR/SaCas9 editing for 12 FeLV targets and analyzed with the T7E1 and TIDE assay. After CRISPR/SaCas9 transfection and cell sorting, all 12 target regions within FeLV were amplified and analyzed using either the T7E1 assay measured by FA (A) or TIDE (B). Cleavage frequency, as determined by FA, was calculated into % NHEJ. Three cell lines (CRFK, FEA, and PG-4) are shown for each target and plotted against their % NHEJ (y-axes; % NHEJ = 100 × (1 − 1a+ba+b+c), with a and b being the cleaved DNA and c being the uncut DNA [51]). For target 11, there were not enough CRFK cells for cell sorting available.
Figure 7
Figure 7
Comparison of CRISPR/SaCas9 activity leading to indels after transduction. After CRISPR/SaCas9 transduction using the AAV-DJ vectors vT4 (Target 4, blue), vT5 (Target 5, yellow), vT6 (Target 6, red), vT8 (Target 8, green), and vT10 (Target 10, grey); NHEJ events were compared using TIDE and the T7E1 assays. T7E1 efficiency was determined by parallel capillary electrophoresis using a fragment analyzer (FA) and band intensity comparison on an agarose gel. Transductions were performed on CRFK, FEA, and PG-4 cells. Data represent the mean of three biological replicates ± standard deviation.
Figure 8
Figure 8
FeLV p27 antigen levels, after transduction in supernatant of CRFK (A), FEA (B), and PG-4 (C) cells. Comparison of FeLV p27 antigen levels after transduction with the AAV-DJ vector without target (v426), Target 4 (vT4), Target 5 (vT5), Target 6 (vT6), Target 8 (vT8), Target 10 (vT10), and non-transduced cells (negative). Since several individual experiments were compared, ultimate normalization of p27 values was performed to the p27 means of the non-transduced control cells (equaling 100%). FeLV p27 antigen levels were tested for significant differences by Kruskal–Wallis one-way ANOVA by ranks (pKW as indicated) and subsequently by Dunn’s post-test: * = p < 0.05; ** = p < 0.01; **** = p < 0.0001. The data are shown as box plots; the boxes extend from the 25th to 75th percentiles. The horizontal line represents the median, and the whiskers extend from the smallest to the largest value.

Similar articles

Cited by

References

    1. UNAIDS Global HIV & AIDS Statistics–2020 Fact Sheet. [(accessed on 2 June 2021)];2021 Available online: https://www.unaids.org/en/resources/fact-sheet.
    1. Ananworanich J., Dubé K., Chomont N. How does the timing of antiretroviral therapy initiation in acute infection affect HIV reservoirs? Curr. Opin. HIV AIDS. 2015;10:18–28. doi: 10.1097/COH.0000000000000122. - DOI - PMC - PubMed
    1. Studer N., Lutz H., Saegerman C., Gönczi E., Meli M.L., Boo G., Hartmann K., Hosie M.J., Moestl K., Tasker S., et al. Pan-European Study on the Prevalence of the Feline Leukaemia Virus Infection—Reported by the European Advisory Board on Cat Diseases (ABCD Europe) Viruses. 2019;11:993. doi: 10.3390/v11110993. - DOI - PMC - PubMed
    1. Willett B.J., Hosie M.J. Feline leukaemia virus: Half a century since its discovery. Vet. J. 2013;195:16–23. doi: 10.1016/j.tvjl.2012.07.004. - DOI - PubMed
    1. Jarrett W., Mackey L., Jarrett O., Laird H., Hood C. Antibody response and virus survival in cats vaccinated against feline leukaemia. Nat. Cell Biol. 1974;248:230–232. doi: 10.1038/248230a0. - DOI - PubMed

Publication types