. 2021 Aug 19;13(8):1648.
doi: 10.3390/v13081648.

SARS-CoV-2 Seroprevalence Structure of the Russian Population during the COVID-19 Pandemic

Affiliations

SARS-CoV-2 Seroprevalence Structure of the Russian Population during the COVID-19 Pandemic

Anna Y Popova et al. Viruses. .

Abstract

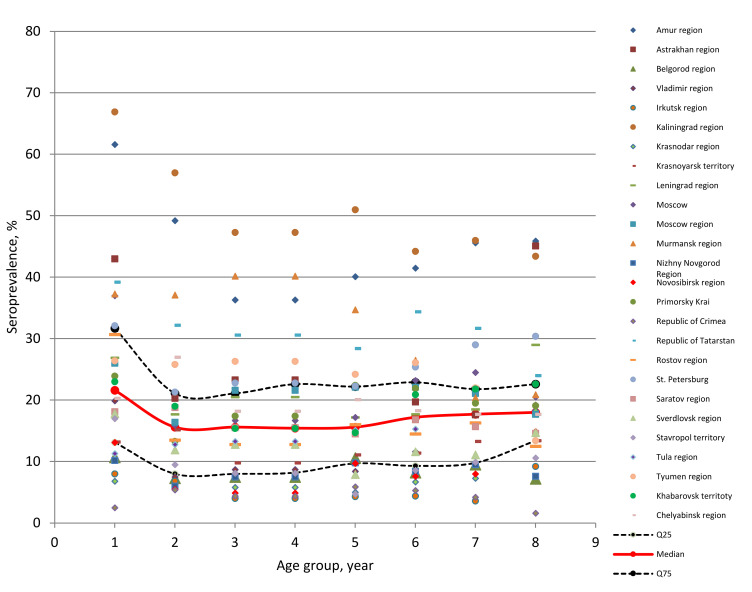
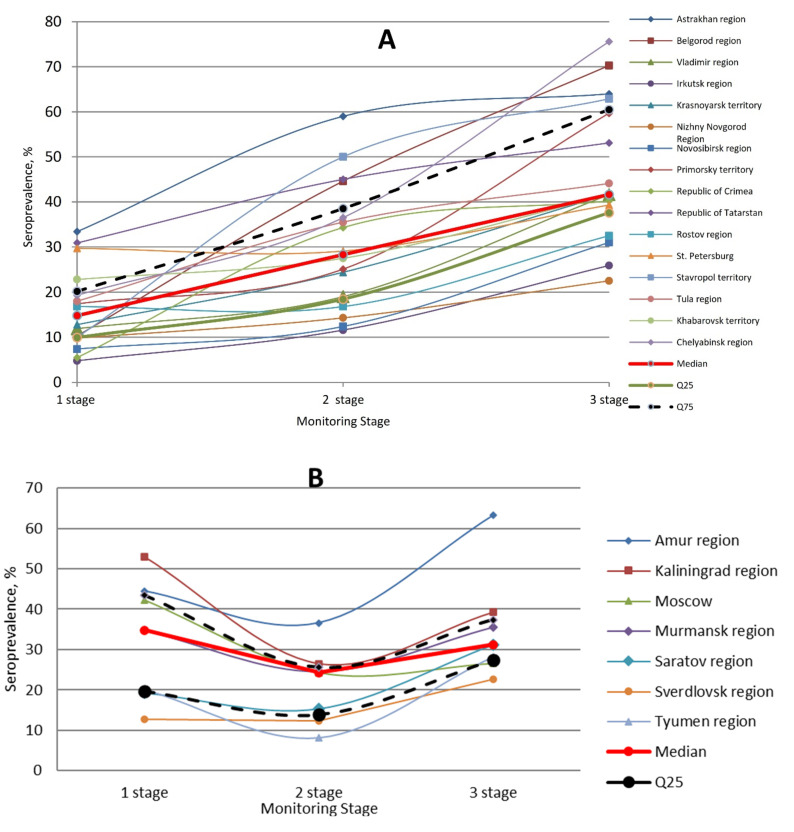
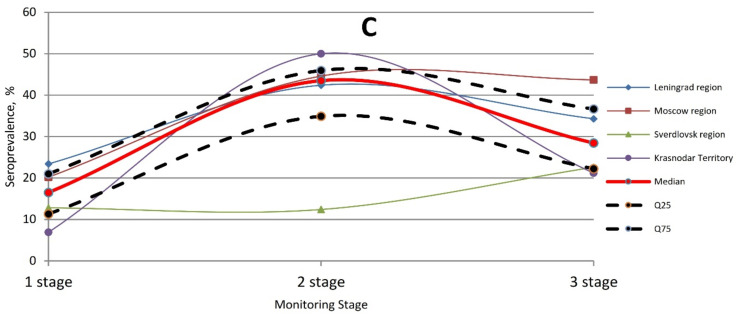
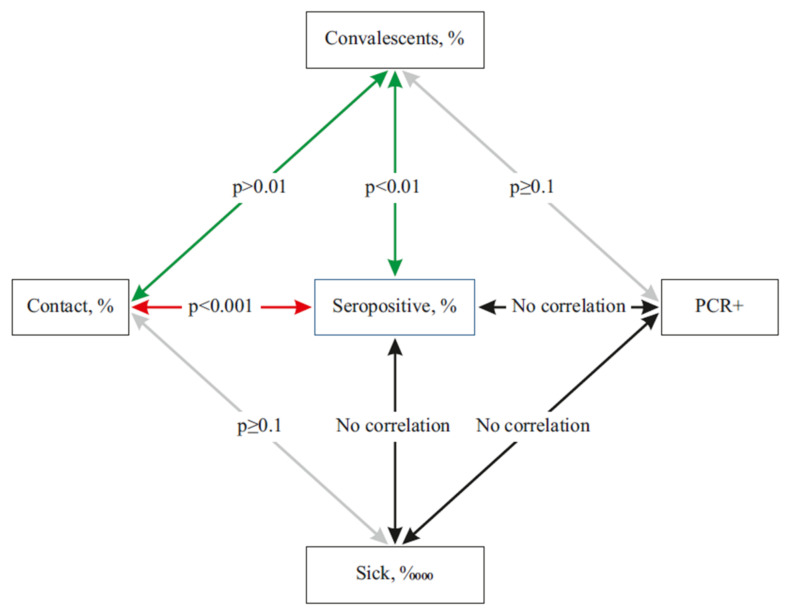
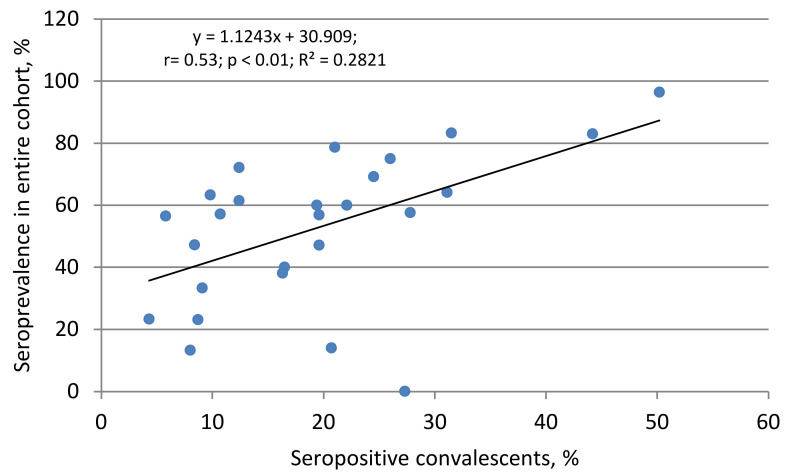
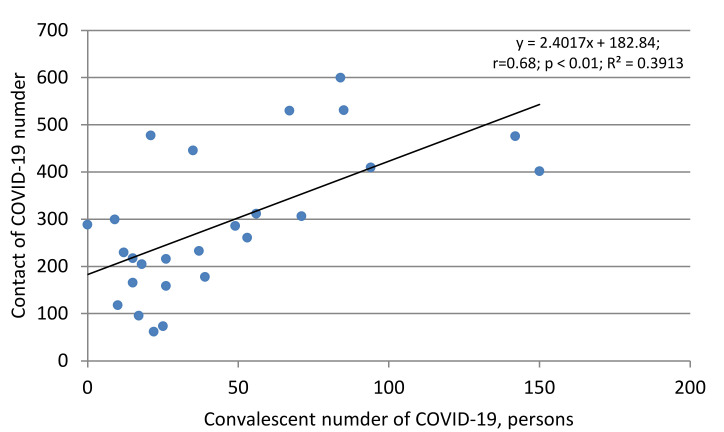
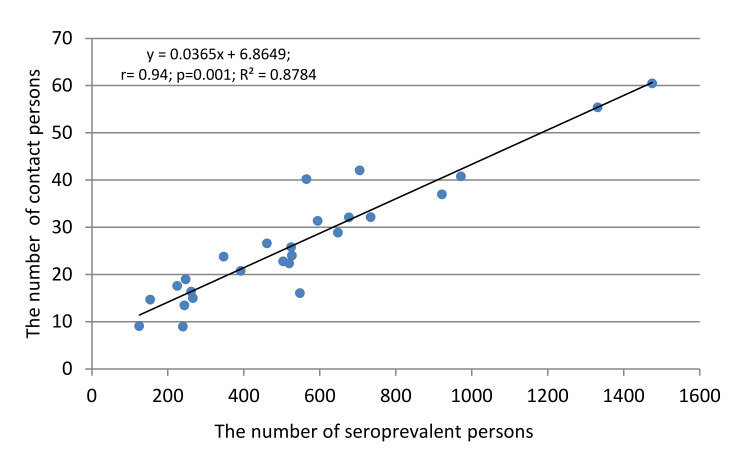
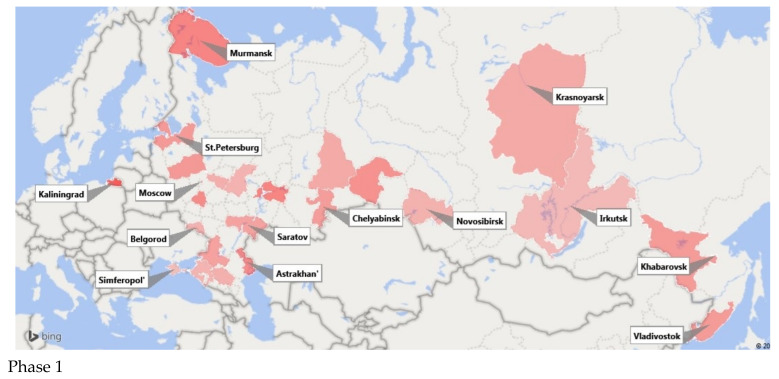
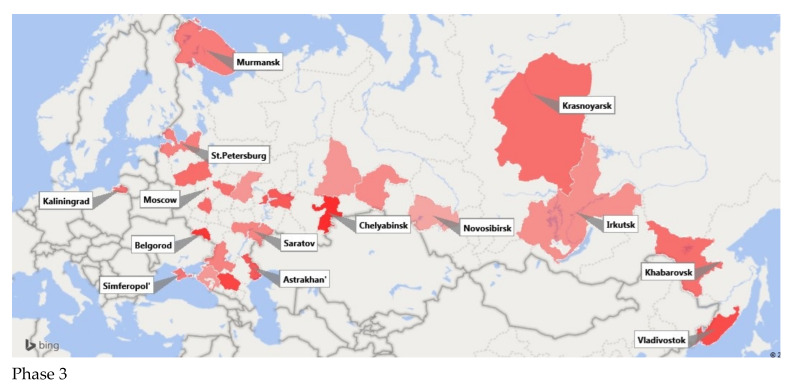
The SARS-CoV-2 pandemic, which came to Russia in March 2020, is accompanied by morbidity level changes and can be tracked using serological monitoring of a representative population sample from Federal Districts (FDs) and individual regions. In a longitudinal cohort study conducted in 26 model regions of Russia, distributed across all FDs, we investigated the distribution and cumulative proportions of individuals with antibodies (Abs) to the SARS-CoV-2 nucleocapsid antigen (Ag), in the period from June to December 2020, using a three-phase monitoring process. In addition, during the formation of the cohort of volunteers, the number of seropositive convalescents, persons who had contact with patients or COVID-19 convalescents, and the prevalence of asymptomatic forms of infection among seropositive volunteers were determined. According to a uniform methodology, 3 mL of blood was taken from the examined individuals, and plasma was separated, from which the presence of Abs to nucleocapsid Ag was determined on a Thermo Scientific Multiascan FC device using the "ELISA anti-SARS-CoV-2 IgG" reagent set (prod. Scientific Center for Applied Microbiology and Biotechnology), in accordance with the developer's instructions. Volunteers (74,158) were surveyed and divided into seven age groups (1-17, 18-29, 30-39, 40-49, 59-59, 60-69, and 70+ years old), among whom 14,275 were identified as having antibodies to SARS-CoV-2. The average percent seropositive in Russia was 17.8% (IQR: 8.8-23.2). The largest proportion was found among children under 17 years old (21.6% (IQR: 13.1-31.7). In the remaining groups, seroprevalence ranged from 15.6% (IQR: 8-21.1) to 18.0% (IQR: 13.4-22.6). During monitoring, three (immune) response groups were found: (A) groups with a continuous increase in the proportion of seropositive; (B) those with a slow rate of increase in seroprevalence; and (C) those with a two-phase curve, wherein the initial increase was replaced by a decrease in the percentage of seropositive individuals. A significant correlation was revealed between the number of COVID-19 convalescents and contact persons, and between the number of contacts and healthy seropositive volunteers. Among the seropositive volunteers, more than 93.6% (IQR: 87.1-94.9) were asymptomatic. The results show that the COVID-19 pandemic is accompanied by an increase in seroprevalence, which may be important for the formation of herd immunity.

Keywords: COVID-19; Russia; SARS-CoV-2; asymptomatic form; herd immunity; population.


Conflict of interest statement

The authors declare no conflict of interest.

Figures

Figure 1
Figure 1
Correlation between geographical latitude of region and percent seroprevalence. The equation, regressions, correlation coefficient (r), statistical significance level (p), and determination coefficient (R2) are shown. Geographic latitude is given for the center of the region.
Figure 2
Figure 2
Distribution of seropositive volunteer proportions in the child cohort (blue curve) and adult cohort (red curve). The vertical axis is the percent seroprevalence (SARS-CoV-2).
Figure 3
Figure 3
Correlation relationship between seroprevalence in children and adults. The regression equation, Spearman correlation coefficient (r), reliability of statistical relationship (p), and the coefficient of determination R2 are shown.
Figure 4
Figure 4
Distribution of volunteer seroprevalence by region and age. Solid curves correspond to: Me (median); Q25 (bottom); and Q75 (top). Dots indicate volunteer seropositivity values in 26 model regions (legend), distributed over 7 age groups.
Figure 5
Figure 5
Three curve types for the formation of population immunity to SARS-CoV-2 in different Russian regions. (A). The most common dynamics of formation of specific SARS-CoV-2 immunity. In the process of population contact with coronavirus, the proportion of seropositive individuals in the population increases, reaching a maximum by the 3rd phase. (B). Less frequent curve showing a slower process of seropositivity formation. By the 2nd phase, the percent of the Nc Ab seropositivity volunteers decreased. The maximum Ab level is formed only by the 3rd phase. (C). The rarest paradoxical reaction in which percent seropositive increases between phases 1 and 2, and then decreases markedly. Immunity formation dynamics in the surveyed regions are shown by thin colored lines. The median is represented by a thicker red curve. The boundaries of the interquartile range Q25—Q75 are plotted as bold, dashed lines.
Figure 5
Figure 5
Three curve types for the formation of population immunity to SARS-CoV-2 in different Russian regions. (A). The most common dynamics of formation of specific SARS-CoV-2 immunity. In the process of population contact with coronavirus, the proportion of seropositive individuals in the population increases, reaching a maximum by the 3rd phase. (B). Less frequent curve showing a slower process of seropositivity formation. By the 2nd phase, the percent of the Nc Ab seropositivity volunteers decreased. The maximum Ab level is formed only by the 3rd phase. (C). The rarest paradoxical reaction in which percent seropositive increases between phases 1 and 2, and then decreases markedly. Immunity formation dynamics in the surveyed regions are shown by thin colored lines. The median is represented by a thicker red curve. The boundaries of the interquartile range Q25—Q75 are plotted as bold, dashed lines.
Figure 6
Figure 6
Spearman correlations between COVID-19 patient states. The diagram contains five main patient conditions, which describe basic features of the interaction between the coronavirus and a susceptible host. Key: seroprevalence—the proportion of seropositive individuals in the population according to ELISA data; patients—infected with SARS-CoV-2 based on PCR results and, as a rule, having clinical manifestations of COVID-19; convalescents—patients who have recovered from COVID-19, based on PCR results; contact—persons who have had verified contact with a COVID-19 patient; PCR+—persons with a positive PCR test result without any other clinical manifestations. Colored lines mark reliable correlations between the indicators. Weak correlations are marked with gray lines; black lines indicate an absence of correlation. Reliability of relationship values (p) are shown on the arrows.
Figure 7
Figure 7
Correlation between seropositivity in the cohort as a whole and the proportion of seropositive among convalescents. The equation, regression, Spearman correlation coefficient (r), the reliability of relationship (p), and the coefficient of determination are given.
Figure 8
Figure 8
Correlation between the number of convalescents and COVID-19 contacts. The equation, regression, correlation coefficient value (r), reliability relation (p), and the coefficient of determination (R2) are shown.
Figure 9
Figure 9
Correlation between the number of seropositive and COVID-19 contacts. The equation, regression, correlation coefficient value (r), the reliability of the relationship (p), and the coefficient of determination (R2) are shown.
Figure 10
Figure 10
Color intensity representation of SARS-CoV-2 seroprevalence, Russian population, 2020. Phase 1—Seroprevalence levels in the first phase of monitoring (June–August). Phase 3—levels in the third phase (December). Color intensity reflects the percent seropositive: the more intense the color, the higher the level of population immunity.
Figure 10
Figure 10
Color intensity representation of SARS-CoV-2 seroprevalence, Russian population, 2020. Phase 1—Seroprevalence levels in the first phase of monitoring (June–August). Phase 3—levels in the third phase (December). Color intensity reflects the percent seropositive: the more intense the color, the higher the level of population immunity.

Similar articles

Cited by

References

    1. Smirnov V.S., Zarubaev V.V., Petlenko S.V. Biology of Pathogens and Control. of Ibfluenza and Acute Respiratory Viral Infections. Hyppokrates Publishing; Saint-Petersburg, Russia: 2020. p. 336.
    1. Perico L., Benigni A., Casiraghi F., Ng L.F.P., Renia L., Remuzzi G. Immunity, endothelial injury and complement-induced coagulopathy in COVID-19. Nat. Rev. Nephrol. 2020;17:46–64. doi: 10.1038/s41581-020-00357-4. - DOI - PMC - PubMed
    1. Uversky V.N., Elrashdy F., Aljadawi A., Ali S.M., Khan R.H., Redwan E.M. Severe acute respiratory syndrome coronavirus 2 infection reaches the human nervous system: How? J. Neurosci. Res. 2020;99:750–777. doi: 10.1002/jnr.24752. - DOI - PMC - PubMed
    1. Bernard I., Limonta D., Mahal L.K., Hobman T.C. Endothelium Infection and Dysregulation by SARS-CoV-2: Evidence and Caveats in COVID-19. Viruses. 2021;13:29. doi: 10.3390/v13010029. - DOI - PMC - PubMed
    1. Pujari R., Thommana M.V., Mercedes B.R., Serwat A. Therapeutic Options for COVID-19: A Review. Cureus. 2020;12:e10480. doi: 10.7759/cureus.10480. - DOI - PMC - PubMed

MeSH terms