. 2021 Aug 20;13(8):1653.
doi: 10.3390/v13081653.

The Microvillar and Solitary Chemosensory Cells as the Novel Targets of Infection of SARS-CoV-2 in Syrian Golden Hamsters

Affiliations

The Microvillar and Solitary Chemosensory Cells as the Novel Targets of Infection of SARS-CoV-2 in Syrian Golden Hamsters

Jin-Seok Seo et al. Viruses. .

Abstract

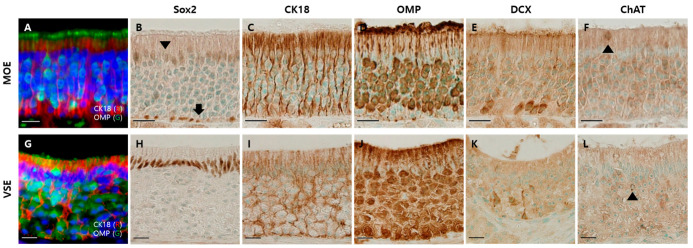
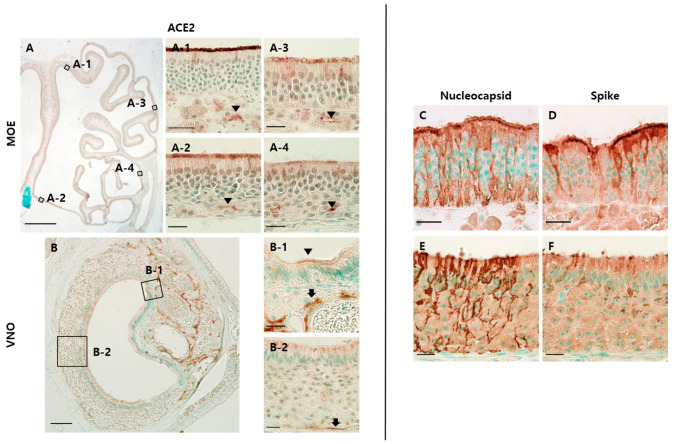
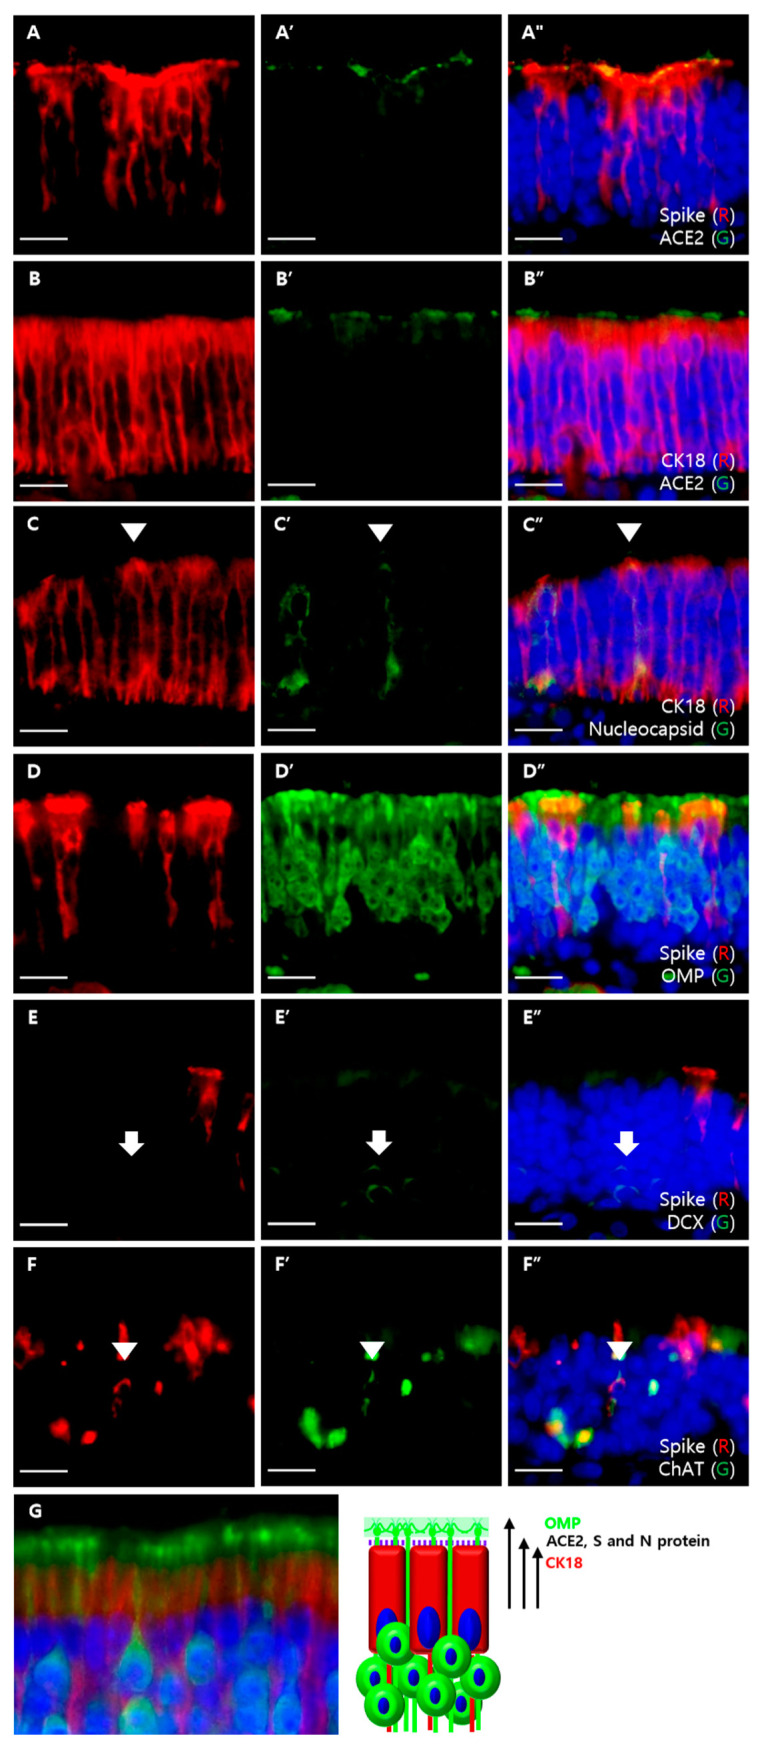
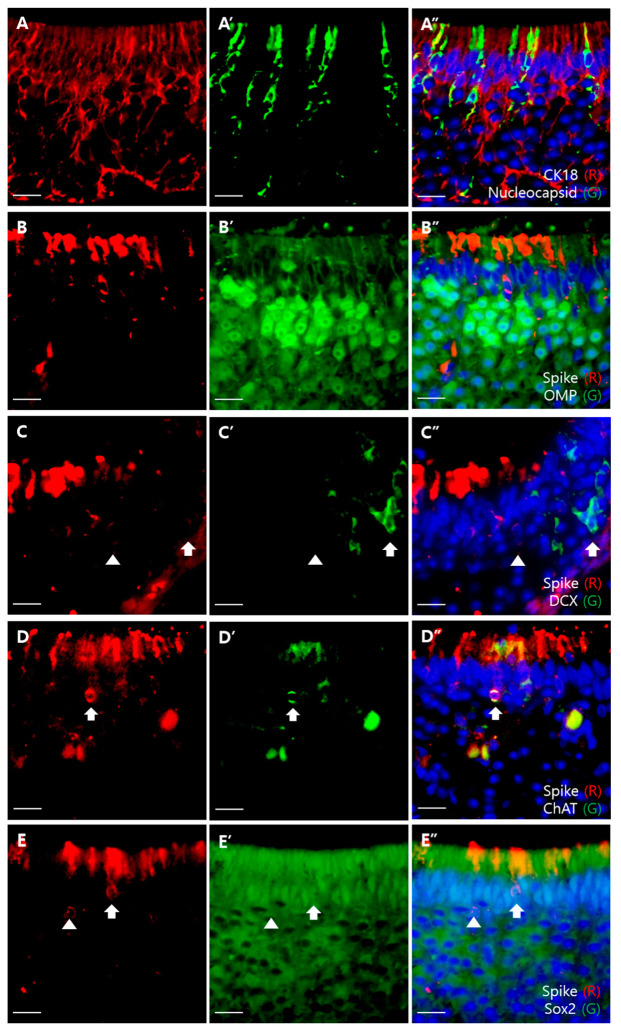
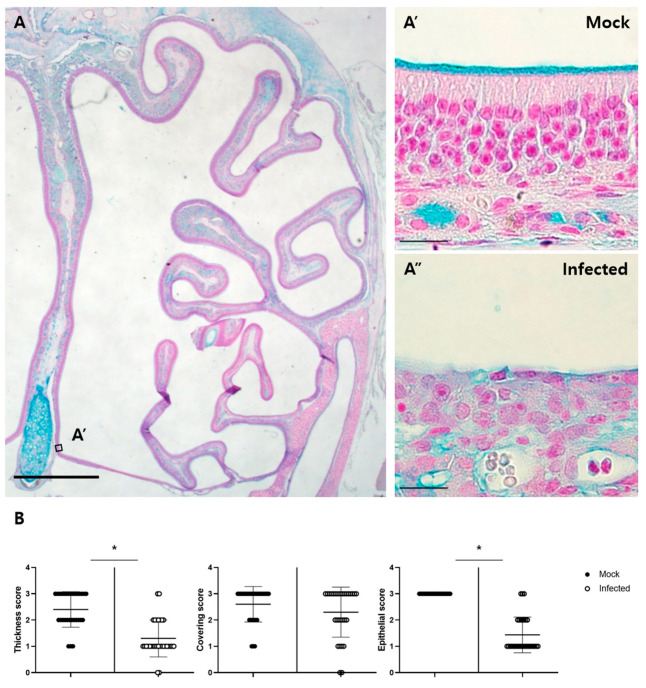
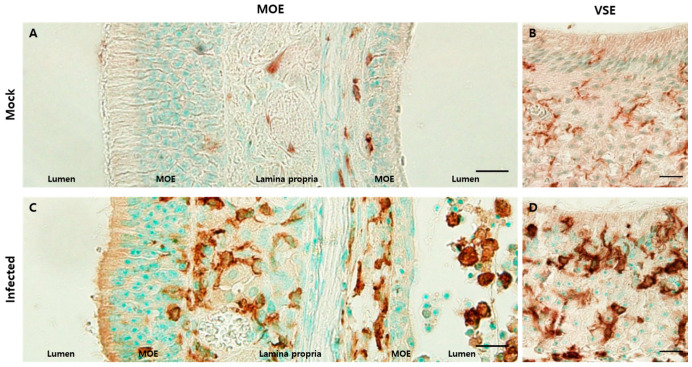
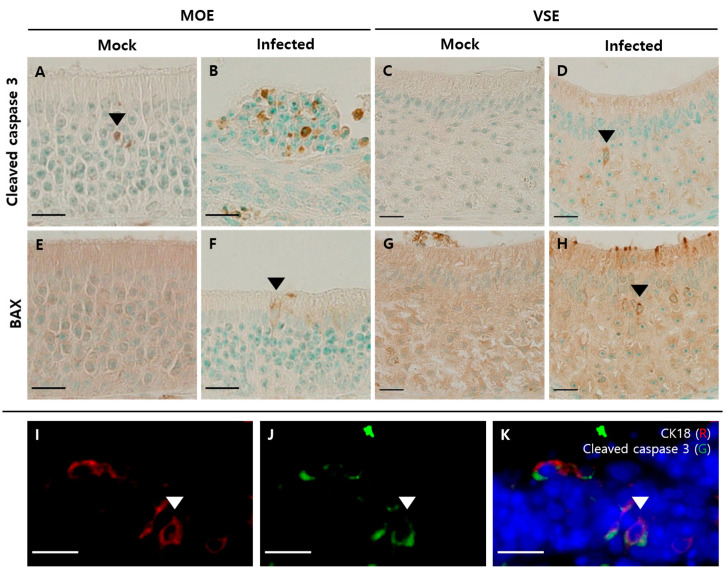
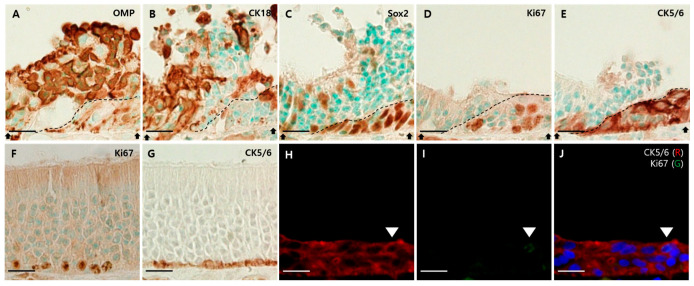
Patients infected with severe acute respiratory syndrome coronavirus 2 (SARS-CoV-2), the causative agent of coronavirus disease 2019, suffer from respiratory and non-respiratory symptoms. Among these symptoms, the loss of smell has attracted considerable attention. The objectives of this study were to determine which cells are infected, what happens in the olfactory system after viral infection, and how these pathologic changes contribute to olfactory loss. For this purpose, Syrian golden hamsters were used. First, we verified the olfactory structures in the nasal cavity of Syrian golden hamsters, namely the main olfactory epithelium, the vomeronasal organ, and their cellular components. Second, we found angiotensin-converting enzyme 2 expression, a receptor protein of SARS-CoV-2, in both structures and infections of supporting, microvillar, and solitary chemosensory cells. Third, we observed pathological changes in the infected epithelium, including reduced thickness of the mucus layer, detached epithelia, indistinct layers of epithelia, infiltration of inflammatory cells, and apoptotic cells in the overall layers. We concluded that a structurally and functionally altered microenvironment influences olfactory function. We observed the regeneration of the damaged epithelium, and found multilayers of basal cells, indicating that they were activated and proliferating to reconstitute the injured epithelium.

Keywords: SARS-CoV-2; microvillar cell; olfactory system; regeneration; solitary chemosensory cell.


Conflict of interest statement

The authors declare no conflict of interest. The funders had no role in the design of the study; in the collection, analyses, or interpretation of data; in the writing of the manuscript, or in the decision to publish the results.

Figures

Figure 1
Figure 1
Olfactory system in the nasal cavity of the hamsters. Scale bars = 20 µm. (A) Double immunofluorescent labeling of OMP and CK18 in the main olfactory epithelium (MOE), which are markers for mature olfactory sensory neurons (mOSNs) and supporting cells (SCs), respectively; (B) DAB staining with the antibody to Sox2 in MOE: nuclei of SCs (arrowhead) and basal cells (BCs, arrow); (C) DAB staining with the antibody to CK18 in MOE: cytoplasm and feet of SCs; (D) DAB staining with the antibody to OMP in MOE: mOSNs; (E) DAB staining with DCX antibody in MOE: immature olfactory sensory neurons; (F) DAB staining with the antibody to ChAT in MOE: microvillar cells (arrowhead); (G) double immunofluorescent labeling of OMP and CK18 in vomeronasal sensory epithelium (VSE); (H) DAB staining with the antibody to Sox2 in VSE: nuclei of SCs; (I) DAB staining with the antibody to CK18 in VSE: cytoplasm and feet of SCs; (J) DAB staining with OMP antibody in VSE: mature vomeronasal sensory neurons; (K) DAB staining with DCX antibody in VSE: immature vomeronasal sensory neurons; (L) DAB staining with ChAT antibody in VSE: solitary chemosensory cells (arrowhead).
Figure 2
Figure 2
SARS-CoV-2 infections in the olfactory system. The scale bar in (A) is 1 mm, in (D) is 100 μm, and in all others is 20 μm. (A) DAB staining with the antibody to ACE2 in dorsomedial (A-1), ventromedial (A-2), dorsolateral (A-3), and ventrolateral (A-4) MOE of the mock group: ACE2 was expressed on the apical surface of the epithelium and luminal surface of Bowman’s glands (arrowhead). In the lateral region, ACE2 expression on the apical surface becomes weak and sparse; (B) DAB staining with the antibody to ACE2 in the non-sensory epithelium (NSE) and VSE: ACE2 was expressed on some of the apical surface of NSE and cavernous tissues (B-1). ACE2 expression was also observed in the apical portion of the VSE, intraepithelial capillaries, and blood vessel walls just below the epithelium (B-2); (C,D) DAB staining with the antibody to nucleocapsid (N) and spike (S) protein in the MOE of the infected group. Both N and S protein were expressed on the epithelial cells spanning the whole layer of the MOE; (E,F) DAB staining with the antibody to N and S protein in VSE. N protein was expressed on the whole height of the VSE, whereas S protein was expressed on the perinuclear region and apical portion of the VSE.
Figure 3
Figure 3
Double immunofluorescent labeling of MOE. All sections were counterstained with DAPI (blue). Scale bars = 20 μm. (A) Colocalization of the S protein (red) and ACE2 (green). The apical portion of the S protein and ACE2 had similar levels; (B) colocalization of CK18 (red) and ACE2 (green). The apical portions of CK18-positive cells were located lower than the levels of ACE2 expression; (C) colocalization of CK18 (red) and N proteins (green). Some CK18-positive cells were colocalized with the N protein (arrowhead); (D) colocalization of the S protein (red) and OMP (green). There was no colocalization between the S protein and OMP. Apical portions of S protein-positive cells were lower than apical portions of OMP-positive cells; (E) colocalization of the S protein (red) and DCX (green). There was no colocalization between the S protein and DCX (arrow); (F) colocalization of the S protein (red) and ChAT (green). Some ChAT-positive cells were colocalized with the S protein (arrowhead); (G) cropped images from Figure 1A that label CK18-positive SCs (red) and OMP-positive mOSNs (green), which are shown on the left, and a schematic diagram of ACE2-expressing cells is shown on the right. Using the modified sandwich method, we conclude that ACE2 is expressed on the cell membrane of SCs, which is not labeled by CK18 and is below the densely labeled OMP-positive dendritic knob.
Figure 4
Figure 4
Double immunofluorescent labeling of the VSE. Scale bars = 20 μm. (A) Colocalization of CK18 (red) and nucleocapsid (green). Some CK18-positive cells colocalized with N protein; (B) colocalization of the S protein (red) and OMP (green). There was no colocalization between the S protein and OMP; (C) colocalization of the S protein (red) and DCX (green). There was no colocalization between the S protein and DCX; (D) colocalization of the S protein (red) and ChAT (green) The ChAT-positive cell was colocalized with the S protein; (E) colocalization of the S protein (red) and Sox2 (green). The S protein-positive cells encircle Sox2-positive nuclei (arrow), but there are also S protein-positive cells encircling the Sox2-negative nuclei (arrowhead).
Figure 5
Figure 5
Pathologic changes in the MOE. (A) AB-PAS staining in the MOE of the mock group. A’ and A” are representative images cropped from the same region of the mock and infected groups, respectively. Alcian blue-positive mucus materials are seen on the luminal surface of the MOE and Bowman’s glands. The scale bar in (A) is 1 mm, and the scale bars in the cropped images are 20 µm; (B) histopathological scoring of thickness, mucus covering, and epithelial damage. The scores for mucus thickness and epithelial damage were significantly different between the mock and infected groups (* p < 0.05, Mann–Whitney U test, n = 4).
Figure 6
Figure 6
Inflammatory cells infiltrated olfactory structures. Scale bars = 20 µm. (A) DAB staining with the antibody against Iba1 in the MOE of the mock group. Iba1-positive cells were mostly present in the lamina propria and some were adjacent to the basal lamina; (B) DAB staining with the antibody to Iba1 in the VSE of the mock group. Iba1-positive cells showed their processes, which meant that they were in a resting state; (C) DAB staining with the antibody against Iba1 in the MOE of the infected group. There were increased Iba1-positive cell levels. These cells were located in the lamina propria, a relatively superficial portion of the epithelia, and the lumen; (D) DAB staining with the antibody to Iba1 in the VSE of the infected group. Many Iba1-positive cells were amoeboid in shape and more densely stained. They were in an active state.
Figure 7
Figure 7
Apoptosis in the olfactory system. Scale bars = 20 µm. (A) DAB staining with the antibody against cleaved caspase 3 in the MOE of the mock group. Few cleaved caspase 3-positive cells were observed in the intermediate region of the MOE; (B) DAB staining with the antibody against cleaved caspase 3 in the MOE of the infected group. Increased cleaved caspase 3-positive cells were present in various layers of the MOE and cell debris; (C) DAB staining with the antibody against cleaved caspase 3 in the VSE of the mock group. There were few cleaved caspase 3-positive cells; (D) DAB staining with the antibody against cleaved caspase 3 in the VSE of the infected group. The nuclei of cleaved caspase 3-positive cells appeared as the nuclei of SCs; (E) DAB staining with BAX antibody in the MOE of the mock group. There were few BAX-positive cells in the MOE; (F) DAB staining with the antibody against BAX in the MOE of the infected group. The nucleus of BAX-positive cells was in the apical layer and resembled the nuclei of SCs; (G) DAB staining with the antibody against BAX in the VSE of the mock group. There were few BAX-positive cells in the VSE; (H) DAB staining with the BAX antibody in the VSE of the infected group. The nucleus of BAX-positive cells was in the apical layer and resembled the nuclei of SCs. (IK) Double immunofluorescence with the antibody against CK18 (red) and cleaved caspase 3 (green) in the MOE of the infected group. Sections were counterstained with DAPI (blue). Some CK18-positive cells colocalized with cleaved caspase 3.
Figure 8
Figure 8
Regeneration of the MOE after viral infection. Scale bars = 20 µm. (A) DAB staining with the antibody against OMP in the MOE of the infected group. OMP-positive cells are abundant in the damaged epithelium, but rare in the regenerating epithelium; (B) DAB staining with the antibody against CK18 in the MOE of the infected group. CK18-positive cells were abundant in the damaged epithelium, but rare in the regenerating epithelium; (C) DAB staining with the antibody against Sox2 in the MOE of the infected group. Sox2-positive cells were in the apical and basal layers of the damaged epithelium. In the regenerating epithelium, Sox2-positive cells formed multilayers; (D) DAB staining with the antibody against Ki67 in the MOE of the infected group. Ki67-positive cells formed multilayers in the regenerating epithelium; (E) DAB staining with the antibody against CK5/6 in the MOE of the infected group. CK5/6-positive cells formed multilayers in the regenerating epithelium; (F) DAB staining with the antibody against Ki67 in the MOE of the mock group. Ki67-positive cells were present in the basal layer of the MOE; (G) DAB staining with the antibody against CK5/6 in the MOE of the mock group. CK5/6-positive cells were present in the basal layer of the MOE. They formed a single layer. (HJ) Double immunofluorescence with antibodies against CK5/6 (red) and Ki67 (green). Sections were counterstained with DAPI (blue). In the superficial layer of the multilayer formed by CK5/6, both CK5/6- and Ki67-positive cells were observed.

Similar articles

Cited by

References

    1. Centers for Disease Control and Prevention, Symptom of Coronavirus. [(accessed on 22 February 2021)]; Available online: http://www.cdc.gov/coronavirus/2019-ncov/symptoms-testing/symptoms.html.
    1. Kaye R., Chang C.D., Kazahaya K., Brereton J., Denneny J.C., III COVID-19 anosmia reporting tool: Initial findings. Otolaryngol. Head Neck Surg. 2020;163:132–134. doi: 10.1177/0194599820922992. - DOI - PubMed
    1. Menni C., Valdes A.M., Freidin M.B., Sudre C., Nguyen L.H., Drew D.A., Ganesh S., Varsavsky T., Cardoso M.J., Moustafa J.S.E.-S., et al. Real-time tracking of self-reported symptoms to predict potential COVID-19. Nat. Med. 2020;26:1037–1040. doi: 10.1038/s41591-020-0916-2. - DOI - PMC - PubMed
    1. Moein S.T., Hashemian S.M., Mansourafshar B., Khorram-Tousi A., Tabarsi P., Doty R.L. Smell dys-function: A biomarker for COVID-19. Int. Forum Allergy Rhinol. Otolaryngol. Head Neck Surg. 2020;10:944–950. doi: 10.1002/alr.22587. - DOI - PMC - PubMed
    1. Whitcroft K.L., Hummel T. Olfactory dysfunction in COVID-19: Diagnosis and management. JAMA. 2020;323:2512–2514. doi: 10.1001/jama.2020.8391. - DOI - PubMed

Publication types

MeSH terms

Substances