. 2021 Aug 23;13(8):1673.
doi: 10.3390/v13081673.

The Post-Acute Phase of SARS-CoV-2 Infection in Two Macaque Species Is Associated with Signs of Ongoing Virus Replication and Pathology in Pulmonary and Extrapulmonary Tissues

Affiliations

The Post-Acute Phase of SARS-CoV-2 Infection in Two Macaque Species Is Associated with Signs of Ongoing Virus Replication and Pathology in Pulmonary and Extrapulmonary Tissues

Kinga P Böszörményi et al. Viruses. .

Abstract

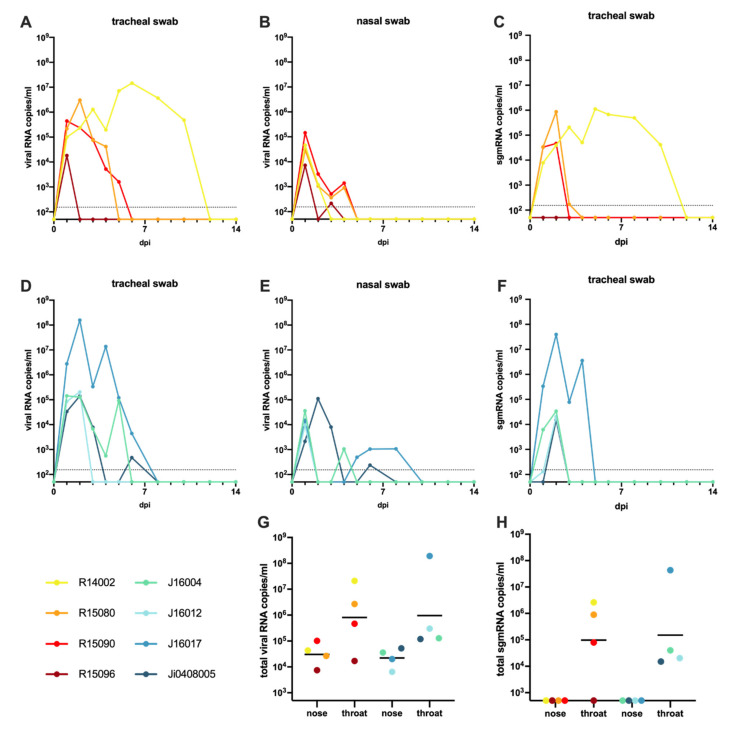
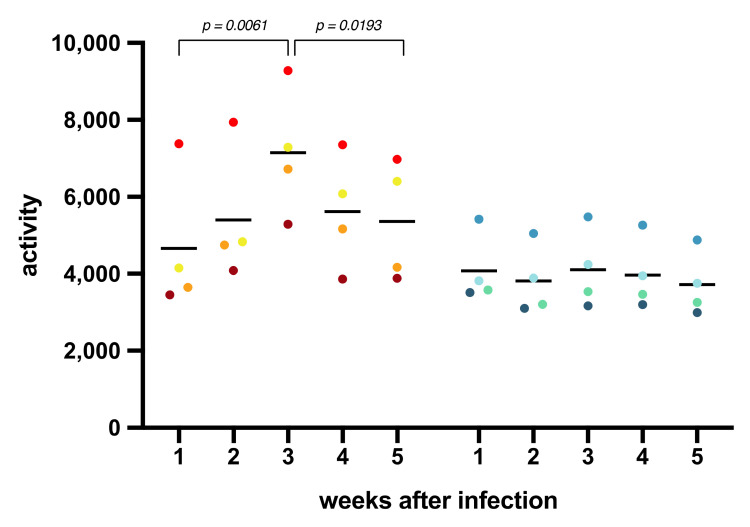
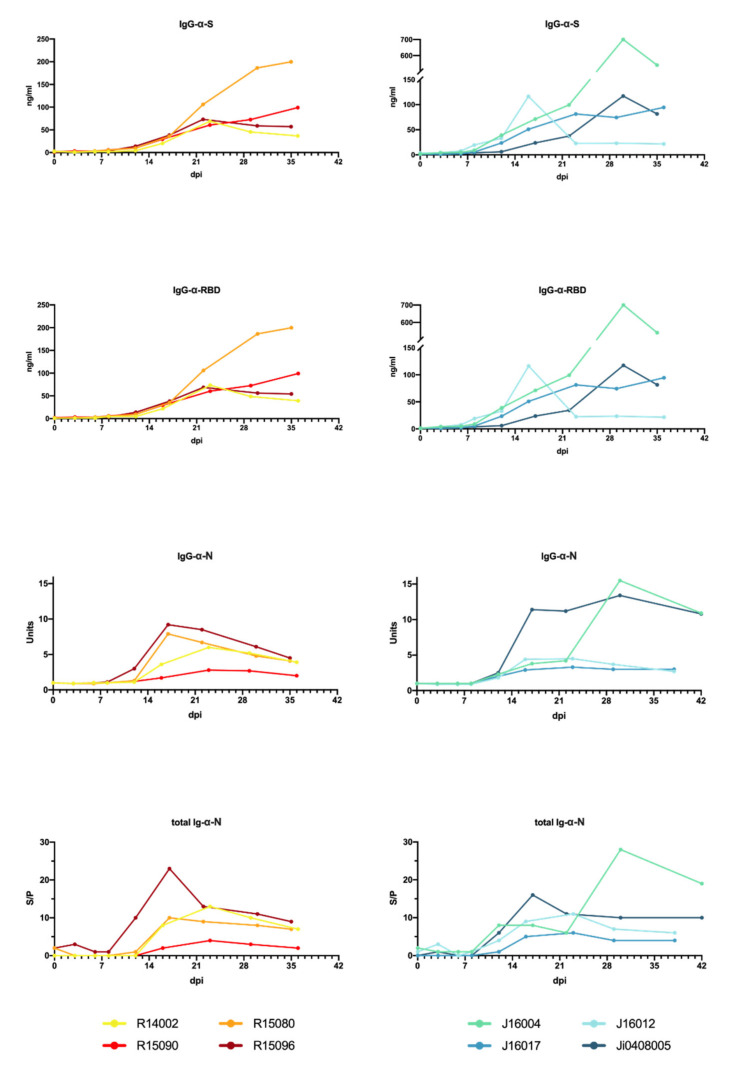
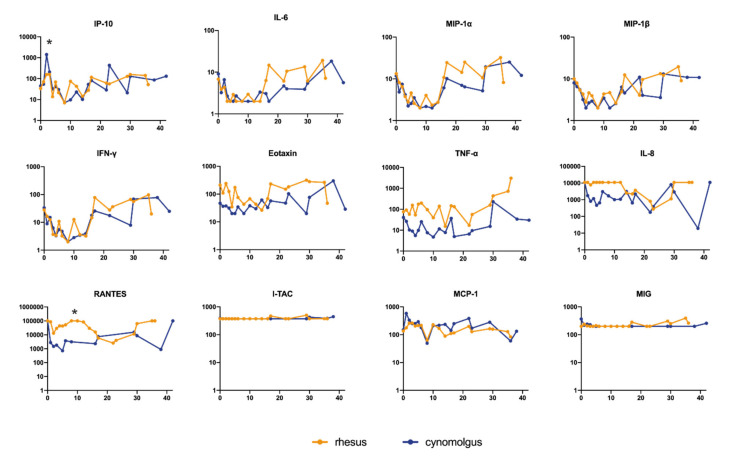
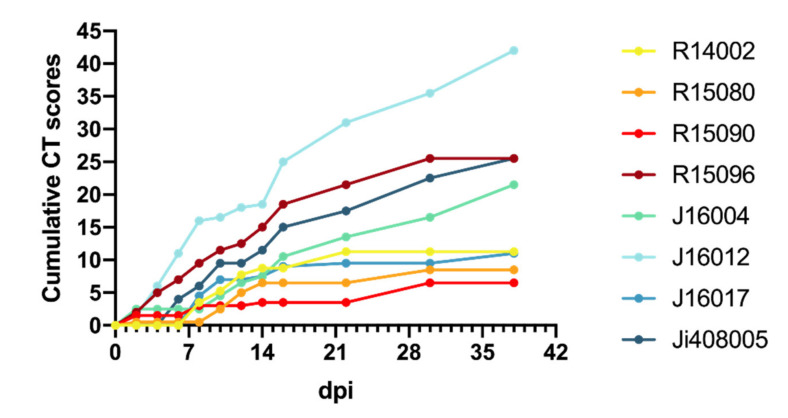
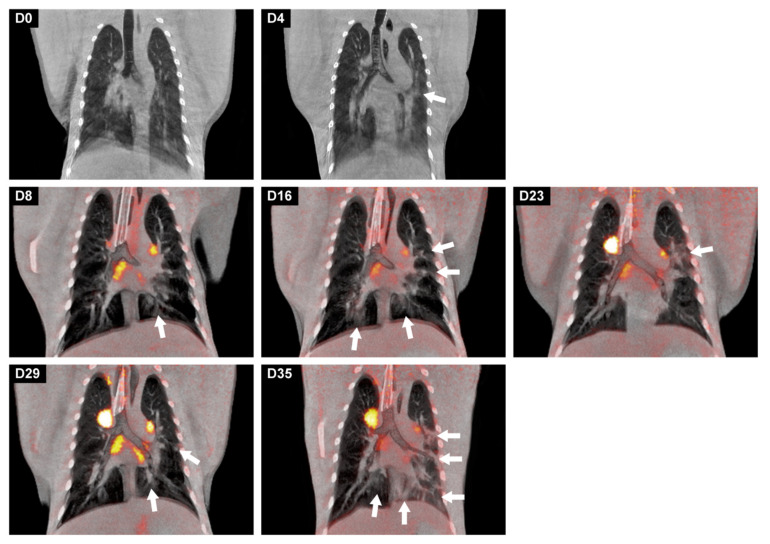
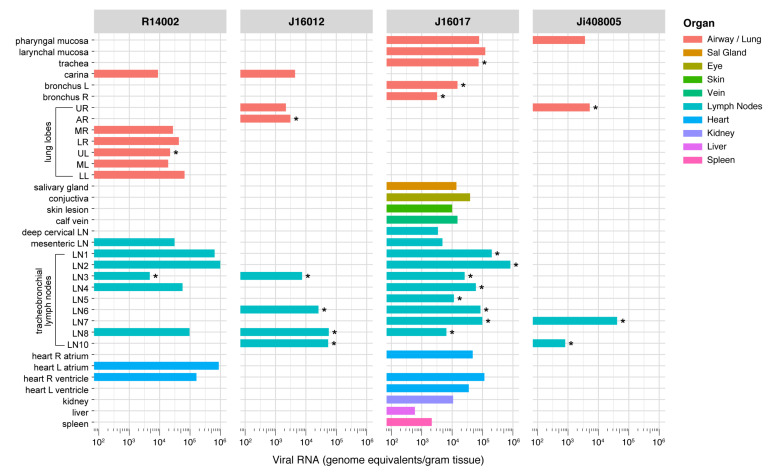
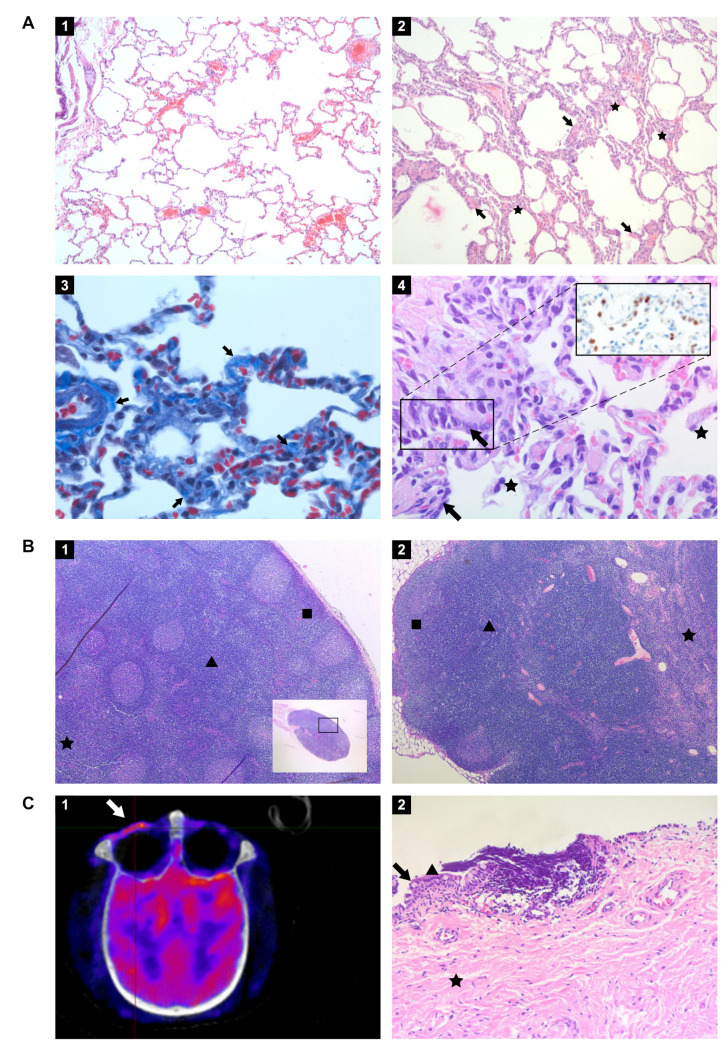
The post-acute phase of SARS-CoV-2 infection was investigated in rhesus (Macaca mulatta) and cynomolgus macaques (Macaca fascicularis). During the acute phase of infection, SARS-CoV-2 was shed via the nose and throat, and viral RNA was occasionally detected in feces. This phase coincided with a transient change in systemic immune activation. Even after the alleged resolution of the infection, computed tomography (CT) and positron emission tomography (PET)-CT revealed pulmonary lesions and activated tracheobronchial lymph nodes in all animals. Post-mortem histological examination of the lung tissue revealed mostly marginal or resolving minimal lesions that were indicative of SARS-CoV-2 infection. Evidence for SARS-CoV-2-induced histopathology was also found in extrapulmonary tissue samples, such as conjunctiva, cervical, and mesenteric lymph nodes. However, 5-6 weeks after SARS-CoV-2 exposure, upon necropsy, viral RNA was still detectable in a wide range of tissue samples in 50% of the macaques and included amongst others the heart, the respiratory tract and surrounding lymph nodes, salivary gland, and conjunctiva. Subgenomic messenger RNA was detected in the lungs and tracheobronchial lymph nodes, indicative of ongoing virus replication during the post-acute phase. These results could be relevant for understanding the long-term consequences of COVID-19 in humans.

Keywords: COVID-19; NHPs; SARS-CoV-2; animal models; non-human primates.


Conflict of interest statement

The authors declare no conflict of interest.

Figures

Figure 1
Figure 1
Virus loads in swab samples of macaques following SARS-CoV-2 infection. Viral RNA and subgenomic messenger RNA quantification in tracheal and nasal swabs of rhesus and cynomolgus macaques by qRT-PCR. The limit of quantification is indicated by the dotted horizontal line. Swabs after 14 dpi were all negative in PCR analysis and are therefore not shown for improved clarity. Viral RNA levels in tracheal (A) and nasal swabs (B), and sgmRNA levels in tracheal swabs (C) of rhesus macaques. Viral RNA levels in tracheal (D) and nasal swabs (E), and sgmRNA levels in trachea swabs (F) of cynomolgus macaques. The limit of quantification is indicated by the dotted horizontal line. Total virus loads (G) and sgmRNA loads (H) in throat and nose samples of macaques throughout the study. Horizontal bars represent geometric means. The sum of the viral copies was calculated rather than the area under the curve (AUC), as AUC interpolates for time points when virus loads were not determined. The color coding used for each individual animal as shown in the figure is used throughout the manuscript to denote the same individual. Rhesus macaques are indicated by yellow to red colors; cynomolgus macaques by green to blue colors.
Figure 2
Figure 2
Cumulative activity scores. The activity of the animals was measured by telemetry throughout the study. The cumulative activity scores for rhesus and cynomolgus macaques were calculated as the area under the curve (AUC) per week. Measurements done during biotechnical handlings were omitted from the calculations.
Figure 3
Figure 3
Development of a SARS-CoV-2 antibody response in rhesus and cynomolgus macaques. The humoral immune response was determined using an anti-S IgG ELISA, an anti-RBD ELISA, a serological test to detect IgG directed to the N protein, and a DR-ELISA measuring the total antibody response to N (left to right). Results of DR-ELISA are shown as S/P: sample to positive control ratio: S/P=test samplemean negative controlmean positive controlmean negative control and Units=test sample at x dpitest sample at 0 dpi .
Figure 4
Figure 4
Cytokine and chemokine levels in peripheral blood after SARS-CoV-2 infection. Longitudinal sera collected after SARS-CoV-2 infection were tested. Results were expressed as pg/mL. Statistically significant differences in the geometric mean between rhesus and cynomolgus macaques are indicated with *.
Figure 5
Figure 5
Cumulative CT scores. Cumulative CT scores for each animal were calculated based on the CT scores depicted in Table 1.
Figure 6
Figure 6
Longitudinal development of both lung lesions and metabolic activity in tracheobronchial lymph nodes of J16017 over time after a SARS-CoV-2 infection. Representative coronal slices with a thickness of 3 mm of J16017 were used for visualization. On days 0 and 4, only CT images were obtained, afterwards, until day 35, CT was combined with PET. The location of the lesions, marked with arrows, differed almost per time point, but are most prominently localized in the left lung on day 35.
Figure 7
Figure 7
Viral RNA loads in tissues of SARS-CoV-2-infected rhesus macaques (R14002) and cynomolgus macaques (J16012, J16017, and Ji408005). Viral RNA was quantified by qRT-PCR and calculated per gram of tissue. Only animals with viral RNA-positive tissues are shown. On the y-axis, the tissues are listed, on the x-axis the RNA copies per g tissue. Tissues in which no RNA was observed in any of the animals are not shown. The tissues are grouped by color codes as indicated on the right. Tissues that tested positive for sgmRNA are indicated with *. Abbreviations: L, left; R, right; LN, lymph node; UR, upper right lung lobe; AR, accessory right lung lobe; MR, middle right lung lobe; LR, lower right lung lobe; UL, upper left lung lobe; ML, middle left lung lobe; LL, lower left lung lobe.
Figure 8
Figure 8
Histopathology of tissues from rhesus and cynomolgus macaques infected with SARS-CoV-2 and euthanized 36 to 42 days post-infection. (A) Panel 1. Lung of healthy, uninfected macaque (Hematoxylin and Eosin (HE) staining, original magnification 100×); Panel 2. Lung of rhesus macaque infected with SARS-CoV-2 and euthanized day 36 pi. Focal area with mild alveolar septa expansion with a low number of mononuclear inflammatory cells (asterisks) and foci of bronchiolar smooth muscle hyperplasia (arrows) (HE, 100×); Panel 3. Masson’s trichrome staining shows the presence of collagen (lighter blue) mildly expanding the alveolar septa at some areas indicated by arrows. The internal control is the blood vessel on the left side with lighter blue staining of tunica adventitia (Trichrome stain, 630×); Panel 4. Lung of infected rhesus macaque with foci of mildly thickened alveolar walls lined by cuboidal to columnar epithelial cells with hyperchromatic nuclei representing type II pneumocyte hyperplasia (arrows) and few aggregates of macrophages in the alveolar lumina (asterisks) (HE, 400×). Panel 4 inset: TTF1 marker was used to identify and confirm type II pneumocytes, stained in red-brown (IHC, 400×). (B) Panel 1. Cervical lymph node of cynomolgus macaque J16017 with marked follicular lymphoid hyperplasia. Numerous lymphoid follicles in the cortex (square), paracortex (arrowhead), and medulla (asterisk) are indicated (HE, 50×); Panel 2. Mesenteric lymph node of rhesus macaque R14002 with marked paracortical lymphoid hyperplasia and medullar sinusoidal histiocytosis. Cortex (square), paracortex (arrowhead), and medulla (asterisk) are indicated (HE, 50×). (C) Panel 1. PET-CT image of the skull of J16017 with prominent metabolic activity in the left ocular region (arrow); Panel 2. Conjunctiva of the same individual. Numerous perivascular and multifocal lymphocytes infiltrating the stratified squamous epithelium and the substantia propria. Goblet cell (arrow), non-keratinized stratified squamous epithelium (arrowhead), and substantia propria (asterisk) are indicated (HE, 200×).

References

    1. Whetton A.D., Preston G.W., Abubeker S., Geifman N. Proteomics and Informatics for Understanding Phases and Identifying Biomarkers in COVID-19 Disease. J. Proteome Res. 2020;19:4219–4232. doi: 10.1021/acs.jproteome.0c00326. - DOI - PMC - PubMed
    1. Polak S.B., Van Gool I.C., Cohen D., von der Thusen J.H., van Paassen J. A systematic review of pathological findings in COVID-19: A pathophysiological timeline and possible mechanisms of disease progression. Mod. Pathol. 2020;33:2128–2138. doi: 10.1038/s41379-020-0603-3. - DOI - PMC - PubMed
    1. Kwee T.C., Kwee R.M. Chest CT in COVID-19: What the Radiologist Needs to Know. Radiographics. 2020;40:1848–1865. doi: 10.1148/rg.2020200159. - DOI - PMC - PubMed
    1. Lin L., Lu L., Cao W., Li T. Hypothesis for potential pathogenesis of SARS-CoV-2 infection-a review of immune changes in patients with viral pneumonia. Emerg. Microbes Infect. 2020;9:727–732. doi: 10.1080/22221751.2020.1746199. - DOI - PMC - PubMed
    1. Oronsky B., Larson C., Hammond T.C., Oronsky A., Kesari S., Lybeck M., Reid T.R. A Review of Persistent Post-COVID Syndrome (PPCS) Clin. Rev. Allergy Immunol. 2021;3:1–9. doi: 10.1007/s12016-021-08848-3. - DOI - PMC - PubMed

Publication types

MeSH terms