

Anticancer Effect of Rh2, a Histone Deacetylase Inhibitor, in HepG2 Cells and HepG2 Cell-Derived Xenograft Tumors Occurs via the Inhibition of HDACs and Activation of the MAPK Signaling Pathway
- PMID: 34452568
- PMCID: PMC8629470
- DOI: 10.31557/APJCP.2021.22.8.2529
Anticancer Effect of Rh2, a Histone Deacetylase Inhibitor, in HepG2 Cells and HepG2 Cell-Derived Xenograft Tumors Occurs via the Inhibition of HDACs and Activation of the MAPK Signaling Pathway
Abstract
Purpose: To investigate the effect of 20(S)-ginsenoside Rh2 (Rh2) on anti HepG2 liver cancer cells and HepG2 cell-derived xenograft tumors, and explore the underlying mechanisms.
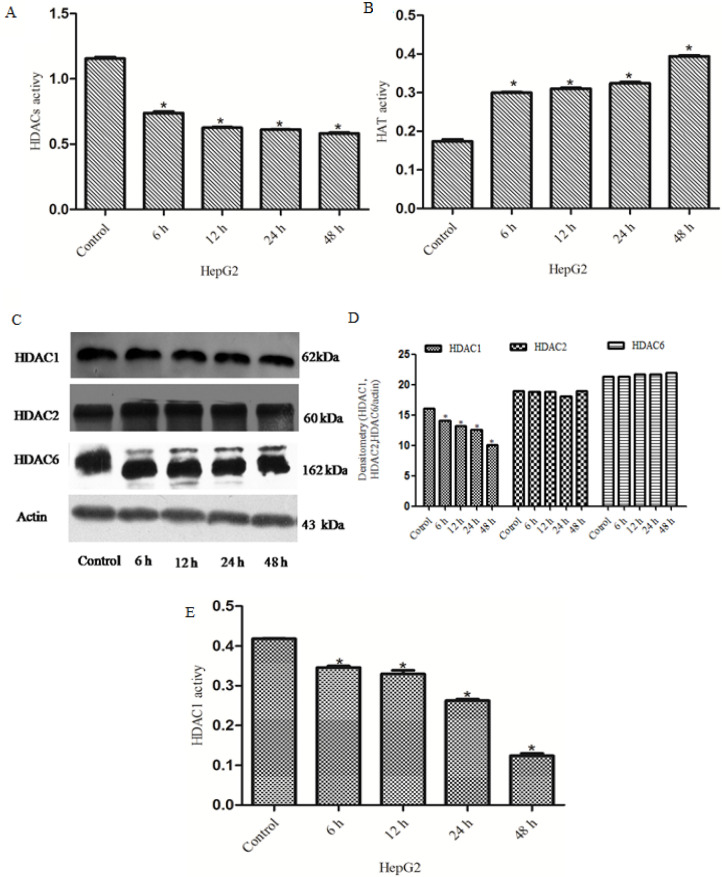
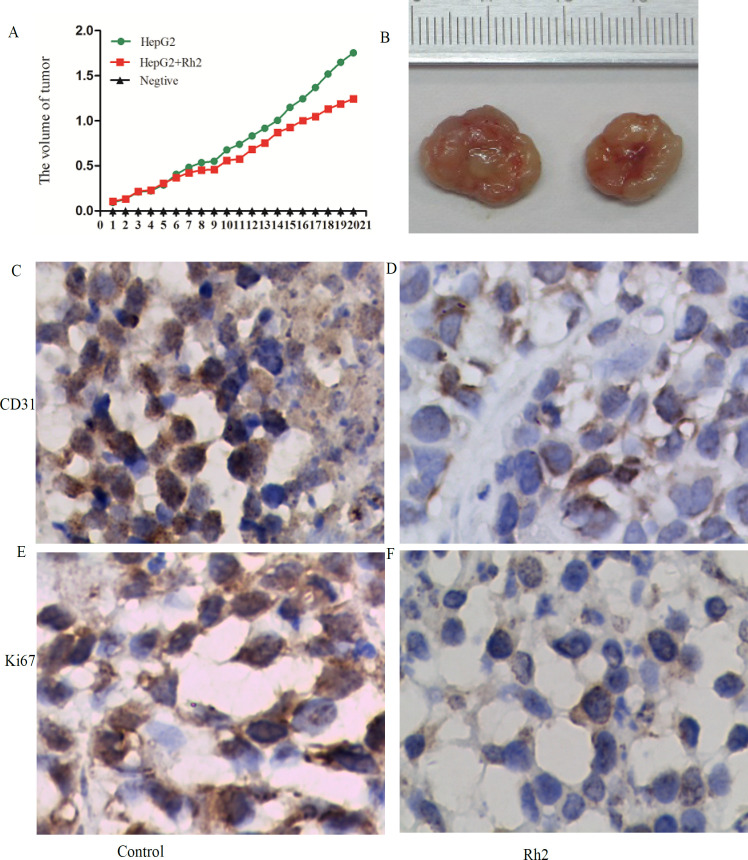
Materials and methods: The activity of total HDACs and HAT were assessed with a HDACs colorimetric kit. Expression of HDAC1, HDAC2, HDAC6, p-ERK, ERK, p-P38, P38, p-JNK and JNK proteins was tested by Western blotting.H3K9 and H3K14 proteins were also checked by immunofluorescence, changes in cell cycle distribution with flow cytometry, cell apoptosis with annexin V-FTIC/PI double staining. Activity of Renilla luciferase (HIF) was detected using the Luciferase Reporter Assay system reagent. Gene expression for CyclinD1, Bcl-2, Bax, HIF, IL-1, IL-6, IL-10 and TNF-α was tested by q-PCR. Expression levels of CD31 and Ki-67 was tested by immunohistochemical staining.
Results: Total HDAC activity was decreased and total histone acetyltransferase (HAT)activity was increased in a time-dependent manner. Expression of HDAC1 and p-JNK proteins was significantly increased, expression levels of p-ERK was decreased. H3K9 and H3K14 fluorescence protein were increased. Flow cytometric analysis of the cell cycle revealed that the percentage of cells in the G0/G1 phase in the treatment group(64.35±1.36%) was significantly increased compared with the untreated group(61.61±1.23%).The apoptotic rate of the HepG2 group was 10.03±1.92%, which increased to 17.87±1.67% in the treatment group. Expression levels of the transcription factor HIF were also increased in HepG2 cells following induction by Rh2. Expression of CyclinD1 and Bcl-2 at the genetic level was significantly decreased, while expression levels of Bax, HIF, IL-1, IL-6, IL-10 and TNF-α was increased. In vivo, the expression levels of both CD31 and Ki-67 proteins were significantly down-regulated in the treatment group compared with the control group.
Conclusions: The effects of Rh2 were suggested to occur through the inhibition of total HDAC activity, which subsequently induced MAPK signaling and down-regulated the expression of HIF.<br />.
Keywords: 20(S)-ginsenoside Rh2; HepG2 cells; MAPK; histone deacetylase; hypoxia-inducible factor.
Figures


Similar articles
-
Effect of trichostatin A on anti HepG2 liver carcinoma cells: inhibition of HDAC activity and activation of Wnt/β-Catenin signaling.Asian Pac J Cancer Prev. 2014;15(18):7849-55. doi: 10.7314/apjcp.2014.15.18.7849. Asian Pac J Cancer Prev. 2014. PMID: 25292076
-
Ginsenoside 20(s)-Rh2 as potent natural histone deacetylase inhibitors suppressing the growth of human leukemia cells.Chem Biol Interact. 2015 Dec 5;242:227-34. doi: 10.1016/j.cbi.2015.10.014. Epub 2015 Oct 19. Chem Biol Interact. 2015. PMID: 26482938
-
Anticancer effect of 20(S)-ginsenoside Rh2 on HepG2 liver carcinoma cells: Activating GSK-3β and degrading β-catenin.Oncol Rep. 2016 Oct;36(4):2059-70. doi: 10.3892/or.2016.5033. Epub 2016 Aug 24. Oncol Rep. 2016. PMID: 27573179
-
Mechanism and application of HDAC inhibitors in the treatment of hepatocellular carcinoma.J Mol Med (Berl). 2025 Apr;103(4):469-484. doi: 10.1007/s00109-025-02532-1. Epub 2025 Mar 25. J Mol Med (Berl). 2025. PMID: 40131444 Review.
-
Ginsenoside Rh2: A shining and potential natural product in the treatment of human nonmalignant and malignant diseases in the near future.Phytomedicine. 2023 Sep;118:154938. doi: 10.1016/j.phymed.2023.154938. Epub 2023 Jun 20. Phytomedicine. 2023. PMID: 37406390 Review.
Cited by
-
Silencing of lncRNA CRNDE attenuates nonsmall-cell lung cancer progression by mediating the miR-455-3p/HDAC2 axis.Kaohsiung J Med Sci. 2022 Aug;38(8):749-760. doi: 10.1002/kjm2.12558. Epub 2022 May 25. Kaohsiung J Med Sci. 2022. PMID: 35611803 Free PMC article.
-
H3K14: A histone site closely related to diseases.J Cancer. 2025 Jul 28;16(11):3537-3550. doi: 10.7150/jca.118273. eCollection 2025. J Cancer. 2025. PMID: 40861814 Free PMC article. Review.
References
MeSH terms
Substances
LinkOut - more resources
Full Text Sources
Medical
Research Materials
Miscellaneous