. 2021 Aug 27;7(35):eabg1921.
doi: 10.1126/sciadv.abg1921. Print 2021 Aug.

Environmental vulnerability of the global ocean epipelagic plankton community interactome

Affiliations

Environmental vulnerability of the global ocean epipelagic plankton community interactome

Samuel Chaffron et al. Sci Adv. .

Abstract

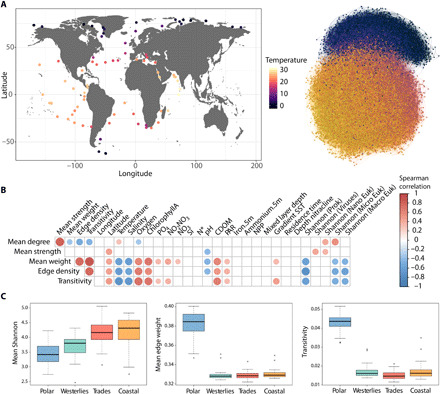
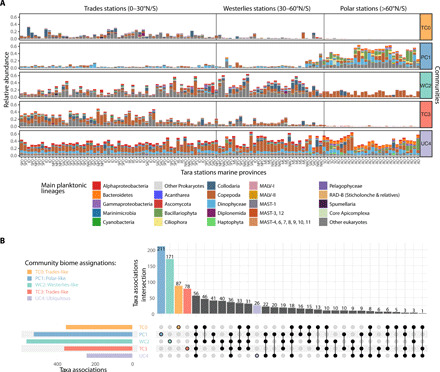
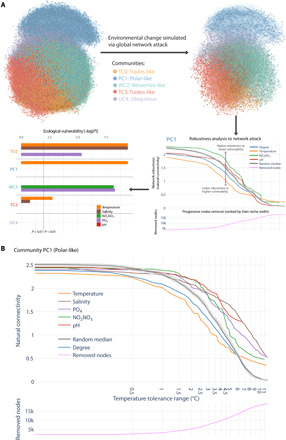
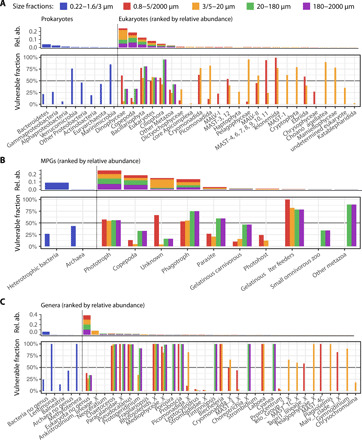
Marine plankton form complex communities of interacting organisms at the base of the food web, which sustain oceanic biogeochemical cycles and help regulate climate. Although global surveys are starting to reveal ecological drivers underlying planktonic community structure and predicted climate change responses, it is unclear how community-scale species interactions will be affected by climate change. Here, we leveraged Tara Oceans sampling to infer a global ocean cross-domain plankton co-occurrence network-the community interactome-and used niche modeling to assess its vulnerabilities to environmental change. Globally, this revealed a plankton interactome self-organized latitudinally into marine biomes (Trades, Westerlies, Polar) and more connected poleward. Integrated niche modeling revealed biome-specific community interactome responses to environmental change and forecasted the most affected lineages for each community. These results provide baseline approaches to assess community structure and organismal interactions under climate scenarios while identifying plausible plankton bioindicators for ocean monitoring of climate change.


Figures

Fig. 1
Fig. 1. Abiotic factors shape the pole-to-pole cross-domain plankton interactome structure.
(A) The Tara Oceans circumnavigation (2009–2013) included a comprehensive metabarcoding and metagenomics sampling along with physicochemical parameter measurements covering a wide pole-to-pole latitudinal gradient of temperature. The GPI covers the three domains of life including eukaryotes, bacteria, and archaea and is highly structured along the latitudinal gradient of temperature from the equator to the poles. It counts 20,810 nodes (and 86,026 edges) colored according to their optimum niche temperature. (B) The plankton interactome topology is significantly associated to diversity, temperature, salinity, light (PAR, photosynthetically available radiation), nutrient concentrations, and pH (Spearman correlations FDR < 0.01, empty boxes correspond to nonsignificant correlations). (C) The polar interactome displays stronger associations (mean edge weight) and clustering coefficients (transitivity) compared to other biomes (Dunn’s test, FDR < 0.05) despite its overall lower diversity.
Fig. 2
Fig. 2. Biome-specific communities and associations emerge from the plankton interactome.
(A) The GPI can be decomposed into five communities that are preferentially observed in specific marine biomes: Communities TC0 and TC3 are Trades-like, community WC2 is Westerlies-like, community PC1 is Polar-like, and community UC4 is ubiquitous. Distinct main plankton lineage compositions are observed in each community along the latitudinal axis (stations are ordered by absolute latitude), disrespect of the ocean region. SPO, South Pacific Ocean; NPO, North Pacific Ocean; SAO, South Atlantic Ocean; NAO, North Atlantic Ocean; IO, Indian Ocean; RS, Red Sea; MS, Mediterranean Sea; SO, Southern Ocean; AO, Arctic Ocean. (B) Most plankton associations between main plankton lineages are community-specific, with communities WC2 (Westerlies-like) and PC1 (Polar-like) displaying the highest number of discriminant associations, while community UC4 displays fewer ubiquitous associations. Shared associations between communities are indicated with black-filled circles and connecting lines.
Fig. 3
Fig. 3. Predicting ecological vulnerabilities via network-based simulations.
(A) Environmental change simulations are performed through tolerance range perturbations, which is progressively removing nodes of the GPI ranked by their environmental niche width (from smaller to larger), to predict ecological vulnerabilities of GPI communities. Significant vulnerabilities to environmental changes were determined by comparing distributions of the network natural connectivity (a graph robustness measure) evolution for each abiotic factor, as compared to a random perturbation. The ecological vulnerability of each GPI community was then quantified by the statistical significance [−log(P)]. GPI communities TC0, TC3 (Trades-like), and PC1 (Polar) were predicted vulnerable to temperature change, while community WC2 (Westerlies-like) was predicted vulnerable to nutrient concentration variations. (B) The polar community (PC1) is predicted to be particularly vulnerable to temperature variations (Wilcoxon rank test, P = 3.8 × 10⁻¹⁰).
Fig. 4
Fig. 4. Polar marine plankton lineages and groups predicted to be most vulnerable to temperature change.
(A) Environmental tolerance range perturbations of the GPI predicted polar marine plankton lineages (community PC1) potentially most affected by temperature variations. (B) Grouping these lineages into MPGs predicted associated functions potentially most affected by temperature variations in the polar ecosystem. (C) Genera most impacted by temperature variations are also identified and are potential species indicators of ocean warming in the polar ecosystem. In all panels, the fraction of lineages, MPGs, and genera (from 1 for most affected to 0 for not affected) predicted to be affected by temperature variations are depicted within each size fraction. Plankton lineages (prokaryotes and eukaryotes), MPGs, and genera are ordered according to the cumulative mean relative abundance of the corresponding OTUs across size fractions (note that these relative abundances are not directly comparable between size fractions).

References

    1. Field C. B., Behrenfeld M. J., Randerson J. T., Falkowski P., Primary production of the biosphere: Integrating terrestrial and oceanic components. Science 281, 237–240 (1998). - PubMed
    1. Gregory A. C., Zayed A. A., Conceição-Neto N., Temperton B., Bolduc B., Alberti A., Ardyna M., Arkhipova K., Carmichael M., Cruaud C., Dimier C., Domínguez-Huerta G., Ferland J., Kandels S., Liu Y., Marec C., Pesant S., Picheral M., Pisarev S., Poulain J., Tremblay J.-É., Vik D.; Tara Oceans Coordinators, Babin M., Bowler C., Culley A. I., de Vargas C., Dutilh B. E., Iudicone D., Karp-Boss L., Roux S., Sunagawa S., Wincker P., Sullivan M. B., Marine DNA viral macro- and microdiversity from pole to pole. Cell 177, 1109–1123.e14 (2019). - PMC - PubMed
    1. Ibarbalz F. M., Henry N., Brandão M. C., Martini S., Busseni G., Byrne H., Coelho L. P., Endo H., Gasol J. M., Gregory A. C., Mahé F., Rigonato J., Royo-Llonch M., Salazar G., Sanz-Sáez I., Scalco E., Soviadan D., Zayed A. A., Zingone A., Labadie K., Ferland J., Marec C., Kandels S., Picheral M., Dimier C., Poulain J., Pisarev S., Carmichael M., Pesant S.; Tara Oceans Coordinators, Babin M., Boss E., Iudicone D., Jaillon O., Acinas S. G., Ogata H., Pelletier E., Stemmann L., Sullivan M. B., Sunagawa S., Bopp L., de Vargas C., Karp-Boss L., Wincker P., Lombard F., Bowler C., Zinger L., Global trends in marine plankton diversity across kingdoms of life. Cell 179, 1084–1097.e21 (2019). - PMC - PubMed
    1. Salazar G., Paoli L., Alberti A., Huerta-Cepas J., Ruscheweyh H.-J., Cuenca M., Field C. M., Coelho L. P., Cruaud C., Engelen S., Gregory A. C., Labadie K., Marec C., Pelletier E., Royo-Llonch M., Roux S., Sánchez P., Uehara H., Zayed A. A., Zeller G., Carmichael M., Dimier C., Ferland J., Kandels S., Picheral M., Pisarev S., Poulain J.; Tara Oceans Coordinators, Acinas S. G., Babin M., Bork P., Bowler C., de Vargas C., Guidi L., Hingamp P., Iudicone D., Karp-Boss L., Karsenti E., Ogata H., Pesant S., Speich S., Sullivan M. B., Wincker P., Sunagawa S., Gene expression changes and community turnover differentially shape the global ocean metatranscriptome. Cell 179, 1068–1083.e21 (2019). - PMC - PubMed
    1. Stocker R., Marine microbes see a sea of gradients. Science 338, 628–633 (2012). - PubMed