. 2021 Aug 27;7(35):eabg2873.
doi: 10.1126/sciadv.abg2873. Print 2021 Aug.

No ordinary proteins: Adsorption and molecular orientation of monoclonal antibodies

Affiliations

No ordinary proteins: Adsorption and molecular orientation of monoclonal antibodies

Ankit Kanthe et al. Sci Adv. .

Abstract

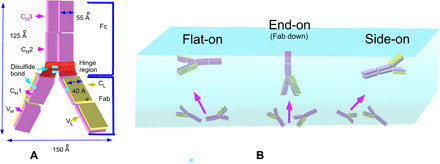
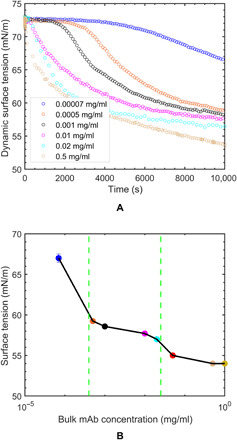
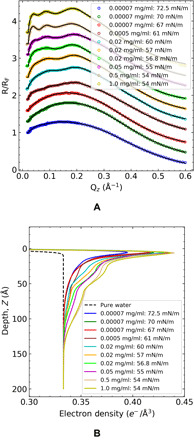
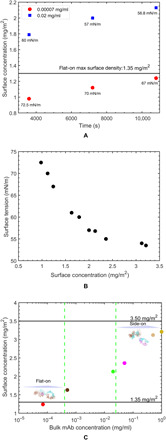
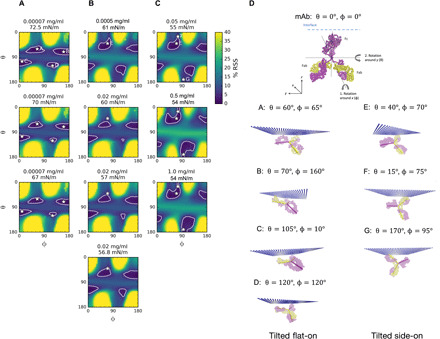
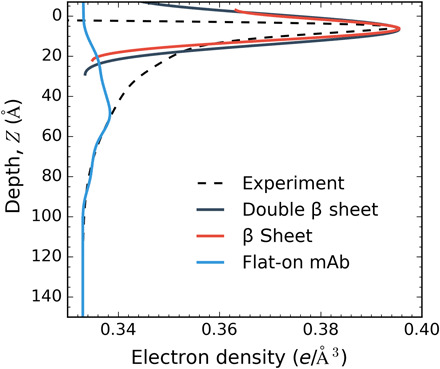
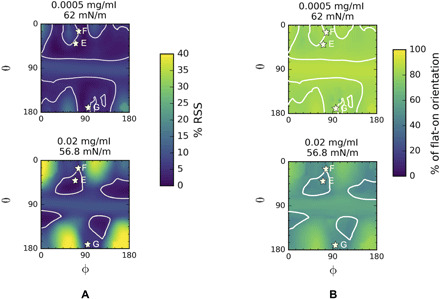
The interaction of monoclonal antibodies (mAbs) with air/water interfaces plays a crucial role in their overall stability in solution. We aim to understand this behavior using pendant bubble measurements to track the dynamic tension reduction and x-ray reflectivity to obtain the electron density profiles (EDPs) at the surface. Native immunoglobulin G mAb is a rigid molecule with a flat, "Y" shape, and simulated EDPs are obtained by rotating a homology construct at the surface. Comparing simulations with experimental EDPs, we obtain surface orientation probability maps showing mAbs transition from flat-on Y-shape configurations to side-on or end-on configurations with increasing concentration. The modeling also shows the presence of β sheets at the surface. Overall, the experiments and the homology modeling elucidate the orientational phase space during different stages of adsorption of mAbs at the air/water interface. These finding will help define new strategies for the manufacture and storage of antibody-based therapeutics.


Figures

Fig. 1
Fig. 1. IgG mAb structure and orientations at the air/water interface.
(A) Structure of an IgG mAb showing the variable and constant domains of the light and heavy chains and the interconnecting disulfide linkages. The dimensions of mAb shown in the figure are not up to the scale. (B) Possible orientations at an air/aqueous interface, including flat-on, side-on, and end-on configurations.
Fig. 2
Fig. 2. Pendant bubble tensiometer surface tension relaxation profiles of mAb.
(A) Dynamic surface tension measured as a function of time at different mAb bulk concentrations and (B) quasi-equilibrium surface tension isotherm based on the long-time pendant bubble surface tension measurements and identification of condensation region from plateau behavior in tension. The surface tension values at 5 × 10⁻² mg/ml (red) and 1.0 mg/ml (yellow) are based on the interpolated and extrapolated values from the dynamic tension reduction as measured by the pendant bubble tensiometer. Error bars are based on two experimental results. For higher mAb concentration, the error bars are smaller than the marker size. The vertical dashed lines in green demarcate the start and end of the condensation region.
Fig. 3
Fig. 3. XRR measurements from adsorbed layers at the air/water interface derived from adsorption from bulk solutions of mAb.
(A) Normalizing XRR, R/RF symbols as a function of the wave function Qz and slab model fits calculated by Parratt method (solid line) for mAb concentration along the function of time or surface tension value. The upper nine XR curves are shifted for clarity, although R/RF → 1 as Qz → 0 for all measurements. (B) Corresponding electron density determined by the fits for mAb layers as a function of interfacial depth. The black dashed line is the theoretical EDP curve from the pure water surface.
Fig. 4
Fig. 4. Surface concentration of adsorbed mAb, surface tension, and bulk mAb concentration.
(A) XRR measurements of the surface concentration as a function of time for bulk concentrations of 7 × 10⁻⁵ and 2 × 10⁻² mg/ml. The horizontal line indicates the maximum packed density of the flat-on orientation A, 1.35 mg/m2. (B) Dependence of the surface tension on the surface concentration and (C) quasi-equilibrium surface concentrations as a function of bulk concentration (adsorption isotherm). The horizontal lines indicate the maximum packing densities of the flat-on A, 1.35 mg/m2, and side-on As, 3.50 mg/m2, orientations. The error bars for surface concentration in (A) to (C) are smaller than the marker size and therefore are not visible in the plot. The actual error bars for surface concentration are shown in Table 1.
Fig. 5
Fig. 5. Depiction of the rigid homology model for the mAb with protein rotational parameters (θ and ϕ).
The variable and constant domains of the light and heavy chains are shown in yellow and magenta, respectively. A stick model is overlaid onto the detailed mAb structure to represent the Fab (yellow) and Fc (magenta) domains of the Y-shaped mAb molecule. Maps of the (minimized) RSS between the simulated and experimental EDPs for rotations θ, ϕ at mAb concentrations of (A) 0.0007 mg/ml (72.5, 70, and 67 mN/m); (B) 0.0005 mg/ml (61 mN/m) and 0.02 mg/ml (60, 57, and 56.8 mN/m); and (C) 0.05 mg/ml (55 mN/m), 0.5 mg/ml (54 mN/m), and 1.0 mg/ml (54 mN/m). The white contour lines in the maps correspond to 5% RSS that represent the optimum θ and ϕ pairs for mAb orientation. The asterisks (A to G) marked in the white contour lines demarcate representative orientations within the interior spaces, and these orientations are shown visually in (D). Orientations A to D correspond to tilted flat-on, and orientations E to G correspond to tilted side-on in (D).
Fig. 6
Fig. 6. β Sheet formation at the air/water interface.
The simulated EDP for a β sheet represents the first 6-Å peak of the experiment EDP. A comparison of the β sheet (red), double β sheet (black), and flat-on mAb (blue) is included for comparison purposes to show that the broad EDP profiles do not represent the first peak of experimental EDP.
Fig. 7
Fig. 7. Fitting the EDP in the condensation region using the homology construct and assuming two populations of adsorbed mAbs, one with a flat-on configuration (θ = 80° and ϕ = 160°) and a second with configuration angles θ and ϕ (for details, see fig. S3).
(A) Minimized RSS map in θ, ϕ space corresponding to the orientation of the second population. The RSS has been minimized in the relative fractions of the populations. (B) θ, ϕ Maps of the percentage fraction of the flat-on configuration corresponding to the minimized RSS in (A). At concentrations of 0.0005 mg/ml, which is the start of the condensation regime, the mAb adopts a higher percentage fraction of the flat-on configuration as compared to 0.02 mg/ml. This indicates that as mAb concentration increases in the condensation regime, a second population of mAb (side-on) evolves yielding fewer mAb molecules in flat-on orientation. The white contour lines in the maps correspond to 5% RSS that represent the optimum θ and ϕ pairs for mAb orientation. The asterisks (E to G) correspond to the second population indicating tilted side-on orientations of Fig. 5D.

References

    1. D. Möbius, R. Miller, Proteins at Liquid Interfaces (Elsevier, 1998).
    1. Yano Y. F., Kinetics of protein unfolding at interfaces. J. Phys. Condens. Matter 24, 503101 (2012). - PubMed
    1. Bos M. A., van Vliet T., Interfacial rheological properties of adsorbed protein layers and surfactants: A review. Adv. Colloid Interface Sci. 91, 437–471 (2001). - PubMed
    1. Freer E. M., Yim K. S., Fuller G. G., Radke C. J., Shear and dilatational relaxation mechanisms of globular and flexible proteins at the hexadecane/water interface. Langmuir 20, 10159–10167 (2004). - PubMed
    1. E. Dickinson, R. Miller, Food Colloids: Fundamentals of Formulation, vol. 258 (Royal Society of Chemistry, 2001).