. 2021 Aug 27;7(35):eabj0153.
doi: 10.1126/sciadv.abj0153. Print 2021 Aug.

Sustained oxygenation accelerates diabetic wound healing by promoting epithelialization and angiogenesis and decreasing inflammation

Affiliations

Sustained oxygenation accelerates diabetic wound healing by promoting epithelialization and angiogenesis and decreasing inflammation

Ya Guan et al. Sci Adv. .

Abstract

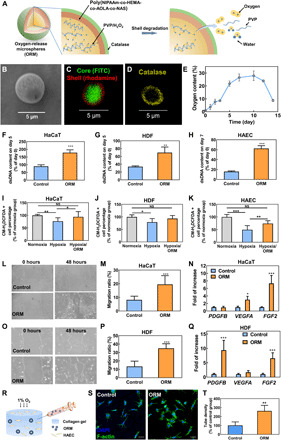
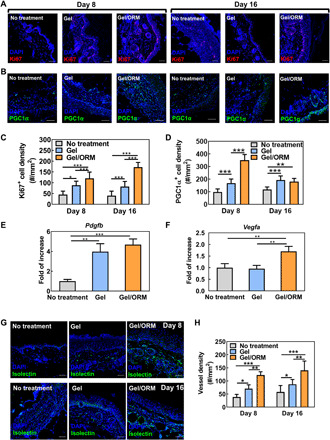
Nonhealing diabetic wounds are common complications for diabetic patients. Because chronic hypoxia prominently delays wound healing, sustained oxygenation to alleviate hypoxia is hypothesized to promote diabetic wound healing. However, sustained oxygenation cannot be achieved by current clinical approaches, including hyperbaric oxygen therapy. Here, we present a sustained oxygenation system consisting of oxygen-release microspheres and a reactive oxygen species (ROS)-scavenging hydrogel. The hydrogel captures the naturally elevated ROS in diabetic wounds, which may be further elevated by the oxygen released from the administered microspheres. The sustained release of oxygen augmented the survival and migration of keratinocytes and dermal fibroblasts, promoted angiogenic growth factor expression and angiogenesis in diabetic wounds, and decreased the proinflammatory cytokine expression. These effects significantly increased the wound closure rate. Our findings demonstrate that sustained oxygenation alone, without using drugs, can heal diabetic wounds.


Figures

Fig. 1
Fig. 1. ORMs continuously release oxygen and regulate skin cell behaviors in vitro.
(A) Schematic illustration of ORMs and its oxygen-release mechanism. (B) Scanning electron microscopy image of ORM. (C) Fluorescent image of ORM. (D) Fluorescent image of ORM after catalase (labeled with FITC) conjugation. Color of FITC was adjusted. (E) Oxygen-release kinetics of ORMs. n = 8. (F to H) Double-stranded DNA (dsDNA) content of HaCaT cells (n = 5) (F), human dermal fibroblasts (HDFs; n = 5) (G), and human arterial endothelial cell (HAECs; n = 3) (H) cultured under hypoxia. (I to K) ROS content in HaCaT cells (n = 10) (I), HDFs (n = 6) (J), and HAECs (n = 8) (K) cultured under normoxia, hypoxia, or hypoxia with ORM. (L and M) Migration of HaCaT cells cultured under hypoxia. n = 4. (N) Gene expression of PDGFB, VEGFA, and FGF2 in HaCaT cells cultured under hypoxia. n ≥ 3. (O and P) Migration of HDFs cultured under hypoxia. n = 4. (Q) Gene expression of PDGFB, VEGFA, and FGF2 in HDFs cultured under hypoxia. n ≥ 3. (R) Schematic illustration of HAEC tube formation assay. (S and T) Tube formation (S) and tube density (T) of HAECs cultured under hypoxia for 16 hours. Scale bars, 50 μm. *P < 0.05, **P < 0.01, and ***P < 0.001. NS, not significant; DAPI, 4′,6-diamidino-2-phenylindole.
Fig. 2
Fig. 2. ORMs elevate intracellular oxygen content and ATP content and activate HO-1 and Erk1/2 pathways under hypoxia.
(A to C) Intracellular oxygen content measured by EPR. Keratinocytes (HaCaT cells) were incubated with lithium phthalocyanine (LiPc) nanoparticles for endocytosis and then cultured under 1% oxygen conditions (with or without ORM) for 24 hours. n = 3 for each group. *P < 0.05. (D) Intracellular ATP content in HaCaT cells measured by an ATP assay kit. Cells were cultured under 1% oxygen conditions (with or without ORM) for 24 hours. **P < 0.01. (E) Immunoblotting of HO-1 and phosphorylated Erk1/2 (p-Erk1/2) in dermal fibroblasts cultured under hypoxic conditions for 48 hours. t-Erk1/2 was used as the internal reference. Glyceraldehyde-3-phosphate dehydrogenase (GAPDH) served as a loading control.
Fig. 3
Fig. 3. ROS-scavenging hydrogel protects skin cells under oxidative stress by consuming hydroxyl radicals and superoxides.
(A) ROS-scavenging (ROSS) hydrogel capable of scavenging ROS in chronic wounds or generated from released oxygen or PVP/H2O2. (B) Synthesis and ROS-scavenging mechanism of ROSS hydrogel. BPO, benzoyl peroxide. (C) Injectability and gelation of ROSS hydrogel (Gel) and Gel/ORM construct. (D) Scavenging effect on hydroxyl radicals of ROSS gel and non–ROS-responsive gel (Control) (n = 4). (E) Scavenging effect on superoxide of ROSS gel and non–ROS-responsive gel (Control) (n = 3). (F) Degradation of ROSS gel at 37°C for 4 weeks in DPBS with 0 and 50 mM H2O2. (G) Schematic illustration of an in vitro model for skin cell survival on gels under 100 μM H2O2 to mimic the in vivo cell environment under oxidative stress. Non–ROS-responsive gel was used as a control. (H) Cell viability of HaCaT cells at 48 and 72 hours on control gel and ROSS gel (normalized to the initial cell viability on each gel). n ≥ 6. *P < 0.05 and ***P < 0.001. Photo credit: Hong Niu, Washington University in St. Louis.
Fig. 4
Fig. 4. ORMs encapsulated in ROS-scavenging hydrogel accelerate wound healing in db/db mice.
(A) Schematic illustration of the design of animal experiments to test the therapeutic effect of ROSS gel (Gel) and ORMs in a db/db mouse model. (B) Representative images of the wounds treated with or without Gel and ORMs for 16 days. (C) Wound size change during 16 days of post wounding. Wound size at each time point was normalized to day 0. n ≥ 8. (D) Immunofluorescence staining of cytokeratin 10 (K10, green) and cytokeratin 14 (K14, red) for the wounds at days 8 and 16. Scale bars, 200 μm. (E) Immunofluorescence staining of K14 (red) in the wounded region at days 8 and 16. Scale bars, 50 μm. (F) Quantification of hair follicle density in the wounded region at days 8 and 16. (G) Hematoxylin and eosin staining of the wounded skin at days 8 and 16. Scale bars, 500 μm. (H) Quantification of epidermal thickness. Epidermal thickness was calculated in the region where wound was closed. (I) Picrosirius red staining of the wounded skin at day 16. Scale bar, 50 μm. (J) Quantification of total collagen deposition at day 16. (K) Quantification of collagen I/III ratio at day 16. *P < 0.05, **P < 0.01, and ***P < 0.001. Photo credit: Ya Guan and Hong Niu, Washington University in St. Louis.
Fig. 5
Fig. 5. Continuous oxygenation and ROS scavenging promote cell proliferation and metabolism and stimulate angiogenic growth factor expression and angiogenesis in diabetic wounds.
(A) Immunofluorescence staining of Ki67 (red) in the wounded region at 8 and 16 days after wounding. Scale bars, 50 μm. (B) Immunofluorescence staining of PGC1α (green) in the wounded region at 8 and 16 days after wounding. Scale bars, 50 μm. (C) Quantification of Ki67+ cell density. (D) Quantification of PGC1α+ cell density. (E and F) Gene expression of Pdgfb (E) and Vegfa (F) from the tissue lysates extracted from the wounded skin at day 8. n ≥ 4. (G) Immunofluorescence staining of isolectin (green) in the wounded region at 8 and 16 days after wounding. Scale bars, 50 μm. Nuclei were stained with DAPI in all immunofluorescence staining images. (H) Quantification of vessel density. *P < 0.05, **P < 0.01, and ***P < 0.001.
Fig. 6
Fig. 6. Continuous oxygenation and ROS scavenging alleviate oxidative stress, inflammation, and proinflammatory cytokine expression in diabetic wounds.
(A) Immunofluorescence staining of CM-H2DCFDA (red) at the wounded site at days 8 and 16. Scale bars, 50 μm. (B) Immunofluorescence staining of CD86 (red) at the wounded site at days 8 and 16. Scale bars, 50 μm. Nuclei were stained with DAPI in all immunofluorescence staining images. (C) Quantification of ROS+ cell density. The results were normalized to the ROS+ cell density in No treatment group at day 8. n ≥ 8. (D) Quantification of CD86+ cell density. *P < 0.05 and ***P < 0.001. (E) Cytokine array analysis of the proinflammatory cytokine level in the wounds 8 days after treatment. (F) Quantitative summary of cytokine array analysis in (E). A.U., arbitrary units.
Fig. 7
Fig. 7. ORMs activate HO-1 and Erk1/2 pathways.
Immunoblotting of HO-1 and p-Erk1/2 from the tissue lysates extracted from wounded skin at days 8 and 16 after wounding. t-Erk1/2 was used as the internal reference. GAPDH was used as a loading control.
Fig. 8
Fig. 8. Mechanisms of accelerated wound healing by ORMs encapsulated in ROS-scavenging hydrogel.
The ORMs and ROSS gel augmented cell proliferation and migration, promoted angiogenesis and reepithelialization, and decreased inflammation and oxidative stress in diabetic wounds.

Similar articles

Cited by

References

    1. Centers for Disease Control and Prevention, in National Diabetes Statistics Report 2020. Estimates of diabetes and its burden in the United States 2020 (Centers for Disease Control and Prevention, 2020), pp. 1–32.
    1. Singh N., Armstrong D. G., Lipsky B. A., Preventing foot ulcers in patients with diabetes. JAMA 293, 217–228 (2005). - PubMed
    1. Everett E., Mathioudakis N., Update on management of diabetic foot ulcers. Ann. N. Y. Acad. Sci. 1411, 153–165 (2018). - PMC - PubMed
    1. Gottrup F., Apelqvist J., Present and new techniques and devices in the treatment of DFU: A critical review of evidence. Diabetes Metab. Res. Rev. 28, 64–71 (2012). - PubMed
    1. Falanga V., Wound healing and its impairment in the diabetic foot. Lancet 366, 1736–1743 (2005). - PubMed

Publication types