. 2021 Aug 27;7(35):eabj0364.
doi: 10.1126/sciadv.abj0364. Print 2021 Aug.

Genome-wide synthetic lethal screen unveils novel CAIX-NFS1/xCT axis as a targetable vulnerability in hypoxic solid tumors

Affiliations

Genome-wide synthetic lethal screen unveils novel CAIX-NFS1/xCT axis as a targetable vulnerability in hypoxic solid tumors

Shawn C Chafe et al. Sci Adv. .

Abstract

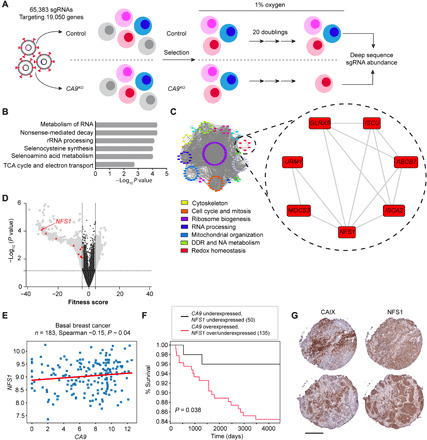
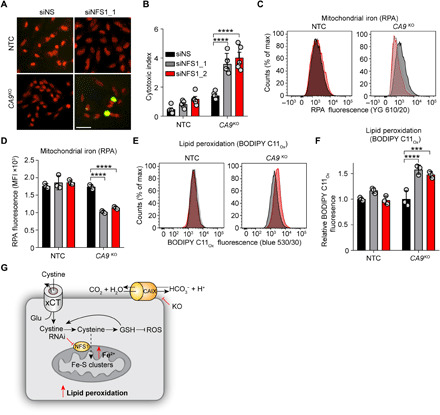
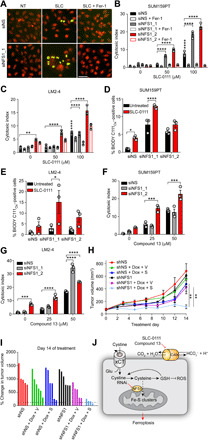
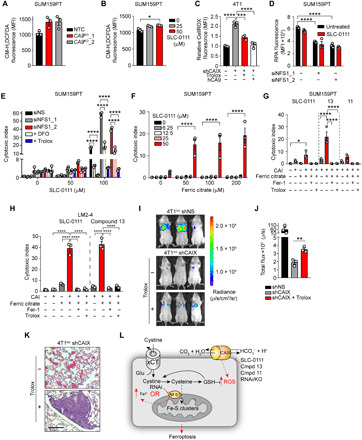
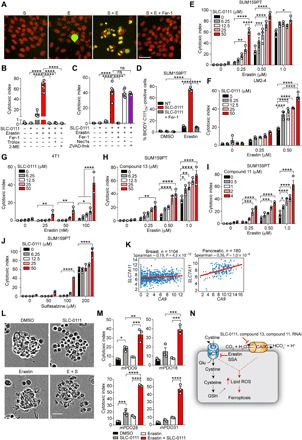
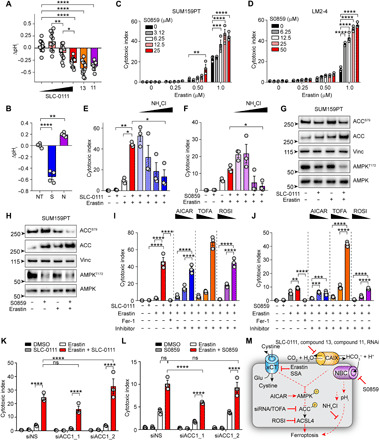
The metabolic mechanisms involved in the survival of tumor cells within the hypoxic niche remain unclear. We carried out a synthetic lethal CRISPR screen to identify survival mechanisms governed by the tumor hypoxia-induced pH regulator carbonic anhydrase IX (CAIX). We identified a redox homeostasis network containing the iron-sulfur cluster enzyme, NFS1. Depletion of NFS1 or blocking cyst(e)ine availability by inhibiting xCT, while targeting CAIX, enhanced ferroptosis and significantly inhibited tumor growth. Suppression of CAIX activity acidified intracellular pH, increased cellular reactive oxygen species accumulation, and induced susceptibility to alterations in iron homeostasis. Mechanistically, inhibiting bicarbonate production by CAIX or sodium-driven bicarbonate transport, while targeting xCT, decreased adenosine 5'-monophosphate-activated protein kinase activation and increased acetyl-coenzyme A carboxylase 1 activation. Thus, an alkaline intracellular pH plays a critical role in suppressing ferroptosis, a finding that may lead to the development of innovative therapeutic strategies for solid tumors to overcome hypoxia- and acidosis-mediated tumor progression and therapeutic resistance.


Figures

Fig. 1
Fig. 1. Identification of a synthetic lethal interaction between CA9 and NFS1.
(A) Diagram outlining scheme of screen. (B) Gene ontology identification of pathways most significantly affected by CA9 loss during growth in hypoxia. rRNA, ribosomal RNA. (C) Cytoscape visualization of gene networks identified color-coded according to biological pathway. DDR, DNA damage repair; NA, nucleic acid. (D) Volcano plot depicting synthetic lethal hit ranking according to fitness score. Red triangles denote redox homeostasis network genes from (C). (E) Relationship of NFS1 and CA9 expression in the TCGA invasive breast cancer dataset in basal cases. n = 183 cases. (F) Kaplan-Meier curve visualizing survival fractions of patients from the entire invasive breast cancer dataset stratified according to CA9 and NFS1 expression. (G) Representative sequential cores depicting CAIX and NFS1 expression on a TNBC tissue microarray by immunohistochemistry; n = 28. Scale bar, 200 μm. Statistical significance was assessed using (E) Spearman rank correlation or (F) Mantel-Cox log-rank test.
Fig. 2
Fig. 2. Combined loss of CA9 and NFS1 increases cellular iron pools and lipid peroxidation.
(A and B) Cell viability of the indicated cell lines following NFS1 depletion with siRNA over 96 hours in hypoxia. siNS, nonsilencing control siRNA. (A) Representative IncuCyte images. Green, cytotoxicity; red, nuclei. (B) Quantification of data in (A). Cells in (A) and (B) assessed for mitochondrial iron (RPA fluorescence) (C and D) and lipid peroxidation (BODIPY C11Ox fluorescence) (E and F) by flow cytometry. Flow plots (C and E) are colored according to (B); siNS, black; siNFS1_1, gray; siNFS1_2, red. MFI, mean fluorescence intensity. (G) Model depicting increase in mitochondrial iron and lipid peroxidation following suppression of NFS1 and CA9 expression. GSH, glutathione. Bars indicate means ± SEM. Shown are representative experiments from experiments performed at least twice. ***P < 0.001 and ****P < 0.0001. Statistical significance was assessed by two-way analysis of variance (ANOVA).
Fig. 3
Fig. 3. NFS1 suppression combined with CAIX/XII inhibitors triggers ferroptosis.
(A to C) Cell viability data of the indicated cell lines following NFS1 depletion in combination with SLC-0111 in the presence or absence of Fer-1 (2 μM) for 72 hours in hypoxia. (A) Representative IncuCyte images of the indicated treatments. Green, cytotoxicity; red, nuclei. (B and C) Quantitation of IncuCyte data for the indicated cell lines treated and cultured in hypoxia for 72 hours. (D and E) Lipid peroxidation (BODIPY C11Ox fluorescence) of the indicated cell lines treated as in (B) and (C) by flow cytometry. (F and G) Cell viability of the indicated cell lines following NFS1 depletion and treatment with compound 13 for 72 hours in hypoxia. (H) Tumor growth curve of orthotopic SUM159PT control (shNS) or NFS1-depleted (shNFS1) tumors treated with vehicle or SLC-0111 following induction of shRNA with Dox. n = 4 to 6 per group. V, vehicle; S, SLC-0111. (I) Waterfall plot depicting percent change in individual tumor volume of the groups color coded as in (H) following 14 days of treatment. (J) Model depicting CAIX inhibition combined with NFS1 depletion triggering ferroptosis. Bars represent means ± SEM (B to H). *P < 0.05, **P < 0.01, ***P < 0.001, and ****P < 0.0001. Statistical significance was assessed using two-way ANOVA followed by Tukey’s multiple comparison test post hoc (B to G) or by ANOVA followed by Bonferroni correction (H). Shown are representative data from experiments performed at least twice. Scale bar, 50 μm.
Fig. 4
Fig. 4. CAIX suppresses ROS production.
Cellular ROS levels in hypoxic SUM159PT CA9KO (A) SLC-0111–treated (B) and CAIX-depleted 4T1luc cells (C) following 72 hours of exposure to hypoxia detected with CM-H2DCFDA (A and B) and CellROX Deep Red (C). (D) Mitochondrial iron (RPA fluorescence) levels in hypoxic NFS1-depleted SUM159PT cells treated with SLC-0111 for 72 hours in hypoxia. (E) Cell viability of SUM159PT cells treated with NFS1 siRNA and the indicated concentrations of SLC-0111 in the presence or absence of deferoxamine (DFO; 10 μM) or Trolox (100 μM) for 72 hours in hypoxia. (F) Cell viability of SUM159PT cells treated with the indicated concentrations of ferric citrate in combination with SLC-0111 for 72 hours in hypoxia. (G) Cell viability of SUM159PT or (H) LM2-4 cells treated with ferric citrate together with SLC-0111, compound 13 (13), or compound 11 (11) in the presence or absence of Fer-1 (2 μM) or Trolox (100 μM) for 72 hours in hypoxia. CAI, carbonic anhydrase inhibitor. (I) Bioluminescent images depicting metastatic burden of intravenously injected 4T1luc shNS, 4T1luc shCAIX, and 4T1luc shCAIX cells pretreated with Trolox. n = 3 per group. (J) Quantitation of total chest bioluminescence of the groups in (H). (K) Representative hematoxylin and eosin–stained lung sections from shCAIX groups in (H). Scale bar, 200 μm. (L) Model depicting increased ROS resulting from CAIX/XII inhibition inducing vulnerability to perturbations in iron levels. Bars represent means ± SEM. Shown are representative experiments from experiments performed at least twice. *P < 0.05, **P < 0.01, and ****P < 0.0001. Statistical significance was assessed using one-way (B, C, G, and H) or two-way (D to F) ANOVA followed by Tukey’s multiple comparisons test post hoc or by t test (I).
Fig. 5
Fig. 5. CAIX/XII inhibition potentiates ferroptosis induced by xCT inhibition.
(A) IncuCyte images of cell viability following treatment of SUM159PT cells with SLC-0111 (S) (50 μM) and erastin (E) (0.5 μM) for 72 hours in hypoxia in the presence or absence of Fer-1 (2 μM). Green, cytotoxicity; red, nuclei. Cell viability of SUM159PT cells treated with SLC-0111 and erastin as in (A) in the presence of (B) Fer-1 (2 μM), Trolox (100 μM), 2-ME (50 μM), (C) Nec1s (50 μM), or ZVAD-FMK (25 μM) for 72 hours in hypoxia. ns, not significant. (D) Lipid peroxidation (BODIPY C11Ox fluorescence) in SUM159PT cells treated as in (A). Cell viability of (E, H, I, and J) SUM159PT, (F) LM2-4luc, and (G) 4T1luc cells treated with the indicated concentrations of erastin together with SLC-0111 (A to G), compound 13 (H), compound 11 (I), or sulfasalazine (SSA) together with SLC-0111 (J) for 72 hours in hypoxia. (K) Analysis of CA9 and SLC7A11 expression in the indicated TCGA datasets. (L and M) Cell viability of PDAC patient–derived organoids treated with erastin (10 μM) and SLC-0111 (50 μM) for 72 hours. (L) Representative images of the indicated combinations in mPDO28. (M) Cell viability data of organoids from four separate patients following treatment with the indicated compounds. (N) Model depicting CAIX/XII inhibition in combination with blocking cystine uptake increases ferroptosis. Bars represent means ± SEM. Shown are representative experiments from experiments performed at least twice. *P < 0.05, **P < 0.01, ***P < 0.001, and ****P < 0.0001. Statistical significance was assessed using one-way (J) or two-way ANOVA (B to G) followed by Tukey’s multiple comparisons test post hoc or (H) Spearman rank correlation. Scale bars, 50 μm.
Fig. 6
Fig. 6. Cotargeting CAIX/XII and xCT blunts signaling through AMPK to enhance ferroptosis in a pH-dependent manner.
(A and B) pHi measurements in hypoxic SUM159PT cells following the indicated treatments for 72 hours. (A) SLC-0111 (0, 25, 50, and 100 μM,), compound 11 (2 μM), and compound 13 (50 μM); (B) NT, untreated; S, S0859 (25 μM); N, NH4Cl (2.5 mM). Cell viability of hypoxic (C) SUM159PT and (D) LM2-4 treated with the indicated concentrations of S0859 and erastin for 72 hours. Cell viability of SUM159PT cells treated with SLC-0111 (50 μM) and erastin (0.5 μM) (E) or S0859 (50 μM) and erastin (F) in the presence of NH4Cl (1, 2.5, 5, and 10 mM) for 72 hours in hypoxia. Indicated protein levels of SUM159PT cells treated with (G) SLC-0111 (12.5 μM) and erastin (0.25 μM) or (H) S0859 (12.5 μM) and erastin (0.25 μM) for 72 hours in hypoxia. Cell viability data of SUM159PT treated with erastin and SLC-0111 (I) or S0859 (J) together with the indicated compounds for 72 hours in hypoxia. AICAR (0.25, 0.5, and 1.0 μM), TOFA (12.5, 25, and 50 μM), and rosiglitazone (ROSI; 1.0, 5.0, and 10 μM). Cell viability data of SUM159PT treated with siRNA to ACC1 together with SLC-0111 (K) or S0859 (L) and erastin for 72 hours in hypoxia. (M) Model depicting role of CAIX and sodium-driven bicarbonate cotransporters in pH homeostasis and suppression of ferroptosis. Bars indicate means ± SEM. Shown are representative experiments from experiments performed at least twice. *P < 0.05, **P < 0.01, ***P < 0.001, and ****P < 0.0001. Statistical significance was assessed using t test with Welch’s correction (F) or one-way (A, B, E, I, and J) or two-way ANOVA (C, D, K, and L) followed by Tukey’s multiple comparisons test post hoc.

References

    1. Wilson W. R., Hay M. P., Targeting hypoxia in cancer therapy. Nat. Rev. Cancer 11, 393–410 (2011). - PubMed
    1. McKeown S. R., Defining normoxia, physoxia and hypoxia in tumours-implications for treatment response. Br. J. Radiol. 87, 20130676 (2014). - PMC - PubMed
    1. Lee P., Chandel N. S., Simon M. C., Cellular adaptation to hypoxia through hypoxia inducible factors and beyond. Nat. Rev. Mol. Cell Biol. 21, 268–283 (2020). - PMC - PubMed
    1. Corbet C., Feron O., Tumour acidosis: From the passenger to the driver’s seat. Nat. Rev. Cancer 17, 577–593 (2017). - PubMed
    1. Neri D., Supuran C. T., Interfering with pH regulation in tumours as a therapeutic strategy. Nat. Rev. Drug Discov. 10, 767–777 (2011). - PubMed

Publication types