. 2021 Aug 27;11(1):442.
doi: 10.1038/s41398-021-01559-5.

Cerebral μ-opioid and CB1 receptor systems have distinct roles in human feeding behavior

Affiliations

Cerebral μ-opioid and CB1 receptor systems have distinct roles in human feeding behavior

Tatu Kantonen et al. Transl Psychiatry. .

Abstract

Eating behavior varies greatly between individuals, but the neurobiological basis of these trait-like differences in feeding remains poorly understood. Central μ-opioid receptors (MOR) and cannabinoid CB1 receptors (CB1R) regulate energy balance via multiple neural pathways, promoting food intake and reward. Because obesity and eating disorders have been associated with alterations in the brain's opioid and endocannabinoid signaling, the variation in MOR and CB1R system function could potentially underlie distinct eating behavior phenotypes. In this retrospective positron emission tomography (PET) study, we analyzed [11C]carfentanil PET scans of MORs from 92 healthy subjects (70 males and 22 females), and [18F]FMPEP-d2 scans of CB1Rs from 35 subjects (all males, all also included in the [11C]carfentanil sample). Eating styles were measured with the Dutch Eating Behavior Questionnaire (DEBQ). We found that lower cerebral MOR availability was associated with increased external eating-individuals with low MORs reported being more likely to eat in response to environment's palatable food cues. CB1R availability was associated with multiple eating behavior traits. We conclude that although MORs and CB1Rs overlap anatomically in brain regions regulating food reward, they have distinct roles in mediating individual feeding patterns. Central MOR system might provide a pharmacological target for reducing individual's excessive cue-reactive eating behavior.


Conflict of interest statement

The authors declare no competing interests.

Figures

Fig. 1
Fig. 1. Mean distribution of central μ-opioid and CB1 receptors.
a Mean binding potential (BPND) of the 92 subjects (70 males and 22 females) studied with [11C]carfentanil. b Mean volume of distribution (VT) of the 35 males studied with [18F]FMPEP-d2.
Fig. 2
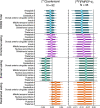
Fig. 2. Regional associations of Total DEBQ and subscale scores with μ-opioid and CB1 receptor availabilities.
The figure shows posterior distributions of the regression coefficients for Total DEBQ and subscale scores on log-transformed [11C]carfentanil binding potential (BPND) and [18F]FMPEP-d2 volume of distribution (VT) in ten regions of interest. Age (and PET scanner for [11C]carfentanil data) are controlled as covariates. The colored circles represent posterior means, the thick horizontal bars 80% posterior intervals, and the thin horizontal bars 95% posterior intervals.
Fig. 3
Fig. 3. Association between External eating and decreased μ-opioid receptor availability in the 92 subjects (70 males and 22 females) scanned with [11C]carfentanil.
The blue outline marks brain regions where lower [11C]carfentanil binding potential (BPND) associated with higher External eating score, age and PET scanner as nuisance covariates, cluster forming threshold p < 0.01, FWE corrected. In the red–yellow T-score scale shown are also additional bilateral associations significant with more lenient cluster-defining threshold (p < 0.05, FWE corrected) for visualization purposes.
Fig. 4
Fig. 4. Total Dutch Eating Behavior Questionnaire (DEBQ) score associated with decreased CB1 receptor availability in the 35 males scanned with [18F]FMPEP-d2.
The blue outline marks brain regions where lower [18F]FMPEP-d2 volume of distribution (VT) associated with higher Total DEBQ score, age as a nuisance covariate, cluster forming threshold p < 0.01, FWE corrected. In the red–yellow T-score scale shown are also additional associations significant with more lenient cluster-defining threshold (p < 0.05, FWE corrected) for visualization purposes.

Similar articles

Cited by

References

    1. Guyenet SJ, Schwartz MW. Regulation of food intake, energy balance, and body fat mass: implications for the pathogenesis and treatment of obesity. J Clin Endocrinol Metab. 2012;97:745–55. doi: 10.1210/jc.2011-2525. - DOI - PMC - PubMed
    1. Larson N, Story M. A review of environmental influences on food choices. Ann Behav Med. 2009;38:56–73. doi: 10.1007/s12160-009-9120-9. - DOI - PubMed
    1. French SA, Epstein LH, Jeffery RW, Blundell JE, Wardle J. Eating behavior dimensions. Associations with energy intake and body weight. A Rev Appetite. 2012;59:541–49. doi: 10.1016/j.appet.2012.07.001. - DOI - PMC - PubMed
    1. Wardle J. Eating style: a validation study of the Dutch Eating Behaviour Questionnaire in normal subjects and women with eating disorders. J Psychosom Res. 1987;31:161–9. doi: 10.1016/0022-3999(87)90072-9. - DOI - PubMed
    1. Baños RM, Cebolla A, Moragrega I, Van Strien T, Fernández-Aranda F, Agüera Z, et al. Relationship between eating styles and temperament in an Anorexia Nervosa, Healthy Control, and Morbid Obesity female sample. Appetite. 2014;76:76–83. doi: 10.1016/j.appet.2014.01.012. - DOI - PubMed

Publication types