. 2021 Aug 27;12(1):5162.
doi: 10.1038/s41467-021-25293-0.

Extinction of threatened vertebrates will lead to idiosyncratic changes in functional diversity across the world

Affiliations

Extinction of threatened vertebrates will lead to idiosyncratic changes in functional diversity across the world

Aurele Toussaint et al. Nat Commun. .

Abstract

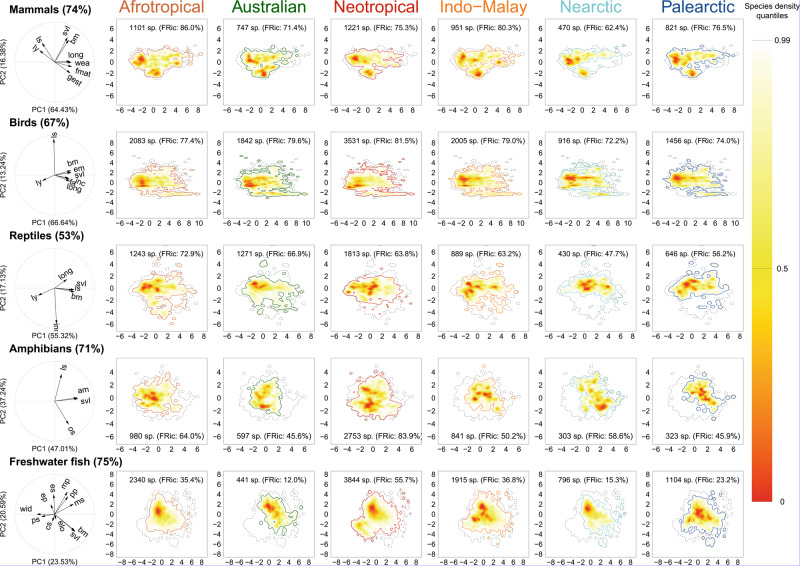
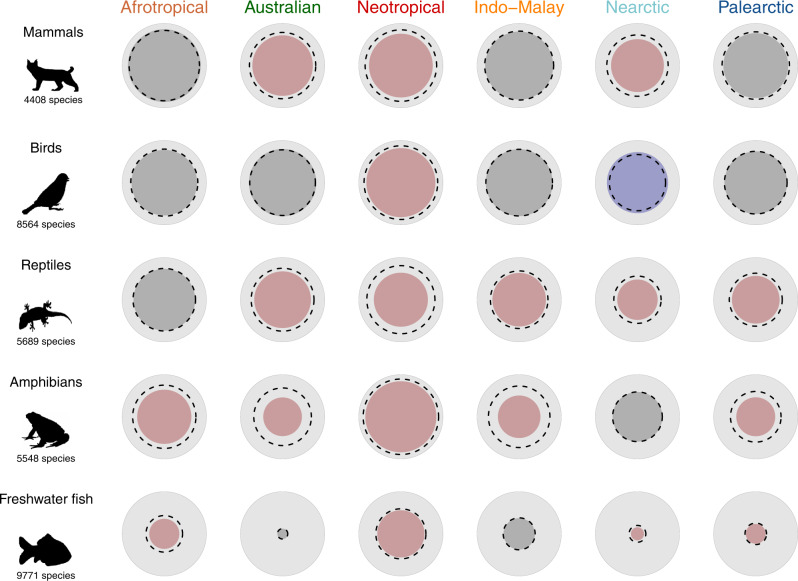
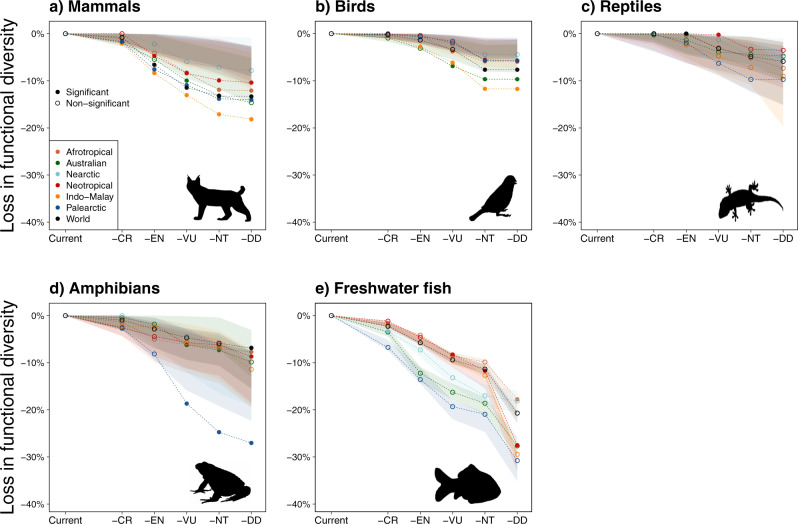
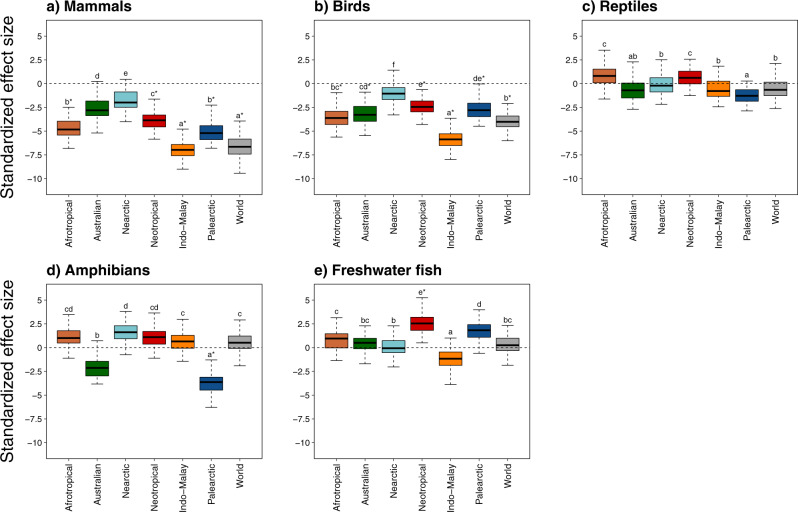
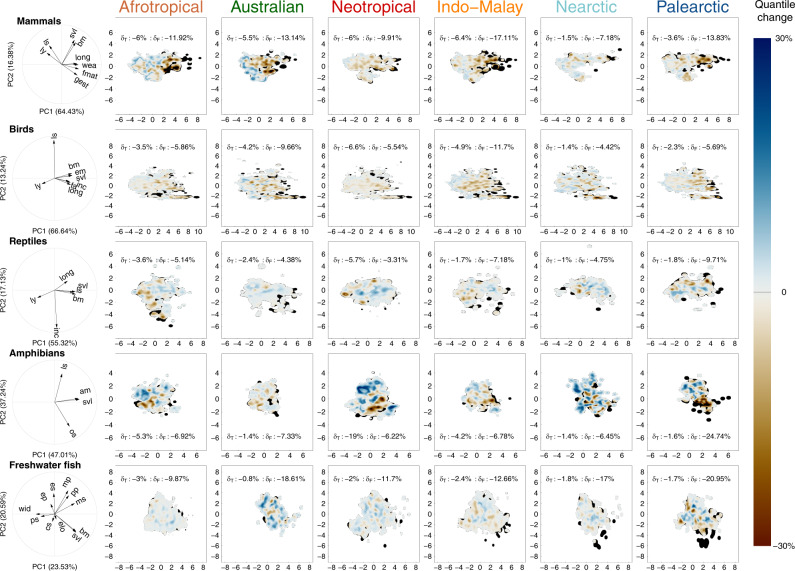
Although species with larger body size and slow pace of life have a higher risk of extinction at a global scale, it is unclear whether this global trend will be consistent across biogeographic realms. Here we measure the functional diversity of terrestrial and freshwater vertebrates in the six terrestrial biogeographic realms and predict their future changes through scenarios mimicking a gradient of extinction risk of threatened species. We show vastly different effects of extinctions on functional diversity between taxonomic groups and realms, ranging from almost no decline to deep functional losses. The Indo-Malay and Palearctic realms are particularly inclined to experience a drastic loss of functional diversity reaching 29 and 31%, respectively. Birds, mammals, and reptiles regionally display a consistent functional diversity loss, while the projected losses of amphibians and freshwater fishes differ across realms. More efficient global conservation policies should consider marked regional losses of functional diversity across the world.


Conflict of interest statement

The authors declare no competing interests.

Figures

Fig. 1
Fig. 1. Functional spectra of vertebrates in the six biogeographic realms.
Probabilistic species distributions are defined by the first two principal components of PCA considering the main functional traits for each group (see details in ‘Methods’). The correlation circles show the loadings of the considered traits in the resulting PCA for each group. Definitions of the trait abbreviations are in Table 1. For each group, the percentage of described species considered in the analysis is indicated. The colour gradient (red-yellow-white) depicts different densities of species in the functional space (i.e. red areas are more densely populated). Thick contour lines indicate the 0.99 quantiles, and thinner ones indicate quantile 0.5. The grey dotted line indicates the world’s 0.99 quantiles. The legends within each panel show the number of species and the functional richness measured as a proportion of the world’s functional richness. Global functional spectra of the six taxonomic groups (i.e. considering all species) are presented in Supplementary Fig. 3. Functional spectra and correlation circles have been made using R (codes are available online, see ‘Code availability’). Source data are provided as a Source data file.
Fig. 2
Fig. 2. Functional richness of vertebrates in the six biogeographic realms.
For each taxonomic group, the background light grey circle represents the world’s functional richness (i.e. considering all species of the group). The inner coloured circle represents the proportion of the world’s functional richness hosted by each realm. The dotted line represents the mean expected functional richness calculated with a null model where the same number of species were randomly selected from the world’s pool of species (see details in the ‘Methods’). The colour of the inner circle shows whether the functional richness was significantly higher (blue), lower (red) or not significantly different (grey) than a random expectation. Silhouettes were downloaded from PhyloPic (www.phylopic.org). Figures have been made using R (codes are available online, see ‘Code availability’). Source data are provided as a Source data file.
Fig. 3
Fig. 3. Simulated losses of functional diversity under five extinction scenarios.
For each taxonomic group (panels ae) and in each biogeographic realm (and the world), the loss of functional diversity is expressed as a percentage of the current functional diversity of the biogeographic realm (or the world). We simulated the loss of functional diversity by removing all species from the IUCN category in a progressive framework. We started removing the species with a higher risk of extinction (i.e. -CR), then we continued progressively removing the species from the categories with lower threatened risks (-EN: CR + EN, -VU: CR + EN + VU, -NT: CR + EN + VU + NT, -DD: CR + EN + VU + NT + DD). In the figure, the name of the scenario refers to the lower IUCN threat category simulated as extinct (e.g. -EN scenario considers extinctions of all CR and EN species). For each scenario, we compared the loss of functional diversity with 999 repetitions of a null model where threatened species were randomly selected among all the species present in the corresponding realm. The 999 losses of functional diversity are represented for each realm as a polygon of the confidence interval at 95%. The open circles depicted a simulated loss not significantly different than expected under the null model whereas close circles depicted a simulated loss significantly higher or lower than expected under the null model, and thus outside their correspondent polygon. Silhouettes were downloaded from PhyloPic (www.phylopic.org). Figures have been made using R (codes are available online, see ‘Code availability’). Source data are provided as a Source data file.
Fig. 4
Fig. 4. Differences in functional diversity loss among realms for the -NT extinction scenario.
For each taxonomic group (panels ae), we tested whether the standardized effect size (SES) values of the potential loss in the functional richness of each biogeographic realm significantly differ from each other using multiple pairwise comparison tests. SES distributions were obtained using a bootstrapping procedure (n = 1000 repetitions, see the ‘Methods’ for details). The results correspond to the -NT extinction scenario where the species considered as threatened by IUCN (i.e. CR, EN, VU and NT) were removed. Similar analyses were made for all the extinction scenarios and presented in Supplementary Fig. 9. We show for each group a compact letter displays of all pairwise comparisons with a significance level of 5%. The SES values significantly different than expected under null models are identified by an asterisk. Boxes show the median, first and third quartiles and boxes whiskers cover 95% of the distribution range. Source data are provided as a Source data file.
Fig. 5
Fig. 5. Shifts in the functional diversity after the simulated extinction of threatened species for the taxonomic groups.
For each group, the shifts in functional diversity are shown for the six biogeographic realms following the -NT extinction scenario (i.e. species considered as CR, EN, VU and NT were removed). Differences (expressed in quantiles changes) are calculated between the functional spectra of species assessed by the IUCN Red List before and after removing species classified as threatened (see definition in the ‘Methods’). Brown tones reflect the threatened functional space after projected extinctions (i.e. areas representing trait values becoming relatively less frequent at the realm scale), and blue tones reflect the favourable functional space after extinctions (i.e. areas representing trait values becoming relatively more frequent at the realm scale). Black areas represent the lost functional space after extinctions. For each panel, the proportion of species (δT) and the proportion of total functional space (δF) that would be lost after extinction (expressed as a percentage of the current taxonomic and functional richness, respectively) is indicated. The functional shifts for all scenarios are in Supplementary Fig. 6 and associated values of functional diversity losses are in Supplementary Data 2. The correlation circles show the loadings of the considered traits in the resulting PCA for each group. Definitions of the trait abbreviations are in Table 1. Source data are provided as a Source data file.

Similar articles

Cited by

References

    1. Pimm SL, et al. The biodiversity of species and their rates of extinction, distribution, and protection. Science. 2014;344:1246752. doi: 10.1126/science.1246752. - DOI - PubMed
    1. Barnosky AD, et al. Has the Earth’s sixth mass extinction already arrived? Nature. 2011;471:51–57. doi: 10.1038/nature09678. - DOI - PubMed
    1. Ceballos G, et al. Accelerated modern human-induced species losses: entering the sixth mass extinction. Sci. Adv. 2015;1:e1400253. doi: 10.1126/sciadv.1400253. - DOI - PMC - PubMed
    1. IPBES. Global assessment report on biodiversity and ecosystem services of the Intergovernmental Science-Policy Platform on Biodiversity and Ecosystem Services. (eds Brondizio, E. S., Settele, J., Díaz, S. & Ngo, H. T.) 1148 (IPBES secretariat, Bonn, Germany, 2019). 10.5281/zenodo.3831673.
    1. Purvis A, Gittleman JL, Cowlishaw G, Mace GM. Predicting extinction risk in declining species. Proc. R. Soc. Lond. Ser. B Biol. Sci. 2000;267:1947–1952. doi: 10.1098/rspb.2000.1234. - DOI - PMC - PubMed

Publication types