Clinical Trial
. 2021 Aug 27;12(1):5155.
doi: 10.1038/s41467-021-25332-w.

The PEMDAC phase 2 study of pembrolizumab and entinostat in patients with metastatic uveal melanoma

Affiliations
Clinical Trial

The PEMDAC phase 2 study of pembrolizumab and entinostat in patients with metastatic uveal melanoma

Lars Ny et al. Nat Commun. .

Abstract

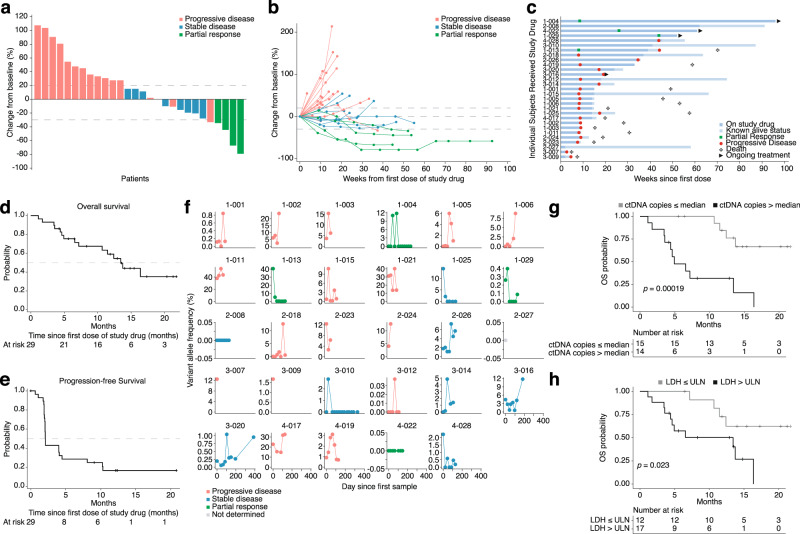
Preclinical studies have suggested that epigenetic therapy could enhance immunogenicity of cancer cells. We report the results of the PEMDAC phase 2 clinical trial (n = 29; NCT02697630) where the HDAC inhibitor entinostat was combined with the PD-1 inhibitor pembrolizumab in patients with metastatic uveal melanoma (UM). The primary endpoint was objective response rate (ORR), and was met with an ORR of 14%. The clinical benefit rate at 18 weeks was 28%, median progression free survival was 2.1 months and the median overall survival was 13.4 months. Toxicities were manageable, and there were no treatment-related deaths. Objective responses and/or prolonged survival were seen in patients with BAP1 wildtype tumors, and in one patient with an iris melanoma that exhibited a UV signature. Longer survival also correlated with low baseline ctDNA levels or LDH. In conclusion, HDAC inhibition and anti-PD1 immunotherapy results in durable responses in a subset of patients with metastatic UM.Trial registration ClinicalTrials.gov registration number: NCT02697630 (registered 3 March 2016). EudraCT registration number: 2016-002114-50.


Conflict of interest statement

Lars Ny received a research grant from MSD and Syndax Pharmaceuticals to support some aspects of the PEMDAC study. Anders Ståhlberg is the coinventor of SiMSen-Seq (ctDNA measurement), is a board member of, and has stock ownership in SiMSen Diagnostics. The remaining authors declare no conflict of interest.

Figures

Fig. 1
Fig. 1. Clinical outcome data from the PEMDAC trial at data cutoff in December 2019.
a Waterfall plot showing maximum change in sum of target lesion diameter from baseline to data cutoff. One patient did not have a response assessment after baseline and is not included in the figure. Dotted lines represent thresholds for progressive disease (+20%) and partial response (−30%), respectively, according to RECIST v1.1 criteria. b Spider plot showing change in the sum of target lesion diameter over time for all patients with at least one follow-up scan. c Swimmer’s plot showing time on treatment, time to best response, and duration of response in all patients who received at least one dose of study drug. In panels (a,b), n = 28 and in (c) n = 29 patients are shown, respectively. d Kaplan–Meier analysis showing overall survival (OS) of all patients. e Kaplan–Meier analysis showing progression-free survival (PFS) of all patients except one. f Circulating tumor DNA levels in patients with UM. Plasma from twenty-five patients was analyzed for the presence of mutated reads in either GNA11 (Q209L) or GNAQ (Q209L/P). Variant allele frequencies (VAF) in percent compared with reads with wildtype alleles are plotted. g Kaplan–Meier analysis comparing OS between patients with high or low (relative to median) levels of total detected ctDNA copies, n = 14 and n = 15 patients, respectively. h Kaplan–Meier analysis comparing OS between patients with lactate dehydrogenase (LDH) baseline greater or lower than the upper limit of normal (ULN), n = 17 and n = 12 patients, respectively. In (g, h), p-values for survival associations were calculated using log-rank tests. No adjustments for multiple comparisons were made. All statistical tests were two-sided. Source data are provided as a Source Data file.
Fig. 2
Fig. 2. Genetic analyses of pretreatment biopsies from patients recruited to the PEMDAC trial.
a Mutations in genes that are either recurrently altered in UM or listed among COSMIC Cancer Gene Census driver genes. Responses in the trial are indicated. b Copy number profiles of each tumor inferred from exome sequencing data of tumors and matched normal tissue. Differences in color intensity depend on copy number amplitude and tumor purity. c, d OS and PFS analyses comparing patients with GNAQ- or GNA11-mutated UM (n = 21). e Fisher’s exact test of BAP1 mutational status versus responses in the PEMDAC trial. PD: progressive disease; SD: stable disease; PR: partial response. f Number of detected mutations from exome-sequencing data. g CT scans of patient 4–022 at baseline and at best response (22 months post therapy). Arrows show PET-positive lesions that disappeared from the dorsal neck region and left gluteus. h, i Comparison of OS and PFS to assess if UM patients with a wild-type BAP1 status or a UV-damaged genome survive longer than the other patients (n = 24). In (c, d) and (h, i), p-values for survival associations were calculated using log-rank tests. No adjustments for multiple comparisons were made. All statistical tests were two-sided. Source data are provided as a Source Data file.
Fig. 3
Fig. 3. Immune profiles of pre- and post-treatment (one cycle) blood samples.
ac Flow cytometry analyses of changes in circulating cell populations in shorter and longer survivors following treatment with entinostat and pembrolizumab. Gating strategies can be found in Supplementary Fig. 5. (a) Graphs showing the frequency of CD3 + lymphocytes (left), CD14 + monocytes (middle), and CD33 + neutrophils (right) among patients with shorter (n = 12) and (b) longer (n = 12) survival prior to (circles) or after (squares) one cycle of treatment. (c) Analysis of CD8 + cytotoxic T cells in patients with shorter and longer survival. Statistical analysis was performed using multiple paired t-tests correct for multiple comparisons using a two-stage step-up (Benjamini, Krieger, and Yekutieli) with test between all groups in (ab), where * indicates adjusted p-values < 0.05. d White blood cells from three patients were analyzed by 10x Genomics TCR and gene expression analysis. Statistically altered genes in different cell types after treatment in the categories antigen presentation, immune-checkpoint receptors, and transcriptional regulation. n = 3 patient samples were compared pre- and post treatment. Genes shown were significant at q < 0.05. p-values were calculated with Wilcoxon rank-sum tests and adjusted for multiple comparisons with the Benjamini–Hochberg method. All statistical tests were two-sided. Source data are provided as a Source Data file.

References

    1. Bergman L, et al. Incidence of uveal melanoma in Sweden from 1960 to 1998. Invest. Ophthalmol. Vis. Sci. 2002;43:2579–2583. - PubMed
    1. Damato B. Treatment of primary intraocular melanoma. Expert Rev. Anticancer Ther. 2006;6:493–506. doi: 10.1586/14737140.6.4.493. - DOI - PubMed
    1. Jager MJ, et al. Uveal melanoma. Nat. Rev. Dis. Prim. 2020;6:24. doi: 10.1038/s41572-020-0158-0. - DOI - PubMed
    1. Kujala E, Makitie T, Kivela T. Very long-term prognosis of patients with malignant uveal melanoma. Invest. Ophthalmol. Vis. Sci. 2003;44:4651–4659. doi: 10.1167/iovs.03-0538. - DOI - PubMed
    1. Diener-West M, et al. Development of metastatic disease after enrollment in the COMS trials for treatment of choroidal melanoma: Collaborative Ocular Melanoma Study Group Report No. 26. Arch. Ophthalmol. 2005;123:1639–1643. doi: 10.1001/archopht.123.12.1639. - DOI - PubMed

Publication types

MeSH terms

Associated data