. 2021 Aug 27;12(1):5173.
doi: 10.1038/s41467-021-25207-0.

A pre-registered short-term forecasting study of COVID-19 in Germany and Poland during the second wave

Collaborators, Affiliations

A pre-registered short-term forecasting study of COVID-19 in Germany and Poland during the second wave

J Bracher et al. Nat Commun. .

Abstract

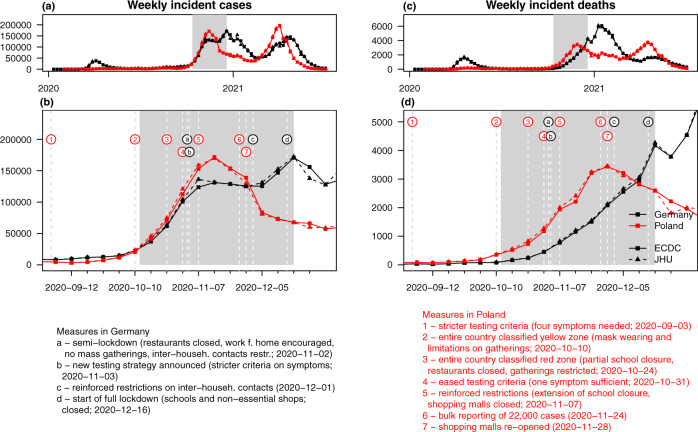
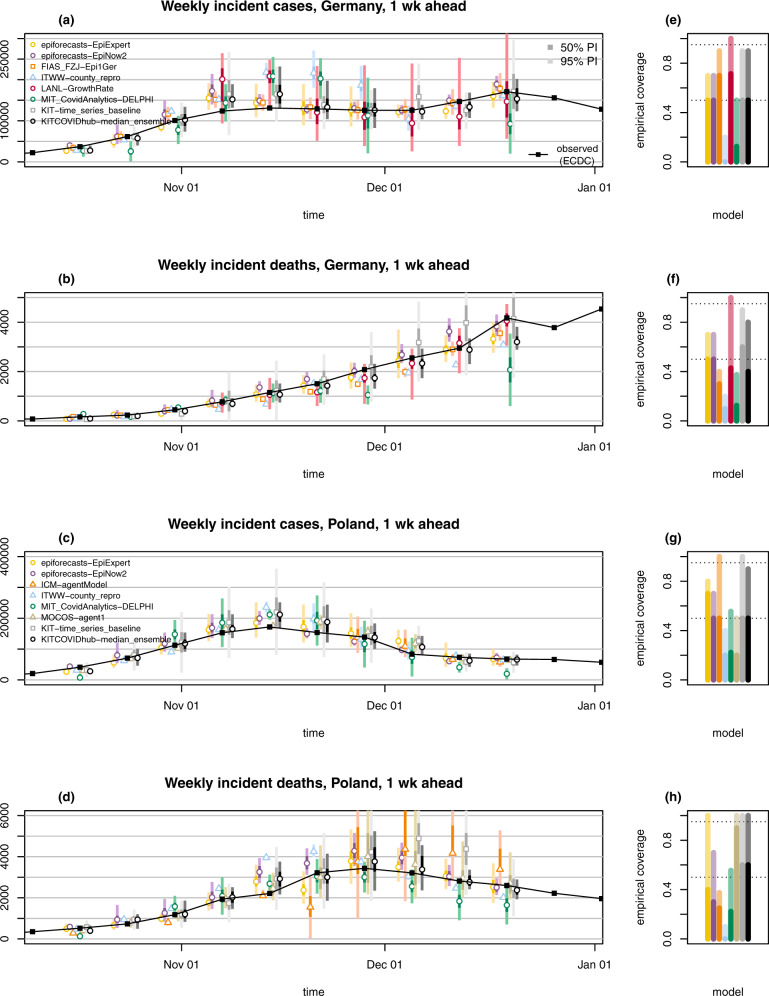
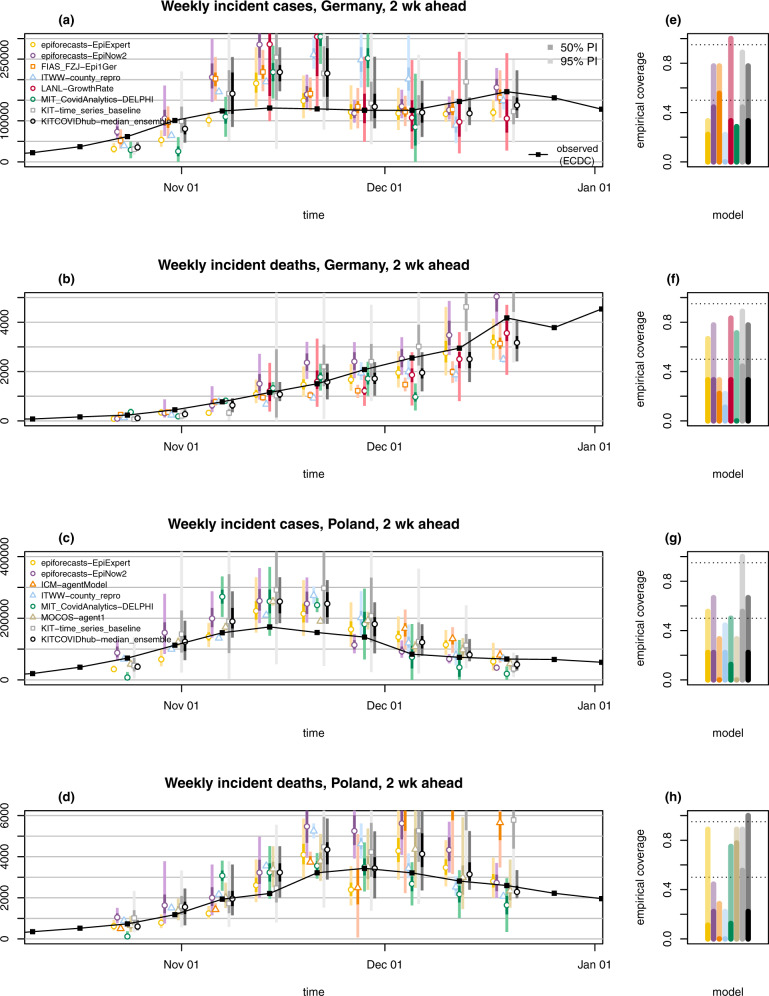
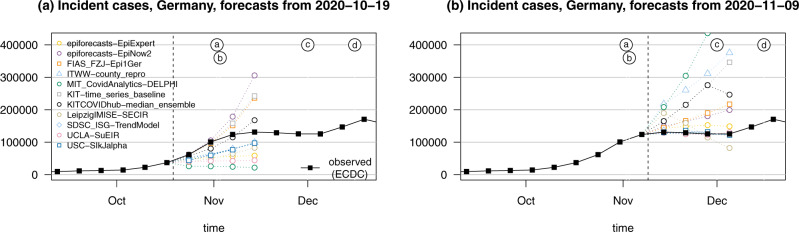
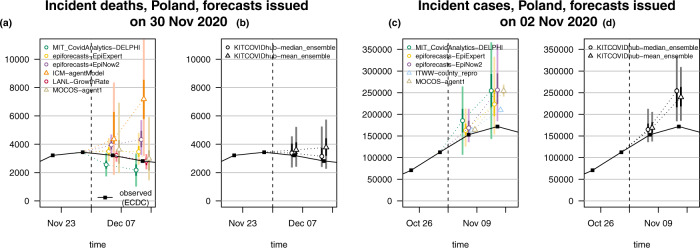
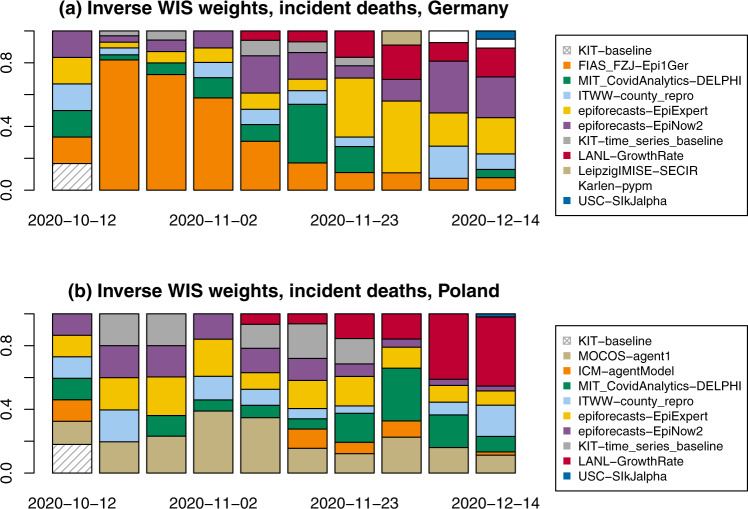
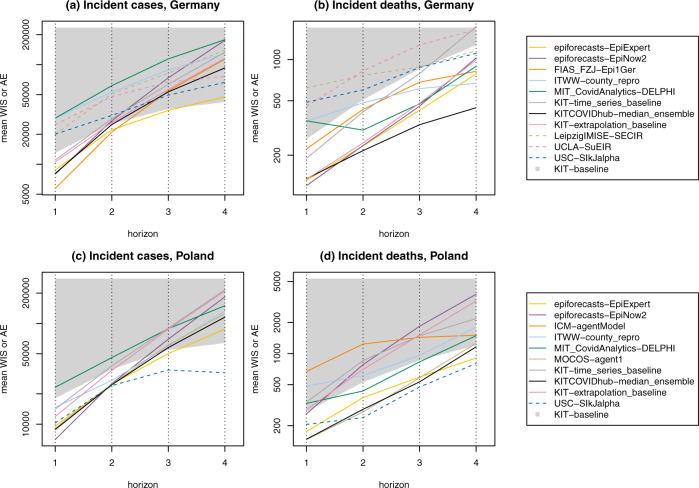
Disease modelling has had considerable policy impact during the ongoing COVID-19 pandemic, and it is increasingly acknowledged that combining multiple models can improve the reliability of outputs. Here we report insights from ten weeks of collaborative short-term forecasting of COVID-19 in Germany and Poland (12 October-19 December 2020). The study period covers the onset of the second wave in both countries, with tightening non-pharmaceutical interventions (NPIs) and subsequently a decay (Poland) or plateau and renewed increase (Germany) in reported cases. Thirteen independent teams provided probabilistic real-time forecasts of COVID-19 cases and deaths. These were reported for lead times of one to four weeks, with evaluation focused on one- and two-week horizons, which are less affected by changing NPIs. Heterogeneity between forecasts was considerable both in terms of point predictions and forecast spread. Ensemble forecasts showed good relative performance, in particular in terms of coverage, but did not clearly dominate single-model predictions. The study was preregistered and will be followed up in future phases of the pandemic.


Conflict of interest statement

The authors declare no competing interests.

Figures

Fig. 1
Fig. 1. Forecast evaluation period.
Weekly incident (a, b) confirmed cases and (c, d) deaths from COVID-19 in Germany and Poland according to data sets from the European Centre for Disease Prevention and Control (ECDC) and the Centre for Systems Science and Engineering at Johns Hopkins University (JHU). The study period covered in this paper is highlighted in grey. Important changes in interventions and testing are marked by letters/numbers and dashed vertical lines. Sources containing details on the listed interventions are provided in Supplementary Note 5.
Fig. 2
Fig. 2. One-week-ahead forecasts.
One-week-ahead forecasts of incident cases and deaths in Germany (a, b) and Poland (c, d). Displayed are predictive medians, 50% and 95% prediction intervals (PIs). Coverage plots (eh) show the empirical coverage of 95% (light) and 50% (dark) prediction intervals.
Fig. 3
Fig. 3. Two-week-ahead forecasts.
Two-week-ahead forecasts of incident cases and deaths in Germany (a, b) and Poland (c, d). Displayed are predictive medians, 50% and 95% prediction intervals (PIs). Coverage plots (eh) show the empirical coverage of 95% (light) and 50% (dark) prediction intervals.
Fig. 4
Fig. 4. Illustration of heterogeneity between incident case forecasts in Germany.
a Point forecasts issued by different models and the median ensemble on 19 October 2020. b Point forecasts issued on 9 November 2020. The dashed vertical line indicates the date at which forecasts were issued. Events marked by letters a–d are explained in Fig. 1.
Fig. 5
Fig. 5. Examples of median and mean ensembles.
One- and 2-week-ahead forecasts of incident deaths in Poland issued on 30 November, and of incident cases in Poland issued on 2 November 2020. Panels (a and c) show the respective member forecasts, panels (b and d) the resulting ensembles. Both predictive medians and 95% (light) and 50% (dark) prediction intervals are shown. The dashed vertical line indicates the date at which the forecasts were issued.
Fig. 6
Fig. 6. Examples of inverse WIS weights.
Inverse-WIS (weighted interval score) weights for forecasts of incident deaths in (a) Germany and (b) Poland.
Fig. 7
Fig. 7. Forecast performance 1 through 4 weeks ahead.
Mean-weighted interval score (WIS) by target and prediction horizon in Germany (a, b) and Poland (c, d). We display submitted models and the preregistered median ensemble (logarithmic y-axis). For models providing only point forecasts, the mean absolute error (AE) is shown (dashed lines). The lower boundary of the grey area represents the baseline model KIT-baseline. Line segments within the grey area thus indicate that a model fails to outperform the baseline. The numbers underlying this figure can be found in Tables 1 and 2.

References

    1. Keeling M, Rohani P. Modeling Infectious Diseases in Humans and Animals. Princeton, NJ: Princeton University Press; 2008.
    1. Baker RE, Peña J-M, Jayamohan J, Jérusalem A. Mechanistic models versus machine learning, a fight worth fighting for the biological community? Biol. Lett. 2018;14:20170660. doi: 10.1098/rsbl.2017.0660. - DOI - PMC - PubMed
    1. Dean NE, et al. Ensemble forecast modeling for the design of COVID-19 vaccine efficacy trials. Vaccine. 2020;38:7213–7216. doi: 10.1016/j.vaccine.2020.09.031. - DOI - PMC - PubMed
    1. Reich, N. & Rivers, C. Scientists want to predict COVID-19’s long-term trajectory. Here’s why they can’t. Washington Post (2020). Published 15 September 2020, https://www.washingtonpost.com/outlook/2020/09/15/scientists-want-predic...
    1. Nature Publishing Group. Editorial: Developing infectious disease surveillance systems. Nat. Commun. 11, 4962 (2020). - PMC - PubMed

Publication types